

Abstract
The medial nucleus of the trapezoid body (MNTB) in the superior olivary complex (SOC) is an inhibitory hub considered critical for binaural sound localization. We show that genetic ablation of MNTB neurons in mice only subtly affects this ability by prolonging the minimum time required to detect shifts in sound location. Furthermore, glycinergic innervation of the SOC is maintained without an MNTB, consistent with the existence of parallel inhibitory inputs. These findings redefine the role of MNTB in sound localization and suggest that the inhibitory network is more complex than previously thought.
Introduction
The superior olivary complex (SOC) is a collection of brainstem nuclei that play an important role in sound localization. In rodents, this process occurs primarily by activation of binaural pathways that allow processing of interaural level differences (ILDs) in the lateral superior olive (LSO) (Fig. 1K). There is clear evidence for the involvement of glycinergic innervation arising from the medial nucleus of the trapezoid body (MNTB) in ILD processing (Boudreau and Tsuchitani, 1968; Cant, 1984); however, previous attempts to define MNTB function in sound localization using physical lesion studies have been confounded by effects on other areas of the SOC and/or afferent projection fibers (Masterton et al., 1967; Casseday and Neff, 1975; Jenkins and Masterton, 1982; Kavanagh and Kelly, 1992; van Adel and Kelly, 1998). To determine the contribution of MNTB to sound localization, we used the Cre–loxP system to genetically ablate MNTB neurons. Our data suggest that the MNTB plays a specific role in sound localization and that some glycinergic innervation of the SOC arises from sources other than the MNTB.
Figure 1.
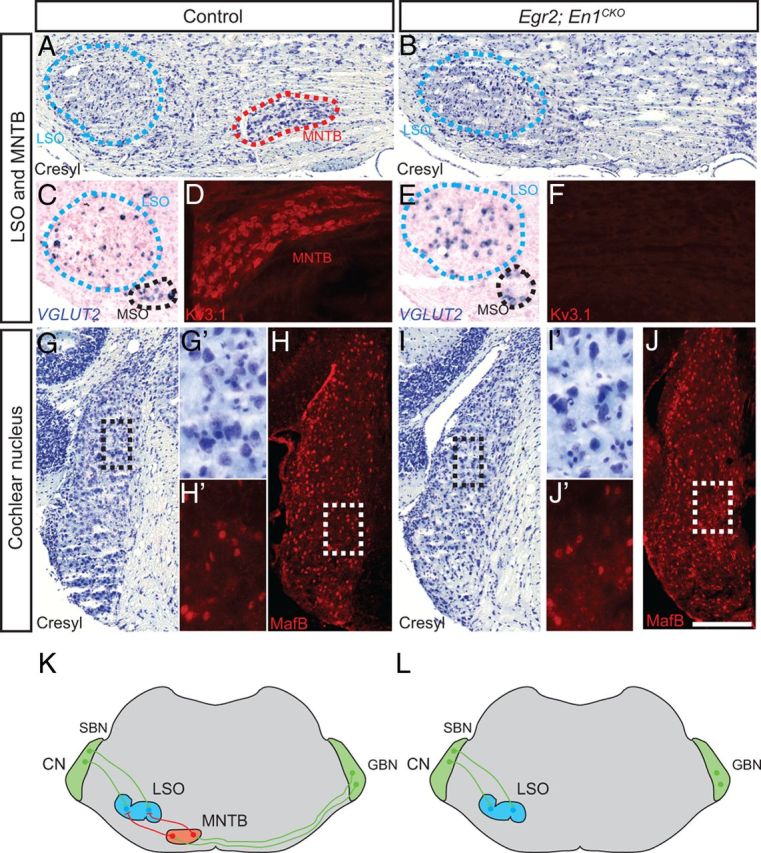
MNTB but not LSO or CN neurons are missing in Egr2;En1CKO mice. A, B, Cresyl violet-stained sections show the lack of MNTB neurons in Egr2;En1CKO mice, a finding confirmed by Kv3.1 immunostaining (D, F). C, E, In situ hybridization for VGLUT2 shows that glutamatergic LSO neurons are present in Egr2;En1CKO mice. MSO, Medial superior olive. Cresyl violet staining (G, I) and MafB immunohistochemistry (H, J) identify spherical (SBN) and globular (GBN) bushy neurons of the anteroventral CN; no changes in their distribution or morphology were observed in Egr2;En1CKO mice. Boxes in G–J are shown at higher magnification in G′–J′. K, L, Diagram of the ILD pathway in control and Egr2;En1CKO mice. Excitatory projections are green, and inhibitory are red. Scale bar: A–C, E, G–J, 250 μm; D, F, 200 μm; G′–J′, 100 μm.
Materials and Methods
Mice and mating paradigms
Experimental procedures were approved by the Case Western Reserve University Institutional Animal Care and Use Committee and in accordance with the United Kingdom Animals Act 1986. Matings of Egr2Cre/+ (Voiculescu et al., 2000) and En1flox/flox (Sgaier et al., 2007) mice generated transgenic mice of four genotypes: (1) Egr2+/+;En1+/flox; (2) Egr2+/+;En1flox/flox; (3) Egr2Cre/+;En1+/flox; and (4) Egr2Cre/+;En1flox/flox. Only Egr2Cre/+;En1flox/flox mice lack En1 expression in the Egr2 distribution (Egr2;En1CKO). Mice of the other three genotypes are referred to as “control” because they displayed no abnormal phenotypes and were indistinguishable based on the testing reported here. Strain background was C57BL/6J for Egr2Cre/+mice and mixed for En1flox mice; male and female mice were used for experiments.
Tissue harvesting and processing
Adult mice were transcardially perfused with 4% paraformaldehyde (PFA), and tissues were postfixed for 2 h at 4°C in 4% PFA. For paraffin sectioning, tissues were dehydrated and embedded in TissuePrep (Thermo Fisher Scientific) and then serially sectioned at 6 or 10 μm onto Superfrost/Plus slides (Thermo Fisher Scientific) using a Leica microtome. For frozen sectioning brains were cryoprotected in 30% sucrose/1× PBS for 48 h and then embedded in Tissue-Tek O.C.T. (Sakura Finetek), serially sectioned at 25 μm on a Leica CM1950 cryostat (Leica), collected on Superfrost/Plus slides, and stored at −80°C.
Histology
Adult brain sections were stained with cresyl violet, dehydrated, and mounted with Cytoseal 60 (Richard Allan Scientific). Series of slides were processed to allow exact matching of SOC levels between Egr2;En1CKO and control brains.
Immunohistochemistry
Frozen sections were rinsed in 1× PBS and then blocked for 1 h at room temperature in 1× PBS/0.3% Triton X-100/3% normal donkey or goat serum (blocking solution). Slides were incubated overnight at 4°C with primary antibodies diluted in blocking solution: mouse anti-Kv3.1 (NeuroMab) at 1:500; guinea pig anti-GlyT2 (Millipore) at 1:1000; and goat anti-MafB (Santa Cruz Biotechnology) at 1:500. Sections were rinsed in 1× PBS, and secondary antibodies conjugated to DyLight 488 or 549 (Jackson ImmunoResearch) were used at a 1:500 dilution applied for 1 h at room temperature. Sections were rinsed, mounted with ProLong Gold, and imaged using a Leica DM5500B epifluorescence microscope (Leica).
In situ hybridization
A 580 bp probe for VGLUT2 was generated using PCR primers flanked with HindIII (forward, 5′-CCCAAGCTTCCAAATCTTACGGTGCTACCT-3′) and NotI (reverse, 5′-AAGGAAAAAAGCGGCCGCAGCCATCTTTCCTGTTCCACT-3′) restriction enzyme sequences for cloning into pBluescript II KS. Probes were transcribed using the Ambion Maxiscript transcription kit (Invitrogen) and digoxigenin-11-UTP (Roche) and precipitated with yeast tRNA and ammonium acetate overnight at −20°C. Probes were centrifuged at 4°C for 30 min, and pellets were rinsed twice with 70% ethanol, air dried, and resuspended in 50 μl of DEPC water. Alexandra Joyner's (Memorial Sloan-Kettering Cancer Center, New York, NY) in situ hybridization protocol was used (www.mskcc.org/research/lab/alexandra-joyner/laboratory-protocols).
Cell and synaptic bouton counts, bouton size, and surface area coverage measurements
The number of VGLUT2-positive (VGLUT2+) neurons was counted on serial coronal sections through the LSO (n = 4 LSO from 2 mice per genotype). Glycinergic synaptic boutons were counted on photographs from four consecutive coronal sections through the center of the LSO and superior paraolivary nucleus (SPN) immunostained for GlyT2 and counterstained with NeuroTrace Nissl (n = 4 nuclei from 2 mice per genotype). GlyT2+ terminal number was counted on each neuron with an identifiable nucleus and reported as mean puncta per neuron ± SEM. GlyT2+ bouton size was measured in 720–1012 boutons per region (LSO or SPN) per genotype from the serial coronal sections by tracing the border of each bouton and converting to an area measurement (square micrometers) in NIH ImageJ 1.45I. The percentage of LSO and SPN neuronal surface area covered by GlyT2+ terminals was measured by tracing the neuronal soma border using the Brush Tool in one Photoshop CS5 (Adobe Systems) image layer followed by tracing the region in contact with each bouton in an overlapping layer. The length of these “contact lines” measured in pixels was summed, divided by the soma perimeter measurement, and then expressed as the percentage of the neuronal soma covered by GlyT2+ boutons. Statistical significance was determined by t test.
Dextran–tetramethyl–rhodamine tract tracing
Dextran–tetramethyl–rhodamine (molecular weight, 3000; Invitrogen D-3308) at 5% in sterile PBS was pressure injected unilaterally into the SPN from P22–P46 mice combined with electroporation (one 120 V, 130 ms pulse and then ten 50 V, 50 ms pulses) using a bipolar tungsten electrode connected to a BTX ECM 830 electroporator (Harvard Apparatus). Slices were kept at room temperature in the dark for at least 4 h before imaging. Images and z-stacks from live slices were taken with a Zeiss LSM510 scanning microscope equipped with a Mai-Tai Deep-See multiphoton laser (Spectra-Physics).
Electrophysiological recordings
In vitro preparations.
Mice (P15–P25) were decapitated, and brainstem slices containing the SOC were prepared as described previously (Johnston et al., 2008). Transverse slices (200 μm) containing the LSO and/or SPN were cut in low-sodium artificial CSF [aCSF; in mm: 250 sucrose, 2.5 KCl, 26 NaHCO3, 10 glucose, 1.25 NaH2PO4, 2 sodium pyruvate, 3 myo-inositol, 0.1 CaCl2, 4 MgCl2, and 0.5 ascorbic acid, pH 7.4 (bubbled with 95% O2, 5% CO2)] at ∼0°C. Slices were maintained in normal aCSF (same as above but sucrose replaced by 125 mm NaCl, 22 mm CaCl, and 1 mm MgCl2) at 37°C for 1 h, after which they were stored at ∼20°C in a continually recycling slice-maintenance chamber. Experiments were conducted at 36 ± 1°C using a Peltier-driven environmental chamber or a CI7800 feedback temperature controller (Campden Instruments).
Patch clamp.
Whole-cell patch-clamp and current-clamp recordings were made from visually identified LSO and SPN neurons (Nikon FN600 microscope with differential interference contrast optics; see Fig. 3I) using an Axopatch 700B amplifier (Molecular Devices) and pClamp10 software (Molecular Devices), with sampling at 50 kHz and filtering at 10 kHz. Patch pipettes were pulled from borosilicate glass capillaries (GC150F-7.5, 1.5 mm outer diameter; Harvard Apparatus) using a two-stage vertical puller (PC-10; Narishige). Resistance was ∼3.0 MΩ when filled with patch solution containing the (in mm): 97.5 K-gluconate, 32.5 KCl, 40 HEPES, 5 EGTA, 1 MgCl2, and 5 Na2-phosphocreatine, pH 7.2. External solution contained the following (in mm): 95 NaCl, 26.2 NaHCO3, 30 tetraethylammonium Cl, 2.5 KCl, 10 glucose, 1.25 NaH2PO4, 0.5 ascorbic acid, 1.3 MgCl2, 2 CaCl2, 0.01 bicuculline, 0.01 CNQX, 0.05 d-AP-5, and 0.001 strychnine. We corrected for a liquid junction potential of 11 mV. Synaptic responses were evoked with a bipolar platinum electrode placed across the MNTB (or its usual location), and stimulus trains were evoked using a DS2A isolated stimulator (∼1–10 V, 0.2 ms; Digitimer). Minimum stimulation was used to characterize synaptic currents.
Figure 3.

Functional glycinergic inputs to LSO and SPN neurons are present in adult Egr2;En1CKO mice. A–D, GlyT2 immunohistochemistry in SOC tissue sections. C, D, Boxed areas from A and B at higher magnification. Green GlyT2+ boutons surround neuronal cell bodies (Neurotrace Nissl, red) of LSO neurons. Bouton number on single neurons (boxes) is shown in insets. E–H, Dextran–rhodamine injections (n = 3 per genotype) into the ipsilateral SPN retrogradely labeled MNTB neurons (arrowheads; dotted line outlines MNTB) in control (E) but not Egr2;En1CKO (F) mice. Labeled fibers (located between arrows in E, F) coursed past the MNTB and crossed the midline (dotted lines in G, H) in both genotypes. D, Dorsal; M, medial. I, Coronal slice showing location of stimulation electrode and patch pipette in the SPN. Insets illustrate view down the microscope showing MNTB neurons (control) or their absence (Egr2;En1CKO). J, Current-clamp recording of an SPN neuron from an Egr2;En1CKO mouse. Ten superimposed traces of a 100 Hz/100 ms pulse train, followed by offset action potentials (top trace). The offset response was strychnine sensitive (middle trace), and all synaptic activity was blocked after additional application of CNQX, d-AP-5, and bicuculline (bottom trace). K, Voltage-clamp recording of Egr2;En1CKO mouse SPN shows that IPSCs are sensitive to strychnine. L, Synaptic currents in SPN and LSO neurons from control (gray top traces) and Egr2;En1CKO mice (black, bottom traces) were unaffected by sequential application of glutamate and GABA receptor antagonists but ultimately blocked by strychnine. The remaining isolated glycinergic currents had slower kinetics in slice cultures from Egr2;En1CKO mice (arrows). M, IPSC decay time constants were measured by fitting a single exponential to an average of 10 traces (**p < 0.01, ***p < 0.001). Number of recordings is shown in bars. N, O, Diagrams showing glycinergic innervation of the LSO and SPN in control and Egr2;En1CKO mice. Scale bars: A, B, I, 250 μm; C, D, 30 μm; insets, 12 μm; E–H, 110 μm.
Auditory brainstem evoked response testing
Auditory brainstem evoked response (ABR) testing was performed using a SmartEP system (Intelligent Hearing Systems). Six 9-week-old mice were anesthetized with ketamine (100 mg/kg) and xylazine (5 mg/kg) and placed on a water blanket linked to a heat pump (Gaymar Industries) to maintain normal body temperature. Platinum subdermal needle electrodes were positioned at the ventral surface of the tympanic bulla (recording on one side, ground on the other) referenced to an electrode placed at the skull vertex. Pure tone stimuli (2 ms duration) of 4, 8, 12, 16, and 32 kHz ranging from 10 to 80 dB SPL in 10 dB steps were generated using high-frequency transducers and delivered directly to the ear through plastic tubing. Five hundred ABR responses were sampled and averaged at each frequency.
Behavioral measure of auditory spatial acuity
Auditory spatial acuity was determined using a “speaker-swap” procedure (Fig. 2B; Allen and Ison, 2012) conducted in a Whisper Room SE 2000 with air ventilation during daylight hours. Room acoustics were measured using a Quest 1900 sound level meter with a ¼ inch microphone (Bruel and Kjaer 4135).
Figure 2.

Egr2;En1CKO mice have decreased/absent ABR wave III and take longer to detect sound source switches. A, Representative ABR waveforms (16 kHz, 80 dB) of control (top trace) and two different Egr2;En1CKO mice. Note loss or reduction of wave III in Egr2;En1CKO mice with apparent preservation of waves IV and V. B, Diagram of sound localization setup. C, PPI (A′; see Materials and Methods) as a function of ISI at 90° speaker separation. Control (n = 10) and Egr2;En1CKO (n = 13) mouse responses were equivalent at ISI ≥20 ms but different at 10 ms. D, At 10 ms ISI, control mice could distinguish sound sources separated by ≥22.5°; Egr2;En1CKO mice could only distinguish sound sources separated by 180°. E, No significant differences were seen at 60 ms ISI between control (n = 10) and Egr2;En1CKO (n = 11) mice. Error bars indicate SEM. Large asterisks above lines denote differences between control and Egr2; En1CKO mice; small asterisks above error bars show differences from chance [PPI (A′) = 50%]. *p < 0.05, **p < 0.01, ***p < 0.001.
Eleven control and 19 Egr2;En1CKO mice aged P32–P47 were placed individually in a wire-mesh cage facing the midpoint (50 cm away) in the frontal plane of two matched Tucker-Davis Technologies ES1 electrostatic prepulse speakers and directly below (20 cm) a RadioShack tweeter startle speaker (Fig. 2B). A 70 dB SPL broadband prepulse noise stimulus was digitally generated using an RP2.1 processor amplified with a Tucker-Davis Technologies SA1 amplifier and broadcast from the left prepulse speakers and then switched abruptly to the right speaker [this switch being the prepulse (PP)]. The startle stimulus [115 dB SPL (SS)] was generated by a second RP2.1 and played through the startle speaker. Speaker separation was fixed at 90° on the first day, and trials consisted of the SS presented at an interstimulus interval (ISI) of 5, 10, 20, 40, 60, 100, or 300 ms after change in location of the broadband noise (experimental) or with no change in location (control). Each ISI was repeated six times per session, block randomized, along with two control conditions. The intertrial interval was random and averaged 10 s, with each session lasting 10–12 min per mouse. The second day of testing involved a brief speaker-swap paradigm with just two conditions per block: (1) two control startle with no prepulse; and (2) two prepulse conditions with 10 and 60 ms ISI, respectively. These values were chosen from the full ISI function collected on day 1 to highlight important similarities and differences between control and Egr2;En1CKO mice. Detection of the PP was demonstrated by prepulse inhibition (PPI) of the acoustic startle response (ASR). Force of the ASR was transduced by an accelerometer and amplitude scored as integrated root mean square voltage for 100 ms after delivery of the SS. Experimental stimuli were controlled, and responses were recorded by a personal computer using a custom MATLAB (MathWorks) front end. Statistical analyses were performed with SPSS version 20 (IBM) and included Student's t test (amplitude), extra sum-of-squares F test (latency), and repeated-measures ANOVA (ISI duration and/or angular separation as within-subject variables and genotype as between-subject variable). p values provided by ANOVA were adjusted via the Greenhouse–Geisser method for nonhomogeneity of between-cell correlations. Graphical presentation of data and supplemental t tests on specific conditions within- and between-subjects used Prism version 4.2 (GraphPad Software).
The high throughput protocol used here differs from previous reflex audiometry experiments that collected twice as many replicate trials per session. To avoid potential skewing effects of outliers on means, we used a nonparametric measure of the prepulse effect rather than the simple ratio of mean response magnitudes in prepulse and control conditions, typically reported as %PPI. PPI (A′) is the area under the receiver operating characteristic curve and is a measure of overlap of two distributions; it is insensitive to the precise nature of their underlying distributions. Scores ranged from 50% for completely overlapping distributions of prepulse and control conditions to 100% for completely non-overlapping distributions. For prepulse facilitation, which occurred in control mice only at ISI of 10 ms and speaker angle of 22.5°, PPI (A′) scores below 50% were inverted to make them comparable with PPI under the remaining conditions.
Results
The Egr2Cre allele drives Cre recombinase expression starting at E7.5 in rhombomeres 3 and 5 of the developing brainstem, areas that give rise to neurons that populate the SOC (Marín and Puelles, 1995; Cramer et al., 2000; Voiculescu et al., 2000; Maricich et al., 2009). We used this allele to conditionally delete the homeobox transcription factor En1, which is expressed by developing neurons of the lateral nucleus of the trapezoid body (LNTB), MNTB, and ventral nucleus of the trapezoid body (VNTB) beginning at E12.5 (Marrs et al., 2013) in the brainstem of Egr2Cre/+;En1flox/flox (Egr2;En1CKO) mice (Sgaier et al., 2007). Egr2;En1CKO mice were born in normal Mendelian ratios and lived to adulthood without obvious phenotypic abnormalities. However, Egr2;En1CKO mice completely lacked MNTB and VNTB neurons, whereas LNTB neurons were preserved (Fig. 1A,B,D,F and data not shown). In contrast, the numbers of glutamatergic LSO neurons that receive MNTB projections (1294 ± 164 vs 1278 ± 259, n = 4 LSO/genotype, p = 0.96) were comparable in Egr2;En1CKO and control littermate mice (Fig. 1C,E). Furthermore, MafB-expressing spherical and globular bushy neurons (Farago et al., 2006) that project to the LSO and MNTB were present in the cochlear nucleus (CN) (Fig. 1G–J′). Thus, Egr2;En1CKO mice provide a unique opportunity to study MNTB function within the ILD pathway (Fig. 1L).
We used several measures to test basic auditory function in Egr2;En1CKO mice. Loud (115 dB SPL) sounds elicited startle responses with amplitudes (14,517 ± 2371 AU, n = 9 vs 15,486 ± 1389 AU, n = 15; p = 0.89) and PPI time constants (2.17 ± 0.26 ms, n = 9 vs 1.97 ± 0.32 ms, n = 15; p = 0.65) that were similar in Egr2;En1CKO mice and control littermates, demonstrating that Egr2;En1CKO mice have normal acoustic startle, PPI, and auditory temporal processing. ABR thresholds to pure tone stimuli (4–32 kHz) were only slightly elevated compared with littermate controls (Table 1). However, wave III was greatly reduced or absent in Egr2;En1CKO mice (Fig. 2A), consistent with the involvement of MNTB in generating this ABR waveform.
Table 1.
ABR thresholds
| Frequency (kHz) | Control | Egr2;En1CKO | P value |
|---|---|---|---|
| 4 | 21.4 ± 1.4 | 27.8 ± 2.6 | 0.026 |
| 8 | 21.7 ± 1.6 | 36.1 ± 3.6 | 2.7 × 10⁻⁴ |
| 12 | 19.4 ± 1.2 | 26.1 ± 2.9 | 0.018 |
| 16 | 17.2 ± 1.3 | 24.4 ± 2.7 | 0.011 |
| 32 | 20.6 ± 1.1 | 22.2 ± 3.0 | 0.53 |
All values are averages from adult control littermate (n = 18) and Egr2;En1CKO mice (n = 9) reported in decibels sound pressure level ± SEM.
This testing showed that Egr2;En1CKO mice could hear, but could they localize sounds? To answer this question, we used a PPI paradigm to test the ability of mice to distinguish between sound sources in the left and right hemifields (Fig. 2B; Allen and Ison, 2012). We tested temporal acuity by varying ISI (time from speaker switch to startle stimulus) and spatial acuity by varying speaker angle (distance between sounds). At 90° speaker separation, Egr2;En1CKO mice and control littermates exhibited PPI at ISIs of ≥20 and ≥10 ms, respectively (Fig. 2C). Thus, temporal acuity was affected in Egr2;En1CKO mice, because they required twice as long to detect the left–right spatial location switch. Inability to detect ISI of 10 ms was manifest at all speaker angles except 180°, which essentially represents a monoaural on–off task, whereas control littermates exhibited PPI at speaker separations as low as 22.5° (Fig. 2D). To specifically test spatial acuity, we varied speaker angle at ISI of 60 ms, a test condition in which Egr2;En1CKO mice showed strong PPI. Interestingly, no genotype-specific differences were seen, suggesting that, at long integration times, spatial acuity was not affected in Egr2;En1CKO mice (Fig. 2E).
Given the complete loss of MNTB neurons, we predicted substantial loss of glycinergic innervation of LSO and SPN neurons in Egr2;En1CKO mice. Instead, we found that GlyT2+ bouton number on LSO neuronal somata was reduced by only ∼30% in Egr2;En1CKO versus control mice (8.00 ± 0.19 vs 11.56 ± 0.39, n = 4 LSO per genotype; p = 7.9 × 10⁻⁴), and no change was seen in the SPN (11.27 ± 1.05 vs 13.27 ± 0.97, n = 4 SPN per genotype; p = 0.215; Fig. 3A–D). We also found that bouton size was decreased by 11% (1.28 ± 0.018 μm2, n = 806 boutons vs 1.38 ± 0.017 μm2, n = 909 boutons; p = 4.9 × 10⁻¹⁰) in the LSO and increased by 12% (1.29 ± 0.016 μm2, n = 720 boutons vs 1.15 ± 0.012 μm2, n = 1012 boutons; p = 1.9 × 10⁻¹²) in the SPN of Egr2;En1CKO mice compared with littermate controls. The amount of neuronal somatic surface area covered by GlyT2+ terminals decreased by 25% (34 ± 0.77%, n = 184 vs 45 ± 0.80%, n = 221; p = 1.2 × 10⁻²²) in the LSO but was unchanged (39 ± 1.3%, n = 116 vs 41 ± 1.1%, n = 162; p = 0.18) in the SPN of Egr2;En1CKO mice compared with littermate controls. We used patch-clamp recordings in acute brainstem slices to characterize electrophysiological parameters of these glycinergic inputs. Bipolar stimulation electrodes were placed where the MNTB was (control) or should be (Egr2;En1CKO) located, and postsynaptic responses were recorded in ipsilateral LSO and SPN neurons (Fig. 3I). Stimulation of fibers in the location of the missing MNTB (100 Hz pulse train for 100 ms) produced characteristic trains of IPSPs, followed by offset action potentials in SPN neurons of Egr2;En1CKO mice (Fig. 3J), similar to those in wild types (Kulesza et al., 2007; Kopp-Scheinpflug et al., 2011). Offset response latencies were equivalent in Egr2;En1CKO mice and control littermates (12.95 ± 0.94 ms, n = 3 cells vs 10.26 ± 0.76 ms, n = 12; p = 0.122) and blocked by the glycine receptor antagonist strychnine (1 μm) but not by antagonists of glutamate receptors (CNQX, 10 μm; d-AP-5, 20 μm) or GABAA receptors (bicuculline, 10 μm) (Fig. 3J). Voltage-clamp experiments confirmed that >90% of the large IPSC was strychnine sensitive (Fig. 3K). Successive application of glutamatergic and GABAergic antagonists did not affect these responses (Fig. 3L), demonstrating that these IPSCs were not driven by disynaptic input. The decay time constant of glycinergic IPSCs in SPN neurons was >2.5-fold slower in Egr2;En1CKO mice (Fig. 3M; 6.80 ± 0.92 ms, n = 5 vs 2.5 ± 0.39 ms, n = 9; p ≤ 0.001). Similar pharmacology (Fig. 3L) and slower IPSC decay times were found for LSO neurons in Egr2;En1CKO mice versus controls (Fig. 3M; 3.22 ± 0.43 ms, n = 4 vs 1.10 ± 0.24 ms, n = 3; p = 0.025).
To determine the origin of the glycinergic innervation, we injected dextran–tetramethyl–rhodamine into the SPN in slice preparations (Fig. 3E–H). Labeled neurons were seen in the ipsilateral MNTB of control mice, but no labeled neurons were found on either side of the midline in the SOC of Egr2;En1CKO mice (Fig. 3E,F). Furthermore, dye placement in the SPN labeled fibers that crossed the midline in both Egr2;En1CKO mice and control littermates (Fig. 3G,H).
Discussion
We identified En1 as a gene essential for MNTB neuron development. Given the early timing (E7.5) of En1 deletion in Egr2;En1CKO mice, we speculate that these neurons never form; we are currently conducting experiments to test this hypothesis and to determine other developmental consequences of En1 deletion. Interestingly, VNTB neurons also appear to require En1, while LNTB neurons do not. Potential causes for these differential effects are currently unknown.
Our data indicate that the MNTB specifically facilitates rapid detection of shifts in sound source. These data are reminiscent of work in cats showing that unilateral and bilateral trapezoid body transection with varying degrees of SOC damage led to reduced ability to temporally discriminate between tones presented in rapid succession to each ear (Masterton et al., 1967). These types of discriminations are perhaps the most relevant for rapid detection of predators and prey and therefore are important for survival (Masterton et al., 1967). Surprisingly, overall temporal and spatial sound localization ability was relatively preserved in Egr2;En1CKO mice, suggesting that other auditory system regions contribute heavily to sound localization (Masterton et al., 1968; Thompson and Masterton, 1978).
An unexpected and important finding of our study is that substantial, functional glycinergic innervation of the LSO and SPN persists in the absence of the MNTB. This innervation is found in the same location on neuronal somata in Egr2;En1CKO mice and littermate controls, produces offset trains of action potentials in SPN neurons, and must arise from monosynaptic inputs because IPSCs were generated in the presence of glutamatergic and GABAergic blockers (Fig. 3L). Although we were unable to determine the exact source of this innervation, it is unlikely that it arises within the SOC because dye placement into the SPN labeled crossing fibers but not cells in the contralateral SOC, and the stimulating electrode placement in our electrophysiological studies was medial to any cell bodies in the ipsilateral SOC. Therefore, we conclude that the glycinergic innervation seen in the SPN and LSO of Egr2;En1CKO mice originates outside of the SOC from axons that cross the midline in the trapezoid body. Possible sources include the CN and other brainstem nuclei; additional experiments will be necessary to distinguish between these possibilities. This innervation could be the result of developmental compensation by other regions of the central auditory system given the early timing of En1 deletion in our study. However, the extent of the innervation in Egr2;En1CKO mice and the similar responses seen in these and control animals favor the interpretation that this parallel innervation is more likely present but obscured in normal animals in which glycinergic MNTB innervation dominates. Our physical measurements of GlyT2+ bouton size and percentage of soma surface area covered did not provide an obvious explanation for the slower IPSC decay times found in Egr2;En1CKO mice. These could result from abnormal glycine receptor subunit composition secondary to persistence of an immature state or ectopic expression of glycine receptor subunits (Sanes and Wooten, 1987; Sato et al., 1995; Piechotta et al., 2001). This hypothesis presupposes that innervating axons instruct receptor expression, and additional studies are needed to address this possibility.
Our use of genetic ablation to test the contribution of MNTB to sound localization avoided several pitfalls common to physical ablation techniques. Neuronal loss was symmetric, identical in all tested animals, and avoided physical damage to axon tracts in the same region, each impossible to accomplish using surgical/chemical ablation. Future studies will determine how genetic ablation of MNTB neurons in adult animals after normal development affects both connectivity and function.
Footnotes
This work was supported by National Institutes of Health Grants F32DC011982 (W.J.) and P30DC05409 (P.D.A.), the Medical Research Council (C.K.-S., I.D.F.), Action on Hearing Loss (E.S.), the Child Neurology Society (S.M.M.), and the American Hearing Research Foundation (S.M.M.). We thank Dr. Sharyl Fyffe-Maricich and members of the Maricich laboratory for critical reading of this manuscript, Drs. Kumar Alagramam, Sami Melki, and John Gerka Stuyt at Case Western Reserve University (Cleveland, OH) for use of ABR recording equipment and assistance with auditory testing, and the journal reviewers for their constructive comments.
References
- Allen PD, Ison JR. Kcna1 gene deletion lowers the behavioral sensitivity of mice to small changes in sound location and increases asynchronous brainstem auditory evoked potentials but does not affect hearing thresholds. J Neurosci. 2012;32:2538–2543. doi: 10.1523/JNEUROSCI.1958-11.2012. [DOI] [PMC free article] [PubMed] [Google Scholar]
- Boudreau JC, Tsuchitani C. Binaural interaction in the cat superior olive S segment. J Neurophysiol. 1968;31:442–454. doi: 10.1152/jn.1968.31.3.442. [DOI] [PubMed] [Google Scholar]
- Cant NB. The fine structure of the lateral superior olivary nucleus of the cat. J Comp Neurol. 1984;227:63–77. doi: 10.1002/cne.902270108. [DOI] [PubMed] [Google Scholar]
- Casseday JH, Neff WD. Auditory localization: role of auditory pathways in brain stem of the cat. J Neurophysiol. 1975;38:842–858. doi: 10.1152/jn.1975.38.4.842. [DOI] [PubMed] [Google Scholar]
- Cramer KS, Fraser SE, Rubel EW. Embryonic origins of auditory brain-stem nuclei in the chick hindbrain. Dev Biol. 2000;224:138–151. doi: 10.1006/dbio.2000.9779. [DOI] [PubMed] [Google Scholar]
- Farago AF, Awatramani RB, Dymecki SM. Assembly of the brainstem cochlear nuclear complex is revealed by intersectional and subtractive genetic fate maps. Neuron. 2006;50:205–218. doi: 10.1016/j.neuron.2006.03.014. [DOI] [PubMed] [Google Scholar]
- Jenkins WM, Masterton RB. Sound localization: effects of unilateral lesions in central auditory system. J Neurophysiol. 1982;47:987–1016. doi: 10.1152/jn.1982.47.6.987. [DOI] [PubMed] [Google Scholar]
- Johnston J, Griffin SJ, Baker C, Skrzypiec A, Chernova T, Forsythe ID. Initial segment Kv2.2 channels mediate a slow delayed rectifier and maintain high frequency action potential firing in medial nucleus of the trapezoid body neurons. J Physiol. 2008;586:3493–3509. doi: 10.1113/jphysiol.2008.153734. [DOI] [PMC free article] [PubMed] [Google Scholar]
- Kavanagh GL, Kelly JB. Midline and lateral field sound localization in the ferret (Mustela putorius): contribution of the superior olivary complex. J Neurophysiol. 1992;67:1643–1658. doi: 10.1152/jn.1992.67.6.1643. [DOI] [PubMed] [Google Scholar]
- Kopp-Scheinpflug C, Tozer AJ, Robinson SW, Tempel BL, Hennig MH, Forsythe ID. The sound of silence: ionic mechanisms encoding sound termination. Neuron. 2011;71:911–925. doi: 10.1016/j.neuron.2011.06.028. [DOI] [PubMed] [Google Scholar]
- Kulesza RJ, Jr, Kadner A, Berrebi AS. Distinct roles for glycine and GABA in shaping the response properties of neurons in the superior paraolivary nucleus of the rat. J Neurophysiol. 2007;97:1610–1620. doi: 10.1152/jn.00613.2006. [DOI] [PubMed] [Google Scholar]
- Maricich SM, Xia A, Mathes EL, Wang VY, Oghalai JS, Fritzsch B, Zoghbi HY. Atoh1-lineal neurons are required for hearing and for the survival of neurons in the spiral ganglion and brainstem accessory auditory nuclei. J Neurosci. 2009;29:11123–11133. doi: 10.1523/JNEUROSCI.2232-09.2009. [DOI] [PMC free article] [PubMed] [Google Scholar]
- Marín F, Puelles L. Morphological fate of rhombomeres in quail/chick chimeras: a segmental analysis of hindbrain nuclei. Eur J Neurosci. 1995;7:1714–1738. doi: 10.1111/j.1460-9568.1995.tb00693.x. [DOI] [PubMed] [Google Scholar]
- Marrs GS, Morgan WJ, Howell DM, Spirou GA, Mathers PH. Embryonic origins of the mouse superior olivary complex. Dev Neurobiol. 2013;73:384–398. doi: 10.1002/dneu.22069. [DOI] [PMC free article] [PubMed] [Google Scholar]
- Masterton B, Jane JA, Diamond IT. Role of brainstem auditory structures in sound localization. I. Trapezoid body, superior olive, and lateral lemniscus. J Neurophysiol. 1967;30:341–359. doi: 10.1152/jn.1967.30.2.341. [DOI] [PubMed] [Google Scholar]
- Masterton RB, Jane JA, Diamond IT. Role of brain-stem auditory structures in sound localization. II. Inferior colliculus and its brachium. J Neurophysiol. 1968;31:96–108. doi: 10.1152/jn.1968.31.1.96. [DOI] [PubMed] [Google Scholar]
- Piechotta K, Weth F, Harvey RJ, Friauf E. Localization of rat glycine receptor alpha1 and alpha2 subunit transcripts in the developing auditory brainstem. J Comp Neurol. 2001;438:336–352. doi: 10.1002/cne.1319. [DOI] [PubMed] [Google Scholar]
- Sanes DH, Wooten GF. Development of glycine receptor distribution in the lateral superior olive of the gerbil. J Neurosci. 1987;7:3803–3811. doi: 10.1523/JNEUROSCI.07-11-03803.1987. [DOI] [PMC free article] [PubMed] [Google Scholar]
- Sato K, Kuriyama H, Altschuler RA. Expression of glycine receptor subunits in the cochlear nucleus and superior olivary complex using non-radioactive in-situ hybridization. Hear Res. 1995;91:7–18. doi: 10.1016/0378-5955(95)00156-5. [DOI] [PubMed] [Google Scholar]
- Sgaier SK, Lao Z, Villanueva MP, Berenshteyn F, Stephen D, Turnbull RK, Joyner AL. Genetic subdivision of the tectum and cerebellum into functionally related regions based on differential sensitivity to engrailed proteins. Development. 2007;134:2325–2335. doi: 10.1242/dev.000620. [DOI] [PMC free article] [PubMed] [Google Scholar]
- Thompson GC, Masterton RB. Brain stem auditory pathways involved in reflexive head orientation to sound. J Neurophysiol. 1978;41:1183–1202. doi: 10.1152/jn.1978.41.5.1183. [DOI] [PubMed] [Google Scholar]
- van Adel BA, Kelly JB. Kainic acid lesions of the superior olivary complex: effects on sound localization by the albino rat. Behav Neurosci. 1998;112:432–446. doi: 10.1037/0735-7044.112.2.432. [DOI] [PubMed] [Google Scholar]
- Voiculescu O, Charnay P, Schneider-Maunoury S. Expression pattern of a Krox-20/Cre knock-in allele in the developing hindbrain, bones, and peripheral nervous system. Genesis. 2000;26:123–126. doi: 10.1002/(SICI)1526-968X(200002)26:2<123::AID-GENE7>3.0.CO%3B2-O. [DOI] [PubMed] [Google Scholar]