

Abstract
A diverse array of interneuron types regulates activity in the mammalian neocortex. Two of the most abundant are the fast-spiking, parvalbumin-positive (PV+) interneurons, which target the axosomatic region of pyramidal cells, and the somatostatin-positive (SOM+) interneurons, which target the dendrites. Recent work has focused on the influence of PV+ and SOM+ interneurons on pyramidal cells. However, the connections among PV+ and SOM+ interneurons are poorly understood and could play an important role in cortical circuitry, since their interactions may alter the net influence on pyramidal cell output. We used an optogenetic approach to investigate the effect of SOM+ interneurons on pyramidal cells and PV+ interneurons during visual stimulation in mouse primary visual cortex. We find that SOM+ interneuron activation suppresses PV+ cell spiking at least twice as potently as pyramidal cell spiking during visual stimulation. This differential effect of SOM+ cell stimulation is detectable even when only two to three SOM+ cells are activated. Importantly, the remaining responses to oriented gratings in PV+ cells are more orientation tuned and temporally modulated, suggesting that SOM+ activity unmasks this tuning by suppressing untuned input. Our results highlight the importance of SOM+ inhibition of PV+ interneurons during sensory processing. This prominent competitive inhibition between interneuron types leads to a reconfiguration of inhibition along the somatodendritic axis of pyramidal cells, and enhances the orientation selectivity of PV+ cells.
Introduction
Neocortical neurons are predominantly excitatory pyramidal (Pyr) cells, but ∼20% of neurons are inhibitory (DeFelipe, 2002) and highly diverse in morphology, electrophysiology, and molecular composition (Markram et al., 2004; DeFelipe et al., 2013). Parvalbumin-expressing (PV+) interneurons, account for 35–40% of interneurons in mouse visual cortex (Gonchar et al., 2007). Somatostatin-expressing (SOM+) interneurons are a mutually exclusive group (Kawaguchi and Kubota, 1997; Lee et al., 2010), comprising 20–25% of the interneurons (Gonchar et al., 2007). PV+ cells often have a basket cell morphology (Ramon y Cajal, 1909; Marin-Padilla, 1969), fast-spiking electrophysiological phenotype (McCormick et al., 1985; Connors and Gutnick, 1990), and target their inhibition preferentially to the perisomatic region of Pyr cells (Freund and Katona, 2007). SOM+ cells often show a Martinotti cell morphology (Wang et al., 2004), nonfast-spiking electrophysiology (Kawaguchi, 1993), and target their inhibition preferentially to Pyr cell dendrites (Wang et al., 2004; Silberberg and Markram, 2007), where they can suppress dendritic spiking (Gidon and Segev, 2012; Smith et al., 2013). These differences suggest divergent computational roles (Markram et al., 2004; Silberberg, 2008), which recent studies have begun to elucidate in cortex (Murayama et al., 2009; Ma et al., 2010; Adesnik et al., 2012; Gentet et al., 2012; Lee et al., 2012; Wilson et al., 2012) and in the hippocampus in vitro (Lovett-Barron et al., 2012) and in vivo (Royer et al., 2012).
Mouse visual cortex is a powerful model for studying cortical sensory processing, featuring advanced genetic tools for labeling and manipulating specific cell types (Hübener, 2003; Callaway, 2005; Luo et al., 2008; Huberman and Niell, 2011). In vivo recordings can be targeted to specific cell types (Sohya et al., 2007; Niell and Stryker, 2008; Liu et al., 2009; Kerlin et al., 2010; Ma et al., 2010; Runyan et al., 2010; Hofer et al., 2011; Atallah et al., 2012), and with optogenetic manipulations, the functional roles of these cells can been investigated (Adesnik et al., 2012; Atallah et al., 2012; Lee et al., 2012; Wilson et al., 2012). Typically, changes in Pyr cell output are used to measure the effects of optogenetic stimulation. However, less is known about how inhibitory interneurons affect each other during visual processing. These interactions could alter the interpretation of effects on Pyr cell firing, and cortical circuitry more generally. Slice experiments have revealed that SOM+ and PV+ interneurons make inhibitory connections with each other in neocortex (Gibson et al., 1999; Pfeffer et al., 2013), here we explore how this connectivity operates in vivo during sensory processing.
We used channelrhodopsin-2 (ChR2; Nagel et al., 2003; Boyden et al., 2005) to activate SOM+ cells in mouse primary visual cortex during visual stimulation while recording from identified Pyr cells and PV+ cells within the same circuits. In addition to comparing the effect of SOM+ cell stimulation on two different cell types, we varied the population size of SOM+ cell activation from 2 to 3 cells to >100 cells in separate experiments. This approach permitted us to measure the sensitivity of the circuitry to SOM+ manipulations, and investigate in detail the effect on visual responses in Pyr and PV+ cells.
Materials and Methods
Animals.
All experiments were performed in accordance with UK Home Office regulations. Electrophysiological recordings were performed on adult male and female (P30–P65) mice. Mouse genotypes used were as follows: C57-Bl6 wild-type, Pv-GFP (Meyer et al., 2002), SOM-GFP (Oliva et al., 2000), SOM-ires-Cre (Taniguchi et al., 2011). All transgenic lines were backcrossed with C57-Bl6 so all mice had a similar genetic background. For some experiments animals positive for Cre and GFP from a cross between PV-GFP and SOM-Cre were used.
Viral injection.
Animals were anesthetized with ketamine (100 mg/kg)/xylazine (15 mg/kg). A 1.5 mm craniotomy was opened over monocular visual cortex and 0.5 μl of Cre-inducible ChR2 adeno-associated virus (AAV; sequence: http://www.everyvector.com/sequences/show_public/2491, produced by the UNC viral vector core), titer 2 × 10¹² viral genomes/ml, was injected at a tip depth of 200–400 μm. The injection capillary tube (Blaubrand; intraMARK) was held in a stereotaxic frame (Narishige) and manual pressure was applied using a 1 ml syringe connected via plastic tubing. Post-injection the scalp was sutured and animals were allowed to recover. A recovery mixture of 100 μl carprofen (5%) and 600 μl Baytril (2.5%) was added to 150 ml of drinking water. Experiments began between 2 and 4 weeks after virus injection.
Imaging.
A custom in vivo two-photon microscope (Prairie) was used in combination with a 16×, 0.8 numerical aperture water-immersion objective (Nikon) and a Ti:Sapphire laser (Mai Tai; Spectra-Physics). Images were acquired using ScanImage in conjunction with MATLAB.
Single-cell electroporation.
Targeted electroporation of neurons was performed as previously described (Kitamura et al., 2008; Judkewitz et al., 2009). The animals were anesthetized with ketamine (100 mg/kg)/xylazine (15 mg/kg). An area of scalp was removed and a head plate fixed to the skull over monocular visual cortex. Using a dental drill (NSF) a 1 × 0.5 mm craniotomy was made inside the headplate. The skull was soaked for 5–10 min in artificial CSF (ACSF; 150 mm NaCl, 2.5 mm KCl, 2.5 mm HEPES, 2 mm CaCl2, 1 mm MgCl2) before removal of the small bone cap, exposing the dura. The animal was placed under the microscope and a glass pipette (12–15 MΩ) was filled with ACSF, 50 μm Alexa 594 dye (Invitrogen), and the plasmids (100 ng/μl) to be transfected into the interneurons. Despite the fact that two separate plasmids were used, we never found a case of an interneuron that expressed red fluorescent protein (RFP) but did not respond to blue light stimulation, suggesting that both plasmids always entered the cell upon electroporation. Pressure was put on the pipette (100 mbar) and it was advanced through the dura into the brain, at which point the pressure was then reduced (to 40 mbar). GFP+ cells were approached, the pressure released, and a train of voltage pulses (1 s train of 1 ms, −10 V pulses at 100 Hz) delivered with an Axoporator 800A (Axon Instruments). Once a number of interneurons had been electroporated, the craniotomy was resealed using Kwik-Sil (World Precision Instruments) and the mouse was allowed to recover for 48 h before recording. A recovery mixture of 100 μl carprofen (5%) and 600 μl Baytril (2.5%) was added to 150 ml of drinking water. When recordings were made from electroporated animals the recorded cells were always within 100 μm of an electroporated cell. Recorded cells were classed as either putative Pyr cells or putative PV+ interneurons based on their average firing rates and orientation selectivity index (OSI). We set an orientation selectivity threshold of 0.5 and an average firing frequency threshold of 5 Hz to separate the cells. In addition, spike shape was taken into account with cells selected as putative PV+ interneurons having a distinct upward deflection in their spikes recorded in cell-attached voltage-clamp recordings that was not present in cells selected to be putative pyramidal and a shorter peak-to-peak interval (Liu et al., 2009).
Electrophysiology.
Mice were anesthetized first with chlorprothixene (2 mg/kg), then after 20 min with urethane (1 g/kg). Surgery began when the animal became unresponsive to foot pinch, usually after an additional 20 min. The animals were topped up as necessary with urethane. Lacri-Lube (Allergan) was used to keep the eyes moist. A 1 × 0.5 mm craniotomy was opened over monocular visual cortex and the dura mater was removed. The craniotomy was then covered with 1.5% agar and ACSF (150 mm NaCl, 2.5 mm KCl, 2.5 mm HEPES, 2 mm CaCl2, 1 mm MgCl2). Cell-attached recordings were made using 6 MΩ pipettes filled with ACSF and 50 μm Alexa 594 (Invitrogen). Intracellular recordings were made using K+ gluconate internal (135 mm K-gluconate, 4 mm KCL, 10 mm HEPES, 10 mm disodium-phosphocreatine, 4 mm Mg-ATP, 0.3 Na2GTP) and 50 μm Alexa 594. Signals were acquired at 50 kHz in voltage-clamp and filtered at 4 kHz. Shadow patching (Kitamura et al., 2008) was used to approach and record from pyramidal cells. In many cases the pyramidal cell body and apical dendrite could be clearly identified. Spike rate and orientation tuning selectivity were used to confirm pyramidal neuron identity.
Immunohistochemistry.
Animals were taken post experiment already under urethane anesthesia and were further anesthetized with ketamine (100 mg/kg)/xylazine (15 mg/kg). They were then intracardially perfused first with 1× PBS, then with 4% paraformaldehyde. After fixing overnight, 100 μm sections were cut and washed three times for 10 min in 1× PBS. The following protocol was adapted from Xu et al. (2010). After the washes, the slices were incubated for 2 h at room temperature in 0.4% Triton X-100 then washed once in 1× PBS for 10 min. Primary antibody solutions were prepared in 1× PBS using rabbit anti-somatostatin (Bachem T-4103.0050; 1:800), goat anti-parvalbumin (Swant, PVG 214; 1:1000), and monoclonal mouse anti-eYFP/GFP (Abcam, ab1218; 1:500). Primary antibody solutions were added to the slices and incubated overnight in at 4°C then washed three times for 10 min in 1× PBS. Secondary antibody solutions were prepared using goat anti-rabbit (Invitrogen, A31556; 1:400), donkey anti-goat (Invitrogen, A21447; 1:400), and chicken anti-mouse (Invitrogen, A21200; 1:400) antibodies and were added to the slices for 3 h. A final three 10 min washes in 1× PBS were performed before the slices were mounted onto slides. Images were collected using a PerkinElmer UltraVIEW confocal system and Volocity software.
Channelrhodopsin stimulation.
Channelrhodopsin was stimulated with 1 ms light flashes at 40 Hz using a blue LED (Phillips; Luxeon) with a peak power of 220 mW at 455 nm. The light was focused through the objective with a power of 4.1 mW/mm2 at the craniotomy. For the stronger stimulation used in some experiments brighter blue light was used (8.0 mW/mm2) and cells were recorded close to the center of the virally injected area (<100 μm), as opposed to in most experiments in which cells were located >100 μm from the center of viral injection.
Visual stimulus.
Square wave gratings had a spatial frequency of 0.04 cycles/degree, drifting at 2 cycles/s in 16 directions (from 0 to 337.5°) presented in a random order for 2 s each with no blanks, with control and ChR2 stimulation conditions interleaved. Visual stimulus routines were written and presented using MATLAB and the Psychophysics Toolbox (Brainard, 1997). Images were presented on a Dell 2007WFP TFT LCD screen, 60 Hz refresh rate, 1280 × 800 resolution, extending in visual space from +30 to +110 in azimuth and from −10 to +40 in elevation. Brightness values ranged from 73.3 cd m−2 for the white bar, to 0.2 cd m−2 for the black bar, with the gray screen at 30.2 cd m−2.
Data analysis.
Paired data were tested for normality using the Kolmogorov–Smirnov test. For normally distributed data, the paired t test was used. For data that were not normally distributed, the paired Wilcoxon signed rank test was used. For effect size comparisons, data were first tested for normality using the Kolmogorov–Smirnov test. For normally distributed data, the unpaired t test was used. For data that were not normally distributed a Mann–Whitney U was used. All data are presented as mean ± SEM.
To obtain tuning curves, visual responses were fit with two summed Gaussians separated by 180°. The fitting routine used a least-squares method to minimize the Cartesian distance between the model and the data (Carandini and Ferster, 2000). Cells were used that met these criteria: >2 Hz firing at the peak response in the raw data, visually responsive above spontaneous firing rate, at least five repeats of each orientation, and the sum of squared residuals normalized by maximum value of the proposed Gaussian fit must be below a 0.125 threshold. The last criterion was used for pyramidal cells only, as interneurons are not necessarily expected to be fit well by two summed Gaussians separated by 180 ° (Liu et al., 2009).
Peak firing rates were extrapolated from the raw data using these Gaussian fits. OSI was calculated by comparing the maximum amplitude of the preferred orientation (Rp) with the minimum value of the Gaussian fit (Ro):
 |
Circular variance (CV) is another measure of orientation tuning. It takes into account the average response at each orientation. Zero CV would be a perfect circle, while a CV score of 1 would mean a highly tuned cell responding to only one orientation. CV is calculated using the following equation (r = visual responses, o = grating orientations):
 |
Half-width at half-height (HWHH) is a measure of tuning width in degrees calculated from the Gaussian σ obtained from the fitting process. σ is converted to HWHH using the following equation:
The direction selectivity index (DSI) was used to measure to what extent a cell had a preference for the direction of movement of an oriented grating. If both directions (e.g., for a horizontal grating moving upward (90°) or downward (270°) are preferred equally then the DSI equals zero, whereas if only one direction produces a response then the DSI equals one. Some PV+ cells were excluded from this analysis as they were not well fit by two summed Gaussians and so were not able to provide the preferred and nonpreferred direction measurements. The equation is as follows (Rp = responses to the preferred direction, Rn = responses to the nonpreferred direction):
 |
Visually responsive cells in this study were those that increased their firing in response to drifting gratings. Some cells respond to the drifting grating with phasic activity at the frequency of grating drift (2 Hz) known as simple cells (Hubel and Wiesel, 1962). Others called complex cells (Hubel and Wiesel, 1962) respond more uniformly, lacking the 2 Hz modulation. To quantify the proportion of 2 Hz modulated activity versus non-modulated activity for the preferred direction of a given cell we used the F1/F0 measure. F1 is the amplitude of the 2 Hz modulation and F0 is the mean firing rate. F1 was calculated by carrying out a Fourier transform on the 2 s grating response histogram binned at 100 ms and taking the amplitude at 2 Hz from the discrete Fourier transform. Cells used for the F1/F0 analysis had to meet three criteria. First, they must have a measurement of the spontaneous rate taken as this needs be subtracted before the calculation. Second, the cells must fire above a minimum threshold in the ChR2 condition (mean firing rate must be >1 spike/s) as very few spikes give spurious results. Third, the tuning curves must be sufficiently well fit by the standard Gaussian model as measured by their residuals from the Gaussian fit. The untuned component is equal to Ro (see the OSI), the minimum value of the Gaussian fit. The tuned component is the difference between Rp (see above) and Ro (see above) to show how large the modulated part of the Gaussian fit is that lies above the untuned component.
Least-mean squares fitting to compare subtractive with divisive inhibition was performed using an algorithm written in MATLAB. The Gaussian fits for visual responses in the control and ChR2 conditions were compared while the control Gaussian was altered either by pure subtraction or pure division until it converged on the least-mean squares fit (i.e., the least average mean squared error between the control Gaussian and the ChR2 Gaussian). Each cell was fit individually and then population mean ± SEM was calculated for each form of inhibition.
Results
Targeted recordings and targeted single-cell electroporation
To measure cell type-specific visual processing, we used two-photon microscopy to guide cell-attached recordings (Komai et al., 2006) from neurons in layer 2/3 of visual cortex in lightly anesthetized mice, and measured neural activity evoked by oriented, drifting square wave grating visual stimuli (0.04 cycles/degree, 2 Hz; Fig. 1A,B). Excitatory pyramidal neurons exhibited classical, highly selective orientation tuned responses (Hubel and Wiesel, 1962; Niell and Stryker, 2008), while SOM+ and PV+ interneurons were less orientation selective (Fig. 1C,D; Sohya et al., 2007; Liu et al., 2009; Kerlin et al., 2010; Ma et al., 2010; Runyan et al., 2010; Hofer et al., 2011; Zariwala et al., 2011; Atallah et al., 2012).
Figure 1.

Targeted recordings and single-cell electroporation in mouse visual cortex. A, Anesthetized mice were presented with visual stimuli consisting of drifting oriented gratings during cell-attached patch-clamp recordings from layer 2/3 neurons in visual cortex targeted using two-photon microscopy. B, Image from a targeted cell-attached recording from a GFP-expressing PV+ cell with a pipette containing Alexa 594. C, Representative examples of orientation tuning curves of three different cell types (mean firing rates). D, Summary of orientation selectivity for different cell types. Pyr n = 56, mean OSI = 0.89 ± 0.03; SOM+ n = 13, mean OSI = 0.52 ± 0.07; PV+ n = 16, mean OSI = 0.36 ± 0.03; cell types significantly different, Kruskal–Wallis test, p < 0.0001. E, Targeted single-cell electroporation of a SOM+ cell visualized by two-photon microscopy. A GFP-expressing SOM+ cell is visualized and approached by a micropipette containing a mixture of red dye (Alexa 594) and plasmid DNA for ChR2 and RFP. A brief train of voltage pulses electroporates the plasmid-dye mixture into the cell, as shown by the red color visible in the soma. Two days later, expression is verified by visualization of RFP. F, Schematics of the Turbo RFP and ChR2 plasmids electroporated into SOM+ cells. G, Cell-attached recording from a SOM+ cell after electroporation with ChR2 confirms reliable activation of light-evoked spikes. H, Summary of recordings from ChR2-expressing SOM+ cells showing probability of eliciting spikes after blue light flashes at different frequencies (n = 4). I, Summary plots showing the number of spikes following each blue light flash at different frequencies, 40 Hz has the highest proportion of single spikes following ChR2 stimulation (n = 4).
To test the effect of activating a small number of SOM+ cells, individual SOM+ cells were transfected with ChR2 using two-photon microscopy-guided single-cell electroporation (Kitamura et al., 2008; Fig. 1E). The electroporation delivered two plasmids into the cells: an RFP, Turbo RFP (Shcherbo et al., 2007) to allow identification of transfected cells, and ChR2 to allow spiking driven by blue light stimulation (Fig. 1F). Cell-attached recordings from transfected SOM+ interneurons confirmed that spikes could be elicited using 1 ms flashes of blue light (Fig. 1G–I). At high frequencies, a proportion of blue light stimuli did not result in SOM+ cell spikes, and at low frequencies individual blue light stimuli resulted in variable numbers of evoked spikes, but using 40 Hz stimuli, spikes could be reliably driven at a matching rate of 40 spikes/s (Fig. 1H,I).
Small numbers of SOM+ interneurons produce cell type-specific suppression
Following electroporation, cell-attached recordings were made from unlabeled cells in the local area, within 150 μm of transfected SOM+ cells (Fig. 2A). The recorded cells were separated into two groups based on their spike shape and visual response properties. Recorded spikes were compared in terms of their relative amount of upward versus downward deflection (P0/P1 ratio) and their spike width (P-P interval), features that distinguish fast-spiking PV+ interneurons from the broader neuronal population (Liu et al., 2009; Fig. 2B). This analysis separated recorded cells into two groups (Fig. 2C). The cells with thinner spikes and larger relative upward deflections were classified as putative PV+ cells, while the others were classified as putative Pyr cells. This grouping was confirmed when cross-checked using the parameters of average firing rate and orientation selectivity (Fig. 2D). As expected the putative PV+ cells, as identified by spike shape, had higher average firing rates and were less orientation selective than putative Pyr cells (Liu et al., 2009; Kerlin et al., 2010; Ma et al., 2010; Runyan et al., 2010; Hofer et al., 2011; Zariwala et al., 2011; Atallah et al., 2012; Fig. 2D).
Figure 2.

Differential effects of activation of small numbers of SOM+ cells on visual responses of putative PV+ cells and putative Pyr cells. A, An image showing a cell-attached recording from an unlabeled putative Pyr cell represented by a dashed circle with electroporated SOM+ cells in the local area. B, Example spikes from putative PV+ and Pyr cells showing the locations of measurement of P0, P1, and the P-P interval. C, A plot of the P0/P1 ratio against P-P interval showing the separation between putative PV+ and putative Pyr cells. D, A plot of OSI against average firing rate showing the separation between putative PV+ and putative Pyr cells. E, Putative PV+ cells average firing rate in response to visual stimuli with and without SOM+ cell activation. The black line is the unity line. F, Putative Pyr cells average firing rate in response to visual stimuli with and without SOM+ cell activation. G, The decrease in firing rate for putative PV+ cells between control and ChR2 stimulation conditions during visual stimulation (n = 6, p = 0.031) shows that even activation of only two to three SOM+ cells can significantly affect the activity of putative PV+ cells. In contrast, putative Pyr cells did not change their firing rate (n = 9, p = 0.129) when two to three SOM+ cells were activated during visual stimulation.
Optogenetic SOM+ interneuron activation (40 Hz, 1 ms per flash) consistently lowered the visually evoked firing rates of putative PV+ interneurons (Fig. 2E). This suppression was not observed for putative Pyr cells (Fig. 2F,G). Thus, putative PV+ interneurons are highly sensitive to input from even just two to three SOM+ interneurons. Having established this high sensitivity, we turned to population manipulations of SOM+ interneuron activity to explore the effects on visually evoked responses in more detail.
Population manipulation of SOM+ cells and the differential effects on PV+ and Pyr cells
AAV particles encoding an inducible ChR2 transgene were injected into the visual cortex of SOM-Cre mice (Taniguchi et al., 2011) to drive ChR2 expression selectively in SOM+ interneurons. These SOM-Cre mice were crossed into a PV-GFP background (Meyer et al., 2002) to label PV+ interneurons for targeted recordings. In ChR2-expressing SOM+ cells, the label (a ChR2-eYFP fusion protein) was confined to the cell membrane, while GFP-expressing PV+ cells were labeled throughout the cytosol. To ensure the specificity of our differential cellular labeling of SOM+ and PV+ cells, immunohistochemical staining was performed and demonstrated nonoverlapping labeling of these cell types (Kawaguchi and Kubota, 1997; Lee et al., 2010). Cells with membrane bound eYFP labeling were all found to be positive for somatostatin (n = 12; Fig. 3A), while all were negative for parvalbumin (n = 12; Fig. 3B). Conversely, cells with GFP labeling in the cytosol were confirmed to all be negative for somatostatin (n = 10; Fig. 3A), while all cells were PV+ (n = 11; Fig. 3B). SOM+ membrane-labeled cells were limited to the injected area, while PV+ cytosol-labeled cells were found throughout the cortex (Fig. 3C,D). The number of virally transfected SOM+ cells ranged between 500 and 836 (n = 3 animals). These cells were contained within a ± 500 μm rostrocaudal span with the highest density of transfection nearest to the injection center (Fig. 3D).
Figure 3.
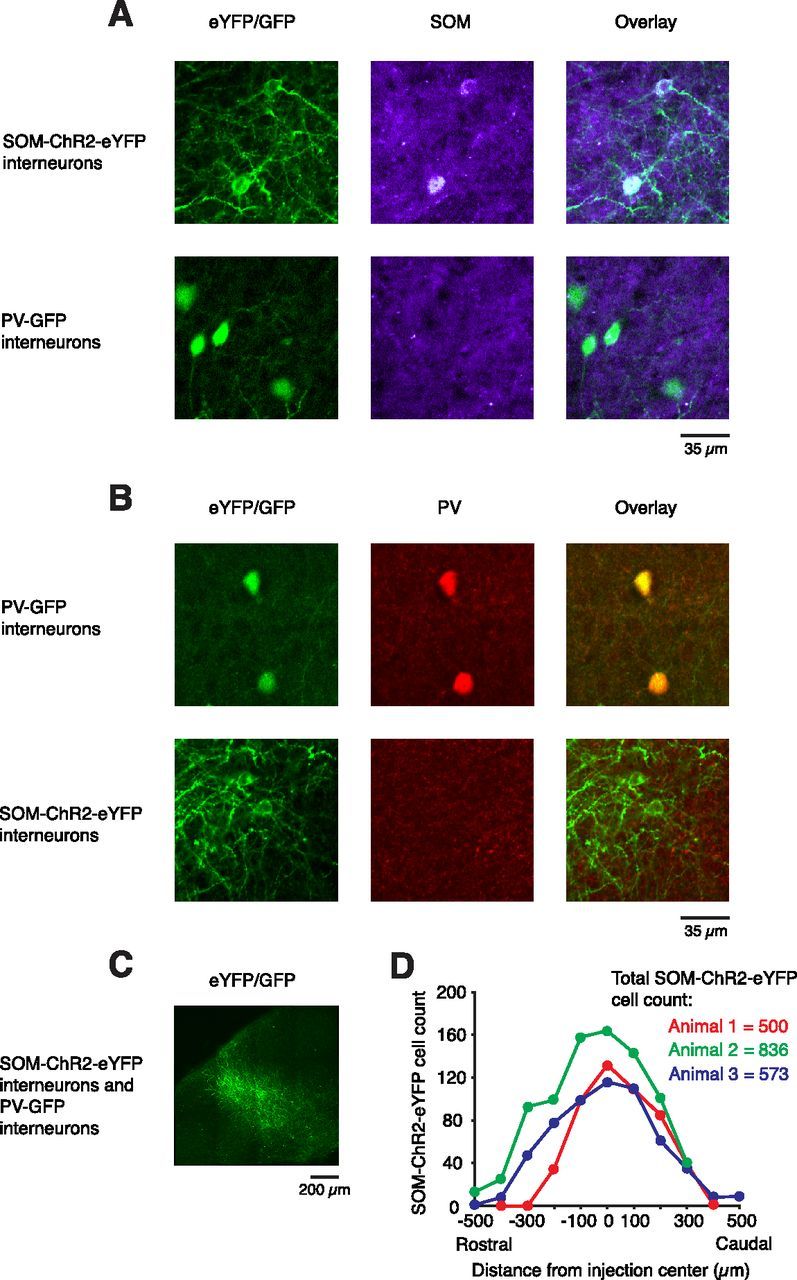
Immunochemistry shows that SOM-ChR2-eYFP and PV-GFP expression are specific and exclusive. A, Double-immunolabeling for eYFP/GFP and SOM. Cells expressing cell membrane-confined ChR2-eYFP were all positive for SOM (n = 12) while no SOM labeling was detected in cells with cytosolic GFP labeling (n = 10). B, Double-immunolabeling for eYFP/GFP and PV. Cells with cytosolic GFP labeling were all positive for PV (n = 12), while no PV labeling was detected in cells expressing cell membrane-confined ChR2-eYFP (n = 11). C, Low-magnification image of eYFP/GFP labeling showing the extent of the cortical area transduced by viruses carrying SOM-ChR2-eYFP. D, Quantification of the rostrocaudal spread of viral transfection of SOM+ cell somata for three transfected animals.
The two cell populations were easily distinguished based on the subcellular distribution of fluorescent labeling (Fig. 4A). Initial control experiments confirmed that blue light alone did not affect peak or average visual response rates in nontransfected (no ChR2) mice (Fig. 4B,C). Therefore, the blue light stimulus used for ChR2 activation did not itself cause spiking via direct visual stimulation or any other nonspecific mechanisms. Cell-attached recordings of virally transfected SOM+ cells confirmed that blue light stimulation (40 Hz, 1 ms/pulse) reliably triggered action potentials (Fig. 4D), producing a mean firing rate across the population of 28.6 spikes/s (Fig. 4E), which matches the spike rate for these interneurons in awake, moving animals during visual processing (Adesnik et al., 2012).
Figure 4.
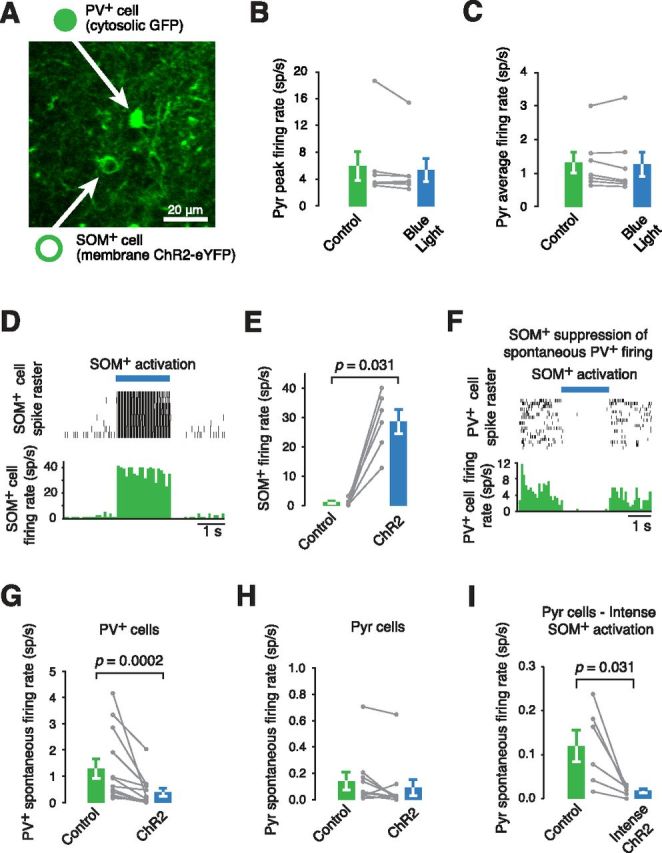
Combining population SOM+ cell stimulation with targeted recordings from PV+ and Pyr cells. A, An image showing that GFP-expressing PV+ cells were easily distinguishable from ChR2-eYFP-expressing SOM+ cells by the pattern of labeling, the former being cytosolic and the latter restricted to the membrane. B, Peak firing rate of Pyr cells is not affected by blue light in an animal with SOM+ cells electroporated with an RFP plasmid (n = 7, p = 0.219). C, Average firing of Pyr rates are also not affected by blue light stimulation alone, in the absence of ChR2 expression (n = 7, p = 0.375). Thus, direct stimulation of the visual pathway with blue light is not a significant factor in these experiments. D, Activation of ChR2 in a ChR2-expressing SOM+ cell drives it to fire spikes. E, SOM+ cells virally transfected with ChR2 increase their firing in response to activation by blue light (40 Hz trains of 1 ms flashes; n = 6, p = 0.031). F, Activation of ChR2-expressing SOM+ cells decreases the firing rate of a PV+ cell. G, H, The effect of SOM+ cell stimulation on PV+ cell (n = 13, p = 0.0002) and Pyr cell (n = 10, p = 0.078) spontaneous activity. There is a significant difference between PV+ and Pyr cell effect sizes (n = 13,10, p < 0.0001). I, More intense SOM+ cell activation can significantly reduce Pyr cell spontaneous firing rates (n = 6, p = 0.031).
SOM+ stimulation had differential effects on PV+ and Pyr cells. While PV+ cell spontaneous firing was strongly inhibited (70.4 ± 12.2% decrease from control levels, p = 0.0002, n = 13; Fig. 4F,G), Pyr cell firing was only modestly affected (35.6 ± 44.7% decrease from control levels, p = 0.078, n = 10; Fig. 4H). There was a significant difference in effect sizes between the two cell types (p = 0.0002, n = 13,10). This effect is larger than that produced by the smaller scale SOM+ cell stimulation following transfection by electroporation. Stimulation of two to three SOM+ cells produces a PV+ cell mean firing reduction of 0.73 Hz while virally transfected SOM+ cell stimulation (500–836 SOM+ cells) produces a mean reduction of 2.27 Hz (Figs. 2G, 6A). For the Pyr cells, the mean firing rate reduction increases from 0 Hz in the electroporation experiment to 0.36 Hz in the viral case (Figs. 2G, 6B). More intense SOM+ cell stimulation at the same frequency in the virally transfected animal was able to suppress Pyr cell firing (85.4 ± 3.8% decrease from control levels p = 0.031, n = 6; Fig. 4I) as reported recently (Lee et al., 2012; Wilson et al., 2012).
Figure 6.
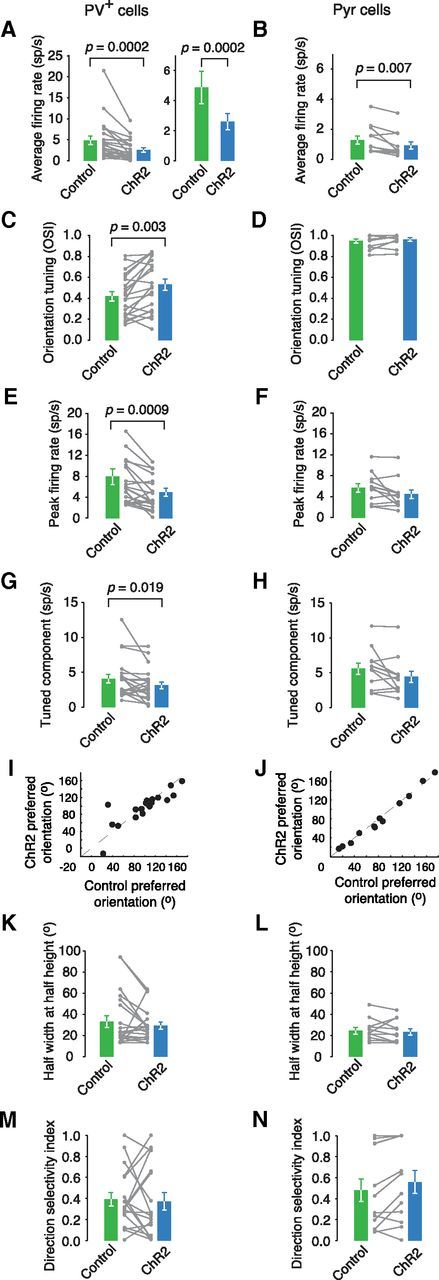
The effect of population SOM+ cell activation on other tuning curve parameters. A, B, Average firing rate is significantly reduced in PV+ cells (n = 21, p = 0.0002) and Pyr cells (n = 12, p = 0.007) upon SOM+ cell stimulation. The effect sizes differ significantly between cell types (n = 21,12, p = 0.007). C, D, The effect of SOM+ cell stimulation on the OSI in PV+ (n = 21, p = 0.003) and Pyr cells (n = 12, p = 0.232). The effect sizes differ significantly between cell types (n = 21,12, p = 0.005). E, F, The effect of SOM+ cell stimulation on peak firing in PV+ (n = 21, p = 0.0009) and Pyr cells (n = 12, p = 0.052). The effect sizes do not differ significantly between cell types (n = 21,12, p = 0.122). G, H, The tuned component is significantly reduced in PV+ cells (n = 21, p = 0.019) and approaches significance in Pyr cells (n = 12, p = 0.052). The effect sizes do not differ significantly between cell types (n = 21,12, p = 0.122). I, J, Preferred orientation does not change much for PV+ cells (n = 21, mean Δorientation = 9.56°) or Pyr cells (n = 12, mean Δorientation = 3.59°). K, L, The HWHH did not change in PV+ cells (n = 21, p = 0.375) or Pyr cells (n = 12, p = 0.380). M, N, Direction selectivity is unchanged for PV+ cells (n = 18, p = 0.679) with ChR2 stimulation and shows a nonsignificant increase in Pyr cells (n = 12, p = 0.052).
SOM+ activity reduced the untuned component of responses in PV+ cells to oriented, drifting square wave gratings (Fig. 5A,C,E,G), but had little to no effect on Pyr cells (Fig. 5B,D,F,H) as demonstrated by a significant difference in effect size between the cell types (p < 0.0001, n = 21,12). This resulted in an overall increase in orientation tuning for PV+, but not Pyr cells (Fig. 5I,J), as measured by CV and confirmed by a significant difference in CV effect size between the two cell types (p = 0.0061, n = 21,12). In addition to decreasing evoked responses from PV+ cells, SOM+ cell activity also increased stimulus-driven modulation of firing at the temporal frequency of the drifting grating visual stimulus (Fig. 5K). The grating stimulus drifted at a rate of 2 Hz and for many Pyr cells, this resulted in a modulation of firing rate at the same frequency (Fig. 5L). Neurons with a firing rate that is mostly stimulus phase dependent are called simple cells (Hubel and Wiesel, 1962; Liu et al., 2009; Smith and Hausser, 2010). Although Pyr cell firing was, on average, modulated by stimulus phase (mean control F1/F0 = 1.08 ± 0.2; Fig. 5L,N), consistent with previous reports (Niell and Stryker, 2008; Liu et al., 2009), PV+ cells did not display strong modulation (mean control F1/F0: 0.54 ± 0.05; Fig. 5K,M). However, during SOM+ activity, PV+ cells became more strongly modulated by stimulus phase (Fig. 5M,N). Analogous to the orientation tuning curve changes, which were dominated by a decrease in the untuned component, the significant changes in the F1/F0 ratio for PV+ cells were dominated by a change in the F0 portion, rather than the phase-dependent F1 portion (decrease in F0, p = 0.003; no change in F1, p = 0.15).
Figure 5.
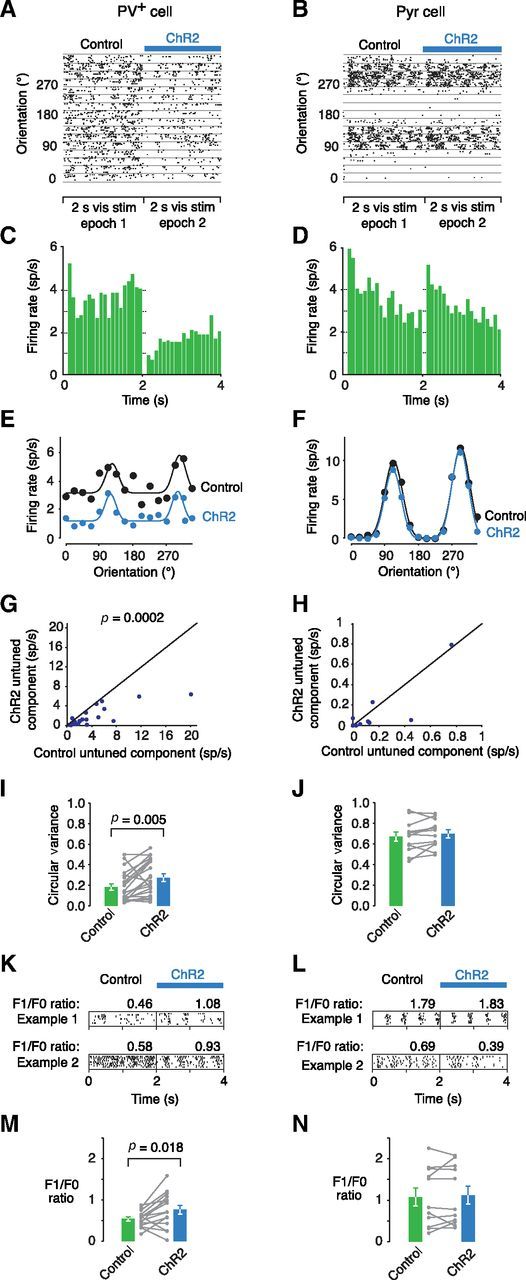
Differential effects of SOM+ activation on visual responses of PV+ cells and pyramidal neurons. A, B, Example PV+ and Pyr cell spike rasters and (C, D) peristimulus time histograms showing visual responses with and without SOM+ cell ChR2 stimulation. E, F, Mean responses for the same example cells fitted with Gaussian tuning curves. G, H, The untuned component of the tuning curve decreases for PV+ cells between control and ChR2 stimulation conditions (n = 21, p = 0.0002) but not for Pyr cells (n = 12, p = 0.492). The effect sizes differ significantly between cell types (n = 21,12, p < 0.001). The black line is the unity line. I, J, CV increases in PV+ cells (n = 21, p = 0.005) with ChR2 stimulation but not in Pyr cells (n = 12, p = 0.151). The effect sizes differ significantly between cell types (n = 21,12, p = 0.006). K, L, Example rasters showing the preferred orientation responses and F1/F0 ratios (a measure of stimulus phase selectivity which is >1 for simple cells) of two PV+ cells (left) and two Pyr cells (right). M, N, The F1/F0 ratios under control and SOM+ cell stimulation conditions for PV+ cells (n = 15, p = 0.018) and Pyr cells (n = 11, p = 0.520) show that PV+ cells become more like simple cells.
Alternate common measures of firing rate and orientation tuning also showed that PV+ cells were inhibited more strongly by SOM+ activity and their orientation tuning was enhanced, unlike in Pyr cells (Fig. 6A–D). Both cell types showed a decrease in the peak firing rate and the tuned component, but these decreases only reached significance in PV+ cells (Fig. 6E,H). Despite the effects of SOM+ cell manipulation, the preferred orientations of both the PV+ cells and Pyr cells did not change (Fig. 6I,J), nor did their tuning width (Fig. 6K,L). Direction selectivity is unchanged for PV+ cells with ChR2 stimulation and shows a nonsignificant increase in Pyr cells (Fig. 6M,N).
To establish when the inhibition had taken effect during the 2 s long visual stimulus presentations, the firing rates for all cells were plotted against time (averaged across all orientations; Fig. 7). The PV+ cells, which were more strongly inhibited by SOM+ activation, showed a reduction in firing throughout the 2 s (Fig. 7A–C). The PV+ cell difference in mean firing rate between control and ChR2 conditions shows a small increase in the first 500 ms of the stimulus presentation (Fig. 7D). The Pyr cell responses show less reduction from the control to the ChR2 condition (Fig. 7E–G). The mean firing and difference plots show that there is very little reduction in spiking for the first 150 ms of the stimulus followed by a sustained reduction for the remainder of the stimulus (Fig. 7H). Despite these small temporal variations, overall the reduction in spiking was approximately constant throughout the 2 s for both cell types.
Figure 7.
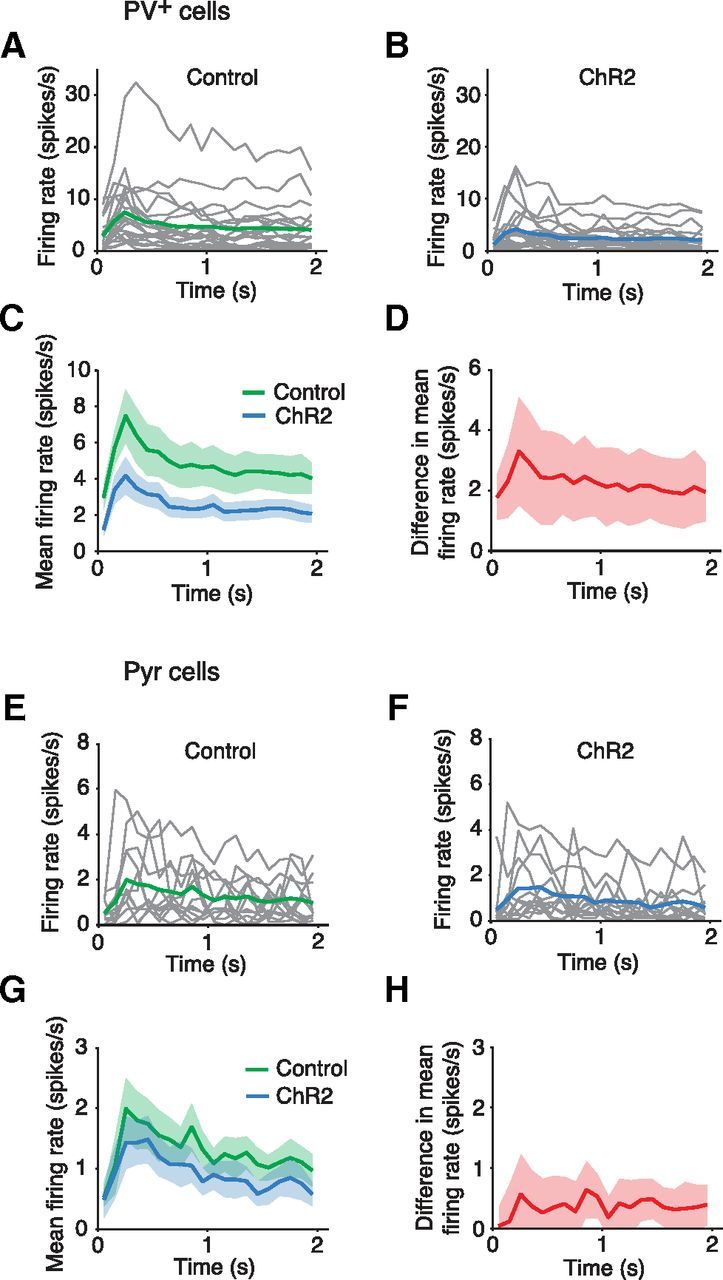
Timing of the reduction in firing rate driven by activation of ChR2-expressing SOM+ cells. Responses of PV+ cells (A–D) and Pyr cells (E–H) to 2 s visual stimuli in control conditions and during activation of SOM+ cell populations. A, Visual responses of PV+ cells (n = 21, grey lines); green line is population mean. B, Visual responses of PV+ cells (n = 21, grey lines) during ChR2 activation of SOM+ cells; blue line is population mean. C, Overlay of control PV+ response (green; mean with SEM) and the response during SOM+ activation (blue; mean with SEM). D, The difference in mean firing rates between the control condition and during SOM+ activation (shading is SEM). E–H, Pyr cell data (n = 12) in the same format as above.
Intense stimulation of SOM+ cells
Although Pyr cells were less sensitive than PV+ interneurons to SOM+ interneuron activity, increasing the intensity of the blue light ChR2 stimulus (from 4.1 to 8.0 mW/mm2) made it possible to inhibit Pyr activity and explore the effect on orientation tuning (Figs. 4I, 8). Pyr cells had their firing greatly reduced or were almost completely silenced by this intense ChR2 stimulation (Fig. 8A). Cell rasters and a summary histogram show that this reduction in firing took place throughout the visual stimulus epoch (Fig. 8B–D). Intracellular recordings from Pyr cells show that SOM+ cell stimulation hyperpolarizes Pyr cells and they spend a larger fraction of time in a down state (Fig. 8E–I). Previous work has shown that SOM+ and PV+ inhibition are able to significantly reduce firing in Pyr cells (Lee et al., 2012; Wilson et al., 2012). Our data agree that this is possible but that the stimulation level required to do so is beyond that required to suppress PV+ interneuron activity.
Figure 8.

Intense SOM+ cell activation is able to suppress firing in Pyr cells and hyperpolarize them. A, Intense SOM+ activation was achieved by increasing blue light intensity and ensuring the recorded cells were closer to the viral injection center. The Pyr cell visual tuning curves are shown with and without SOM+ activation. B, The preferred orientation of each cell is plotted as a raster with and without SOM+ activation, the results across all cells are summarized in the histogram (bottom). C, The untuned component is significantly decreased with SOM+ activation (n = 6, p = 0.031). D, The peak firing rate is significantly decreased with SOM+ activation (n = 6, p = 0.031). E, Intracellular recordings from a Pyr cell during visual stimulation and then during visual stimulation with simultaneous SOM+ cell stimulation. F, Intense SOM+ stimulation significantly hyperpolarizes Pyr cells with a mean hyperpolarization of 6.5 ± 1.5 mV (n = 7, p = 0.0045). G, An example cell showing up and down states; the down states become more prominent in the ChR2 condition. H, Membrane potential histograms show the bimodal distribution of up and down states in both control and ChR2 conditions. I, The fraction of time that the cell spends above −60 mV decreases significantly in the ChR2 condition (n = 7, p = 0.016).
Divisive and subtractive components in SOM+ cell inhibition of PV+ cells
Previous studies have examined whether the effect of inhibition produced by a particular interneuron type is divisive or subtractive (Mehaffey et al., 2005; Lee et al., 2012; Wilson et al., 2012). We found that virally transfected SOM+ inhibition reduces both the untuned and the tuned components of the PV+ cell response (untuned component: 54.6 ± 10.9% decrease from control levels, p = 0.0002, n = 21; Fig. 5G; tuned component: 23.3 ± 12.3% decrease from control levels, p = 0.019, n = 21; Fig. 6G). Significant inhibition was required to support this analysis, therefore only the effect of SOM+ activation on PV+ cells was investigated. This suggests that the inhibition can be described as neither purely subtractive nor purely divisive. To quantify this, we performed least-mean square fits analysis, which compared the control condition with the ChR2 condition while modifying the control curve in either a purely subtractive or a purely divisive manner. This resulted in a similar average mean squared error for subtraction (0.40 ± 0.23, n = 21) and division (0.38 ± 0.16, n = 21), with no significant difference between the hypothesized inhibition types (p = 0.61). We therefore conclude that although subtraction may dominate (through a larger decrease in the untuned component), SOM+-mediated inhibition of PV+ cells cannot be described as purely subtractive or divisive. This is further demonstrated graphically for representative PV+ cells (Fig. 9A–D). In these examples the experimentally induced change between the control and ChR2 conditions falls between the predictions for pure subtraction or pure division (Fig. 9A–D), similar to the population summary for all PV+ cells (Fig. 9E).
Figure 9.
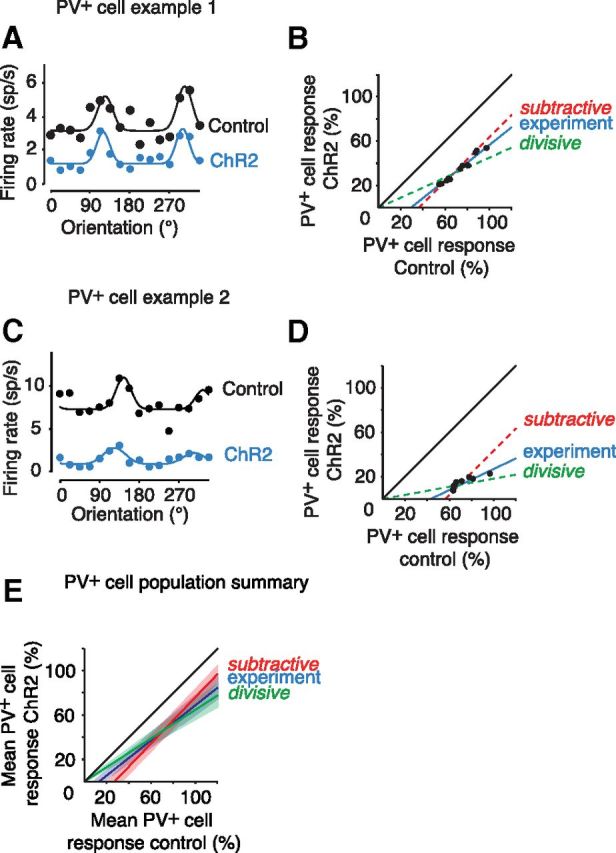
Neither pure subtraction nor pure division account for the changes in PV+ cell tuning with virally transfected SOM-ChR2 stimulation. A, The visual responses of a representative PV+ cell, showing responses with and without ChR2 stimulation. B, Control and ChR2 stimulated PV+ responses from the cell in A as a percentage of the maximal response plotted against each other. The black (unity) line represents no difference between the two conditions. The blue line is a linear fit (y = 0.799x − 23.36) of 30 points sampled from the control and ChR2 Gaussian curves in A. The red dashed line represents hypothetical pure subtraction while the green dashed line represents hypothetical pure division. C, D, A second representative PV+ cell with the same layout; the linear fit for the experimental data is (y = 0.525x − 29.28). E, Pooled data for the entire PV+ cell population (n = 21). Using the same layout as in B and D, the blue line (y = 0.7790x − 9.83) shows the control versus ChR2 responses averaged across all cells; the envelope around this line shows the SEM. The black (unity) line represents no difference between the two conditions and the red dashed line represents hypothetical pure subtraction, while the green dashed line represents hypothetical pure division and their envelopes show SEM.
Discussion
Our results reveal that activation of SOM+ cells in vivo suppresses PV+ cell spiking at least twice as strongly as it does Pyr cell spiking during sensory processing. This differential suppression occurs even when as few as two to three SOM+ cells are optogenetically activated. The result on visually evoked tuning curves is an untuned suppression of spiking in PV+ neurons that unmasks an orientation tuned spike response and simple cell-like phase modulation. This interaction suggests that interneuron–interneuron inhibition by SOM+ cell activation is an important functional element of the cortical circuitry in vivo, and can effect a reconfiguration of inhibitory input along the somatodendritic axis of Pyr cells in mouse visual cortex.
Recent studies have measured the effect of optogenetic activation of PV+ and SOM+ cells on Pyr cell tuning curves in vivo (Cardin et al., 2009; Adesnik et al., 2012; Atallah et al., 2012; Lee et al., 2012; Wilson et al., 2012). Our results demonstrate that interactions among PV+ and SOM+ cells must be taken into account when investigating the dynamics of sensory processing in Pyr cells, since SOM+ cell spiking cannot be increased independently of a suppression of PV+ cell spiking. PV+ cells can also make direct connections to SOM+ cells, so it is likely that independent manipulations of PV+ cell spiking cannot be made either (Gibson et al., 1999).
SOM+ and PV+ cells target their inhibition preferentially to different cellular compartments, with PV+ cells mainly targeting the perisomatic region and SOM+ cells, the dendrites (Wang et al., 2004; Freund and Katona, 2007). This means that as the ratio of SOM+ and PV+ input to a Pyr cell shifts, the focus of inhibition along the somatodendritic axis also shifts (Pouille and Scanziani, 2004). PV+ cells respond more rapidly to stimulus onset (Ma et al., 2010), possibly because they receive a larger proportion of feedforward input direct from layer 4 than do SOM+ cells (Adesnik et al., 2012), and receive depressing rather than facilitating excitatory synapses (Markram et al., 1998; Reyes et al., 1998). These observations suggest a model in which a Pyr cell will receive more somatic inhibition at stimulus onset, and later in the stimulus, facilitating excitatory input will lead to greater SOM+ cell activity, PV+ cell suppression (exacerbated by depressing excitatory input), and therefore a shift from somatic inhibition to dendritic inhibition of Pyr cells.
More intense optogenetic stimulation of SOM+ cells, beyond that required to suppress activity in PV+ cells, powerfully suppresses Pyr cell firing. This demonstrates that the level of optogenetic stimulation used can influence the experimental outcome, and emphasizes the importance of exploring different stimulation intensities, particularly in densely interconnected networks like neocortex. Any level of optogenetic stimulation of SOM+ interneurons that is sufficient to suppress Pyr cell firing is certain, based on our results, to even more powerfully suppress PV+ interneuron firing, and thus complicate attempts to ascribe specific functions SOM+ interneuron activity (Lee et al., 2012; Wilson et al., 2012).
Stimulation of small numbers of neurons has recently been shown to produce detectable activity changes in neighboring neurons, and can be behaviorally relevant (Brecht et al., 2004; Houweling and Brecht, 2008; Kwan and Dan, 2012; Wilson et al., 2012). Our results show that the activity of small numbers of SOM+ neurons can be differentially read out by downstream neurons, and this may be a mechanism by which inhibitory input to pyramidal cells can be regulated at the spatial scale of local microcircuits.
During optogenetic SOM+ cell activation, PV+ cell responses show enhanced orientation selectivity and 2 Hz temporal modulation. These changes are due to a preferential reduction in the untuned response component in the case of orientation tuning and the F0 unmodulated component in the case of temporal modulation. Together they imply that SOM+-driven inhibition in layer 2/3 makes PV+ cells more simple cell like. This result is likely due, in large part, to direct, untuned inhibitory input from the SOM+ cells, which exhibit nonorientation tuned responses (Ma et al., 2010). SOM+ cell activity might also suppress excitatory input to PV+ neurons; however, any such suppression would have to preferentially occur on untuned inputs, as the orientation tuned and phase modulated components of PV+ cell activity were left intact during optogenetic SOM+ cell activation. Early in development PV+ interneurons exhibit orientation-selective, simple cell-like tuning that is reduced later in development, coupled with a threefold increase in visually driven firing rate (Kuhlman et al., 2011). This initial orientation tuning may be due to bottom-up inputs of spatially segregated ON and OFF receptive field subregions (Liu et al., 2010; Smith and Hausser, 2010), and this simple cell-like pattern of input may be changed by promiscuous lateral excitatory connectivity from neighboring Pyr cells with diverse orientation preferences (Bock et al., 2011; Ko et al., 2011) that also increases their firing rate (Kuhlman et al., 2011). By selective inhibition of these lateral inputs, SOM+ activity could unmask the effects of retained, well tuned bottom-up inputs.
In the awake animal, the dynamics of inhibition can be complex. Some aspects of visually evoked inhibition are more intense in the awake mouse (Haider et al., 2013), but SOM+ interneurons in barrel cortex have been shown to be suppressed by sensory stimulation (Gentet et al., 2012), although they also appear important for spatial summation in visual cortex (Adesnik et al., 2012). One cellular consequence of SOM+ interneuron activity is clear from our results: these dendrite-targeting interneurons exert a powerful suppression of soma-targeting PV+ interneuron activity in vivo, and thus effect a dynamic spatial reconfiguration of inhibition of Pyr cells.
Footnotes
This work was supported by grants from the Wellcome Trust, European Research Council, and the Gatsby Charitable Foundation. We thank Hannah Monyer and Josh Huang for generous provision of transgenic mice. We are grateful to Matteo Carandini, Beverley Clark, Tom Mrsic-Flogel, Adam Packer, Claudia Racca, and Arnd Roth for helpful discussions and for comments on this manuscript and to Arifa Naeem for assistance with genotyping.
The authors declare no competing financial interests.
References
- Adesnik H, Bruns W, Taniguchi H, Huang ZJ, Scanziani M. A neural circuit for spatial summation in visual cortex. Nature. 2012;490:226–231. doi: 10.1038/nature11526. [DOI] [PMC free article] [PubMed] [Google Scholar]
- Atallah BV, Bruns W, Carandini M, Scanziani M. Parvalbumin-expressing interneurons linearly transform cortical responses to visual stimuli. Neuron. 2012;73:159–170. doi: 10.1016/j.neuron.2011.12.013. [DOI] [PMC free article] [PubMed] [Google Scholar]
- Bock DD, Lee WC, Kerlin AM, Andermann ML, Hood G, Wetzel AW, Yurgenson S, Soucy ER, Kim HS, Reid RC. Network anatomy and in vivo physiology of visual cortical neurons. Nature. 2011;471:177–182. doi: 10.1038/nature09802. [DOI] [PMC free article] [PubMed] [Google Scholar]
- Boyden ES, Zhang F, Bamberg E, Nagel G, Deisseroth K. Millisecond-timescale, genetically targeted optical control of neural activity. Nat Neurosci. 2005;8:1263–1268. doi: 10.1038/nn1525. [DOI] [PubMed] [Google Scholar]
- Brainard DH. The Psychophysics Toolbox. Spat Vis. 1997;10:433–436. doi: 10.1163/156856897X00357. [DOI] [PubMed] [Google Scholar]
- Brecht M, Schneider M, Sakmann B, Margrie TW. Whisker movements evoked by stimulation of single pyramidal cells in rat motor cortex. Nature. 2004;427:704–710. doi: 10.1038/nature02266. [DOI] [PubMed] [Google Scholar]
- Callaway EM. A molecular and genetic arsenal for systems neuroscience. Trends Neurosci. 2005;28:196–201. doi: 10.1016/j.tins.2005.01.007. [DOI] [PubMed] [Google Scholar]
- Carandini M, Ferster D. Membrane potential and firing rate in cat primary visual cortex. J Neurosci. 2000;20:470–484. doi: 10.1523/JNEUROSCI.20-01-00470.2000. [DOI] [PMC free article] [PubMed] [Google Scholar]
- Cardin JA, Carlén M, Meletis K, Knoblich U, Zhang F, Deisseroth K, Tsai LH, Moore CI. Driving fast-spiking cells induces gamma rhythm and controls sensory responses. Nature. 2009;459:663–667. doi: 10.1038/nature08002. [DOI] [PMC free article] [PubMed] [Google Scholar]
- Connors BW, Gutnick MJ. Intrinsic firing patterns of diverse neocortical neurons. Trends Neurosci. 1990;13:99–104. doi: 10.1016/0166-2236(90)90185-D. [DOI] [PubMed] [Google Scholar]
- DeFelipe J. Cortical interneurons: from Cajal to 2001. Prog Brain Res. 2002;136:215–238. doi: 10.1016/S0079-6123(02)36019-9. [DOI] [PubMed] [Google Scholar]
- DeFelipe J, López-Cruz PL, Benavides-Piccione R, Bielza C, Larrañaga P, Anderson S, Burkhalter A, Cauli B, Fairén A, Feldmeyer D, Fishell G, Fitzpatrick D, Freund TF, González-Burgos G, Hestrin S, Hill S, Hof PR, Huang J, Jones EG, Kawaguchi Y, et al. New insights into the classification and nomenclature of cortical GABAergic interneurons. Nat Rev Neurosci. 2013;14:202–216. doi: 10.1038/nrn3444. [DOI] [PMC free article] [PubMed] [Google Scholar]
- Freund TF, Katona I. Perisomatic inhibition. Neuron. 2007;56:33–42. doi: 10.1016/j.neuron.2007.09.012. [DOI] [PubMed] [Google Scholar]
- Gentet LJ, Kremer Y, Taniguchi H, Huang ZJ, Staiger JF, Petersen CC. Unique functional properties of somatostatin-expressing GABAergic neurons in mouse barrel cortex. Nat Neurosci. 2012;15:607–612. doi: 10.1038/nn.3051. [DOI] [PubMed] [Google Scholar]
- Gibson JR, Beierlein M, Connors BW. Two networks of electrically coupled inhibitory neurons in neocortex. Nature. 1999;402:75–79. doi: 10.1038/47035. [DOI] [PubMed] [Google Scholar]
- Gidon A, Segev I. Principles governing the operation of synaptic inhibition in dendrites. Neuron. 2012;75:330–341. doi: 10.1016/j.neuron.2012.05.015. [DOI] [PubMed] [Google Scholar]
- Gonchar Y, Wang Q, Burkhalter A. Multiple distinct subtypes of GABAergic neurons in mouse visual cortex identified by triple immunostaining. Front Neuroanat. 2007;1:3. doi: 10.3389/neuro.05.003.2007. [DOI] [PMC free article] [PubMed] [Google Scholar]
- Haider B, Häusser M, Carandini M. Inhibition dominates sensory responses in the awake cortex. Nature. 2013;493:97–100. doi: 10.1038/nature11665. [DOI] [PMC free article] [PubMed] [Google Scholar]
- Hofer SB, Ko H, Pichler B, Vogelstein J, Ros H, Zeng H, Lein E, Lesica NA, Mrsic-Flogel TD. Differential connectivity and response dynamics of excitatory and inhibitory neurons in visual cortex. Nat Neurosci. 2011;14:1045–1052. doi: 10.1038/nn.2876. [DOI] [PMC free article] [PubMed] [Google Scholar]
- Houweling AR, Brecht M. Behavioural report of single neuron stimulation in somatosensory cortex. Nature. 2008;451:65–68. doi: 10.1038/nature06447. [DOI] [PubMed] [Google Scholar]
- Hubel DH, Wiesel TN. Receptive fields, binocular interaction and functional architecture in the cat's visual cortex. J Physiol. 1962;160:106–154. doi: 10.1113/jphysiol.1962.sp006837. [DOI] [PMC free article] [PubMed] [Google Scholar]
- Hübener M. Mouse visual cortex. Curr Opin Neurobiol. 2003;13:413–420. doi: 10.1016/S0959-4388(03)00102-8. [DOI] [PubMed] [Google Scholar]
- Huberman AD, Niell CM. What can mice tell us about how vision works? Trends Neurosci. 2011;34:464–473. doi: 10.1016/j.tins.2011.07.002. [DOI] [PMC free article] [PubMed] [Google Scholar]
- Judkewitz B, Rizzi M, Kitamura K, Häusser M. Targeted single-cell electroporation of mammalian neurons in vivo. Nat Protoc. 2009;4:862–869. doi: 10.1038/nprot.2009.56. [DOI] [PubMed] [Google Scholar]
- Kawaguchi Y. Groupings of nonpyramidal and pyramidal cells with specific physiological and morphological characteristics in rat frontal cortex. J Neurophysiol. 1993;69:416–431. doi: 10.1152/jn.1993.69.2.416. [DOI] [PubMed] [Google Scholar]
- Kawaguchi Y, Kubota Y. GABAergic cell subtypes and their synaptic connections in rat frontal cortex. Cereb Cortex. 1997;7:476–486. doi: 10.1093/cercor/7.6.476. [DOI] [PubMed] [Google Scholar]
- Kerlin AM, Andermann ML, Berezovskii VK, Reid RC. Broadly tuned response properties of diverse inhibitory neuron subtypes in mouse visual cortex. Neuron. 2010;67:858–871. doi: 10.1016/j.neuron.2010.08.002. [DOI] [PMC free article] [PubMed] [Google Scholar]
- Kitamura K, Judkewitz B, Kano M, Denk W, Häusser M. Targeted patch-clamp recordings and single-cell electroporation of unlabeled neurons in vivo. Nat Methods. 2008;5:61–67. doi: 10.1038/nmeth1150. [DOI] [PubMed] [Google Scholar]
- Ko H, Hofer SB, Pichler B, Buchanan KA, Sjöström PJ, Mrsic-Flogel TD. Functional specificity of local synaptic connections in neocortical networks. Nature. 2011;473:87–91. doi: 10.1038/nature09880. [DOI] [PMC free article] [PubMed] [Google Scholar]
- Komai S, Denk W, Osten P, Brecht M, Margrie TW. Two-photon targeted patching (TPTP) in vivo. Nat Protoc. 2006;1:647–652. doi: 10.1038/nprot.2006.100. [DOI] [PubMed] [Google Scholar]
- Kuhlman SJ, Tring E, Trachtenberg JT. Fast-spiking interneurons have an initial orientation bias that is lost with vision. Nat Neurosci. 2011;14:1121–1123. doi: 10.1038/nn.2890. [DOI] [PMC free article] [PubMed] [Google Scholar]
- Kwan AC, Dan Y. Dissection of cortical microcircuits by single-neuron stimulation in vivo. Curr Biol. 2012;22:1459–1467. doi: 10.1016/j.cub.2012.06.007. [DOI] [PMC free article] [PubMed] [Google Scholar]
- Lee SH, Kwan AC, Zhang S, Phoumthipphavong V, Flannery JG, Masmanidis SC, Taniguchi H, Huang ZJ, Zhang F, Boyden ES, Deisseroth K, Dan Y. Activation of specific interneurons improves V1 feature selectivity and visual perception. Nature. 2012;488:379–383. doi: 10.1038/nature11312. [DOI] [PMC free article] [PubMed] [Google Scholar]
- Lee S, Hjerling-Leffler J, Zagha E, Fishell G, Rudy B. The largest group of superficial neocortical GABAergic interneurons expresses ionotropic serotonin receptors. J Neurosci. 2010;30:16796–16808. doi: 10.1523/JNEUROSCI.1869-10.2010. [DOI] [PMC free article] [PubMed] [Google Scholar]
- Liu BH, Li P, Li YT, Sun YJ, Yanagawa Y, Obata K, Zhang LI, Tao HW. Visual receptive field structure of cortical inhibitory neurons revealed by two-photon imaging guided recording. J Neurosci. 2009;29:10520–10532. doi: 10.1523/JNEUROSCI.1915-09.2009. [DOI] [PMC free article] [PubMed] [Google Scholar]
- Liu BH, Li P, Sun YJ, Li YT, Zhang LI, Tao HW. Intervening inhibition underlies simple-cell receptive field structure in visual cortex. Nat Neurosci. 2010;13:89–96. doi: 10.1038/nn.2443. [DOI] [PMC free article] [PubMed] [Google Scholar]
- Lovett-Barron M, Turi GF, Kaifosh P, Lee PH, Bolze F, Sun XH, Nicoud JF, Zemelman BV, Sternson SM, Losonczy A. Regulation of neuronal input transformations by tunable dendritic inhibition. Nat Neurosci. 2012;15:423–430. S1–S3. doi: 10.1038/nn.3024. [DOI] [PubMed] [Google Scholar]
- Luo L, Callaway EM, Svoboda K. Genetic dissection of neural circuits. Neuron. 2008;57:634–660. doi: 10.1016/j.neuron.2008.01.002. [DOI] [PMC free article] [PubMed] [Google Scholar]
- Ma WP, Liu BH, Li YT, Huang ZJ, Zhang LI, Tao HW. Visual representations by cortical somatostatin inhibitory neurons–selective but with weak and delayed responses. J Neurosci. 2010;30:14371–14379. doi: 10.1523/JNEUROSCI.3248-10.2010. [DOI] [PMC free article] [PubMed] [Google Scholar]
- Marin-Padilla M. Origin of the pericellular baskets of the pyramidal cells of the human motor cortex: a Golgi study. Brain Res. 1969;14:633–646. doi: 10.1016/0006-8993(69)90204-2. [DOI] [PubMed] [Google Scholar]
- Markram H, Wang Y, Tsodyks M. Differential signaling via the same axon of neocortical pyramidal neurons. Proc Natl Acad Sci U S A. 1998;95:5323–5328. doi: 10.1073/pnas.95.9.5323. [DOI] [PMC free article] [PubMed] [Google Scholar]
- Markram H, Toledo-Rodriguez M, Wang Y, Gupta A, Silberberg G, Wu C. Interneurons of the neocortical inhibitory system. Nat Rev Neurosci. 2004;5:793–807. doi: 10.1038/nrn1519. [DOI] [PubMed] [Google Scholar]
- McCormick DA, Connors BW, Lighthall JW, Prince DA. Comparative electrophysiology of pyramidal and sparsely spiny stellate neurons of the neocortex. J Neurophysiol. 1985;54:782–806. doi: 10.1152/jn.1985.54.4.782. [DOI] [PubMed] [Google Scholar]
- Mehaffey WH, Doiron B, Maler L, Turner RW. Deterministic multiplicative gain control with active dendrites. J Neurosci. 2005;25:9968–9977. doi: 10.1523/JNEUROSCI.2682-05.2005. [DOI] [PMC free article] [PubMed] [Google Scholar]
- Meyer AH, Katona I, Blatow M, Rozov A, Monyer H. In vivo labeling of parvalbumin-positive interneurons and analysis of electrical coupling in identified neurons. J Neurosci. 2002;22:7055–7064. doi: 10.1523/JNEUROSCI.22-16-07055.2002. [DOI] [PMC free article] [PubMed] [Google Scholar]
- Murayama M, Pérez-Garci E, Nevian T, Bock T, Senn W, Larkum ME. Dendritic encoding of sensory stimuli controlled by deep cortical interneurons. Nature. 2009;457:1137–1141. doi: 10.1038/nature07663. [DOI] [PubMed] [Google Scholar]
- Nagel G, Szellas T, Huhn W, Kateriya S, Adeishvili N, Berthold P, Ollig D, Hegemann P, Bamberg E. Channelrhodopsin-2, a directly light-gated cation-selective membrane channel. Proc Natl Acad Sci U S A. 2003;100:13940–13945. doi: 10.1073/pnas.1936192100. [DOI] [PMC free article] [PubMed] [Google Scholar]
- Niell CM, Stryker MP. Highly selective receptive fields in mouse visual cortex. J Neurosci. 2008;28:7520–7536. doi: 10.1523/JNEUROSCI.0623-08.2008. [DOI] [PMC free article] [PubMed] [Google Scholar]
- Oliva AA, Jr, Jiang M, Lam T, Smith KL, Swann JW. Novel hippocampal interneuronal subtypes identified using transgenic mice that express green fluorescent protein in GABAergic interneurons. J Neurosci. 2000;20:3354–3368. doi: 10.1523/JNEUROSCI.20-09-03354.2000. [DOI] [PMC free article] [PubMed] [Google Scholar]
- Pfeffer CK, Xue M, He M, Huang ZJ, Scanziani M. Inhibition of inhibition in visual cortex: the logic of connections between molecularly distinct interneurons. Nat Neurosci. 2013;16:1068–1076. doi: 10.1038/nn.3446. [DOI] [PMC free article] [PubMed] [Google Scholar]
- Pouille F, Scanziani M. Routing of spike series by dynamic circuits in the hippocampus. Nature. 2004;429:717–723. doi: 10.1038/nature02615. [DOI] [PubMed] [Google Scholar]
- Ramon y Cajal S. Histologie du système nerveux de l'homme et des vertébrés. Maloine. 1909 [Google Scholar]
- Reyes A, Lujan R, Rozov A, Burnashev N, Somogyi P, Sakmann B. Target-cell-specific facilitation and depression in neocortical circuits. Nat Neurosci. 1998;1:279–285. doi: 10.1038/1092. [DOI] [PubMed] [Google Scholar]
- Royer S, Zemelman BV, Losonczy A, Kim J, Chance F, Magee JC, Buzsáki G. Control of timing, rate and bursts of hippocampal place cells by dendritic and somatic inhibition. Nat Neurosci. 2012;15:769–775. doi: 10.1038/nn.3077. [DOI] [PMC free article] [PubMed] [Google Scholar]
- Runyan CA, Schummers J, Van Wart A, Kuhlman SJ, Wilson NR, Huang ZJ, Sur M. Response features of parvalbumin-expressing interneurons suggest precise roles for subtypes of inhibition in visual cortex. Neuron. 2010;67:847–857. doi: 10.1016/j.neuron.2010.08.006. [DOI] [PMC free article] [PubMed] [Google Scholar]
- Shcherbo D, Merzlyak EM, Chepurnykh TV, Fradkov AF, Ermakova GV, Solovieva EA, Lukyanov KA, Bogdanova EA, Zaraisky AG, Lukyanov S, Chudakov DM. Bright far-red fluorescent protein for whole-body imaging. Nat Methods. 2007;4:741–746. doi: 10.1038/nmeth1083. [DOI] [PubMed] [Google Scholar]
- Silberberg G. Polysynaptic subcircuits in the neocortex: spatial and temporal diversity. Curr Opin Neurobiol. 2008;18:332–337. doi: 10.1016/j.conb.2008.08.009. [DOI] [PubMed] [Google Scholar]
- Silberberg G, Markram H. Disynaptic inhibition between neocortical pyramidal cells mediated by Martinotti cells. Neuron. 2007;53:735–746. doi: 10.1016/j.neuron.2007.02.012. [DOI] [PubMed] [Google Scholar]
- Smith SL, Häusser M. Parallel processing of visual space by neighboring neurons in mouse visual cortex. Nat Neurosci. 2010;13:1144–1149. doi: 10.1038/nn.2620. [DOI] [PMC free article] [PubMed] [Google Scholar]
- Smith SL, Smith IT, Branco T, Häusser M. Dendritic spikes enhance stimulus selectivity in cortical neurons in vivo. Nature. 2013;503:115–120. doi: 10.1038/nature12600. [DOI] [PMC free article] [PubMed] [Google Scholar]
- Sohya K, Kameyama K, Yanagawa Y, Obata K, Tsumoto T. GABAergic neurons are less selective to stimulus orientation than excitatory neurons in layer II/III of visual cortex, as revealed by in vivo functional Ca2+ imaging in transgenic mice. J Neurosci. 2007;27:2145–2149. doi: 10.1523/JNEUROSCI.4641-06.2007. [DOI] [PMC free article] [PubMed] [Google Scholar]
- Taniguchi H, He M, Wu P, Kim S, Paik R, Sugino K, Kvitsiani D, Fu Y, Lu J, Lin Y, Miyoshi G, Shima Y, Fishell G, Nelson SB, Huang ZJ. A resource of Cre driver lines for genetic targeting of GABAergic neurons in cerebral cortex. Neuron. 2011;71:995–1013. doi: 10.1016/j.neuron.2011.07.026. [DOI] [PMC free article] [PubMed] [Google Scholar]
- Wang Y, Toledo-Rodriguez M, Gupta A, Wu C, Silberberg G, Luo J, Markram H. Anatomical, physiological and molecular properties of Martinotti cells in the somatosensory cortex of the juvenile rat. J Physiol. 2004;561:65–90. doi: 10.1113/jphysiol.2004.073353. [DOI] [PMC free article] [PubMed] [Google Scholar]
- Wilson NR, Runyan CA, Wang FL, Sur M. Division and subtraction by distinct cortical inhibitory networks in vivo. Nature. 2012;488:343–348. doi: 10.1038/nature11347. [DOI] [PMC free article] [PubMed] [Google Scholar]
- Xu X, Roby KD, Callaway EM. Immunochemical characterization of inhibitory mouse cortical neurons: three chemically distinct classes of inhibitory cells. J Comp Neurol. 2010;518:389–404. doi: 10.1002/cne.22229. [DOI] [PMC free article] [PubMed] [Google Scholar]
- Zariwala HA, Madisen L, Ahrens KF, Bernard A, Lein ES, Jones AR, Zeng H. Visual tuning properties of genetically identified layer 2/3 neuronal types in the primary visual cortex of cre-transgenic mice. Front Syst Neurosci. 2011;4:162. doi: 10.3389/fnsys.2010.00162. [DOI] [PMC free article] [PubMed] [Google Scholar]