

Abstract
Large-scale neural activation dynamics in the hippocampal-entorhinal circuit local field potential, observable as theta and gamma rhythms and coupling between these rhythms, is predictive of encoding success. Behavioral studies show that systemic administration of muscarinic acetylcholine receptor antagonists selectively impairs encoding, suggesting that they may also disrupt the coupling between the theta and gamma bands. Here, we tested the hypothesis that muscarinic antagonists selectively disrupt coupling between theta and gamma. Specifically, we characterized the effects of systemically administered scopolamine on movement-induced theta and gamma rhythms recorded in the superficial layers of the medial entorhinal cortex (MEC) of freely moving rats. We report the novel result that gamma power at the peak of theta was most reduced following muscarinic blockade, significantly shifting the phase of maximal gamma power to occur at later phases of theta. We also characterize the existence of multiple distinct gamma bands in the superficial layers of the MEC. Further, we observed that theta frequency was significantly less modulated by movement speed following muscarinic blockade. Finally, the slope relating speed to theta frequency, a correlate of familiarity with a testing enclosure, increased significantly less between the preinjection and recovery trials when scopolamine was administered during the intervening injection session than when saline was administered, suggesting that scopolamine reduced encoding of the testing enclosure. These data are consistent with computational models suggesting that encoding and retrieval occur during the peak and trough of theta, respectively, and support the theory that acetylcholine regulates the balance between encoding versus retrieval.
Keywords: theta, gamma, acetylcholine, entorhinal cortex, encoding, path integration
Introduction
Large-scale neural activation dynamics that occur as an event is experienced are predictive of how well the event will be remembered (Sederberg et al., 2003, 2007; Gruber et al., 2013). In particular, successful memory encoding correlates with increased theta and gamma (Sederberg et al., 2003; Osipova et al., 2006; Jutras and Buffalo, 2010; Addante et al., 2011; Lundqvist et al., 2011) and phase amplitude coupling between theta and gamma (Tort et al., 2008, 2009).
Theta and gamma band rhythms are signatures of normal activation dynamics in the entorhinal cortex and hippocampus (Bragin et al., 1995; Buzsáki, 2002; Hasselmo, 2005; Colgin et al., 2009), areas important for memory formation and navigation (McNaughton et al., 1996; Hasselmo and Eichenbaum, 2005; Steffenach et al., 2005; Eichenbaum and Lipton, 2008; O'Reilly et al., 2011). Theta is important for performance of memory and navigational tasks (Winson, 1978; Mitchell et al., 1982; Mizumori et al., 1990; Givens and Olton, 1994). Each phase of theta is characterized by distinct physiological dynamics. During the peak, entorhinal input to hippocampal area CA1 is strong and long-term potentiation (LTP) can be readily induced. During the trough, entorhinal input to CA1 is weak and LTP is less readily induced (Buzsáki et al., 1986; Brankack et al., 1993; Bragin et al., 1995; Huerta and Lisman, 1996; Hyman et al., 2003). Communication between the entorhinal cortex and CA1 is marked by gamma at select phases of theta (Charpak et al., 1995; Colgin et al., 2009; Belluscio et al., 2012).
Acetylcholine may tune the physiological dynamics of the entorhinal–hippocampal circuit to upregulate encoding-related activity. Acetylcholine, acting at muscarinic cholinergic receptors, differentially shifts the excitability of principal cells and interneurons (Cole and Nicoll, 1984; Pitler and Alger, 1992), differentially modulates extrinsic and intrinsic projections (Hasselmo and Bower, 1992; Hasselmo and Schnell, 1994; Hasselmo et al., 1995), and facilitates the induction of LTP (Blitzer et al., 1990; Huerta and Lisman, 1993; Gil et al., 1997; Adams et al., 2004). Behaviorally, muscarinic antagonists impair encoding, but not retrieval, of episodic memories in humans and rats (for reviews, see Hasselmo, 2006; Hasselmo and Sarter, 2011; Newman et al., 2012).
Here, we tested the hypothesis that the muscarinic antagonist scopolamine would reduce gamma power during the peak of theta in the entorhinal cortex, the anatomical source of encoding-related input to the hippocampus. We characterized the effects of systemically administered scopolamine on movement-induced theta and gamma rhythms recorded in the superficial layers of the medial entorhinal cortex (MEC) of freely moving rats. We found that gamma was most reduced at the peak of theta, that multiple gamma bands exist in the superficial layers of the MEC, and that the slope relating movement speed to theta frequency increased significantly less following scopolamine than following saline.
Materials and Methods
All animal procedures and surgery were in strict accordance with National Institutes of Health and Boston University Animal Care and Use Committee guidelines.
Subjects.
Data were recorded from six male Long–Evans rats. Scopolamine sessions were conducted on all six rats. Usable saline sessions were collected from four rats. We were unable to collect a saline session in one animal because the animal had to be killed for health-related reasons before running the saline session. The saline session from another animal had to be discarded due to unacceptable levels of line noise during the injection trial. All animals weighed 350–400 g at the time of surgery, were individually housed, were maintained at 90% of their free-feeding weight following their full recovery after surgery, and maintained on a 12 h light/dark cycle. All procedures were conducted during the light cycle.
Behavioral protocol.
The behavioral protocol is summarized in Figure 1. Animals were given a food reward for every complete lap run in either direction on a circle track enclosure (112 cm diameter; 8 cm wide track; 5 cm tall walls; Fig. 1A). A single session consisted of three 15 min trials (Fig. 1B). We refer to the first of these as the baseline trial, the second as the injection trial, and the third trial as the recovery trial. Injections were administered within 30 min after the baseline trial. Injection trials were run 15 min following the injection. Recovery trials were run 3–6 h after the injection. Animals were rewarded with cereal bits at a fixed location for each complete lap run regardless of direction. Task training with multiple laps was performed a minimum of three times before surgery and again a minimum of five times following surgery before data collection. All animals readily learned to complete laps for reward within the first two trials and ran the task consistently by the time recordings were made. A black curtain surrounded the circle track and no overt visual cues were provided. All testing was performed under low light conditions (i.e., the minimum light needed for the experimenter to deliver rewards). The animals were also run in an open field foraging task before or after the sequence of three circle track trials as part of another study; behavior on the circle track was not detectably altered as a consequence of the open field trials.
Figure 1.

Overview of the behavioral paradigm. A, Animals completed laps on a circle track in either direction for food rewards. B, Data were collected during three 15 min trials: a baseline trial 30 min before the injection, an injection trial 15 min post injection, and a recovery trial 3–6 h post injection. The injection was either a 0.5 mg/kg dose of scopolamine-hydrobromide or a volume-matched injection of sterile saline. C, Animal behavior was altered by scopolamine in that animals spent less time stopped eating the rewards and rarely ran fast (>40 cm/s) around the track. To match behavior over subsequent analyses, epochs with minimal movements (0–4 cm/s), moderate movements (4–40 cm/s), and fast movements (>40 cm/s), were analyzed separately (inset). The error bars indicate SEs over rats (saline: n = 4; scop: n = 6).Scop, scopolamine.
Surgical procedure.
For implantation of electrodes, rats were anesthetized with isoflurane and a ketamine/xylazine mixture, the skull surface was exposed, and five to nine anchor screws and one ground screw (located anterior and lateral to the bregma skull suture) were affixed to the skull. Tetrodes were constructed out of four 12.7 μm diameter nichrome wires twisted together that were gold plated to bring the impedance at 1 kHz down to 150–300 kΩ. Tetrodes were either bundled together and mounted a single screw drive from Axona or loaded into a multiscrew hyper-drive giving an average of 300 μm intertetrode spacing. The Axona drive was implanted into the brain at 4.5 mm lateral, 0.3 mm anterior from the transverse sinus, 1.5 mm deep, and tipped 10 degrees in the anterior direction. The tetrode bundle of the hyper-drive was centered on a point 4.5 mm lateral and was placed anterior of the transverse sinus so that the posterior edge of the bundle abutted the sinus. No angle was used when implanting the hyper-drives. In one animal, a hyper-drive with tetrodes aimed for the entorhinal cortex (with the coordinates noted above) and tetrodes aimed for area CA1 of the dorsal hippocampus from a point immediately above the entorhinal cortex (3.0 mm mediolateral, 5.0 mm anteroposterior, 28 degree angle from vertical, rotated medially 15 degrees). The screws and drives were attached to the skull with dental acrylic. The rats recovered for 7 d before behavioral testing and recording began. A representative histological example of a site of recording is shown in Figure 2A from an animal implanted with the hyper-drive. The recording from hippocampal area CA1 allowed us to characterize the patterns of theta-gamma phase amplitude observed before versus after the theta phase reversal in layer 2 MEC as shown in Figure 2, B and C (Mitchell and Ranck, 1980; Quilichini et al., 2010).
Figure 2.

Recordings were made from the superficial layers of the MEC. A, An example histological slide showing the estimated location of two channels that were located on either side of layer II during a single recording. B, In the same animal, LFP was also recorded near the pyramidal layer of hippocampal area CA1. Time-locked averages of the LFP, triggered on the peak phase of theta recorded near CA1, for the electrodes located near CA1 (top), entorhinal cortex layer 3 (EC3; middle), and entorhinal cortex layer 1 (EC2; bottom) showing that theta reverses phase between layer 3 and 1. C, The distribution of 20–40 Hz gamma power over theta phases for the electrodes located in EC3 and EC2. The x-axis reflects the phase of the local theta phase. The phase at which maximal low-gamma (20–40 Hz) power occurred also reversed between EC3 and EC1. D, E, Channels were selected for inclusion in the analyses based on the pattern of theta-gamma phase amplitude coupling. D, The distribution of low-gamma power over theta phases (black line) was used to define the phase boundaries of two windows of interest (I and II). These windows were defined with respect to the phase at which the slope of the low-gamma distribution was most negative. The slope of the low-gamma distribution is plotted as a gray line, and the point where this slope was most negative is labeled as ϕ. E, The mean high-gamma power had to be <1 in window I and >1 in window II. The bounds of window I were ϕ − 180° through ϕ − 60° and the bounds of window II were ϕ − 60° through ϕ + 60° as shown marked by the boxes superimposed over the dotted line plotting the mean high-gamma power at each phase of theta. An idealized wave is shown below each part as a pink dashed line.
Data acquisition.
Data collection was performed with the Axona DacqUSB system. The same system tracked the position of the animal at a rate of 50 Hz. Local field potentials (LFPs; raw signals referenced to a ground screw, amplified ∼1000–3000×, digitized at 250 Hz) were recorded from a single lead of the implanted tetrodes. Tetrodes were turned in daily increments of 50–200 μm until the superficial layers of the entorhinal cortex were reached, as identified by the pattern of theta-gamma phase amplitude coupling as described (see below, Data inclusion criteria).
Scopolamine administration.
Scopolamine hydrobromide injections (0.5 mg/kg) were administered intraperitoneally. Volume-matched injections of sterile saline were administered as a control condition. Animals rested on a pedestal for 15 min following the injection to allow for the drug to take effect before running the postinjection trial. A minimum of three intervening days was allowed between sequential scopolamine injections.
Data figures.
In all figures, data labeled as “Baseline” reflect the data collected during the preinjection trials from the scopolamine condition. The baseline data from only one of the conditions were shown in the plots because the baseline data were so similar between conditions that the additional line added little value to the figure and crowded the image. In all numerical analyses, however, the injection data were compared with the baseline data collected from the same condition (i.e., saline injection effects were computed through comparison of the preinjection and injection trials from the saline condition). The error bars in Figures 1–4 and 5B reflect SEs of the mean over animals. In Figure 5 A and C, the error bars are modified Loftus–Mason SE bars (Cousineau, 2005) to account for baseline shifts in mean theta frequency over animals and thereby better reflect the variance in the change of theta frequency as a function of running speed over animals.
Figure 3.

Influences of muscarinic blockade on the spectrum of the LFP. A, B, The spectra for epochs of minimal (0–4 cm/s) and moderate (4–40 cm/s) movement speeds during the preinjection and injection trials for the saline condition (A) and scopolamine condition (B). C, The average power change for four frequency bands—theta (θ; 6–9 Hz), beta (β; 12–20 Hz), low-gamma (γlow; 20–40 Hz), high-gamma (γhigh; 60–120 Hz)—between the baseline and injection trials in the saline and scopolamine conditions. Only high-gamma power in the scopolamine injection trial was significantly changed from the baseline level. D, Computing the mean power changes separately for epochs of minimal (0–4 cm/s) and moderate (4 40 cm/s) movements to control for scopolamine-induced behavioral changes shows a qualitatively similar pattern. High-gamma power was similarly reduced in both epoch types. Beta and low-gamma both trended toward having increased power during epochs of minimal movement relative to baseline trials. Theta power remained stable at all speeds. E, The power in all four bands was significantly higher during epochs of moderate movement than during epochs of minimal movement. Despite reducing high-gamma power, scopolamine did not diminish this movement-related power increase. Movement-related power increases in theta were also preserved. The power of beta and low-gamma, however, was not significantly different between minimal and moderate movement epochs following scopolamine as a result of the increase in power during minimal movement epochs. Error bars indicate SE over animals (saline: n = 4; scop: n = 6). Scop., scopolamine; pre, pre-injection baseline trial; inj, injection trial; min, minimal movement epochs; mod, moderate movement epochs.
Figure 4.
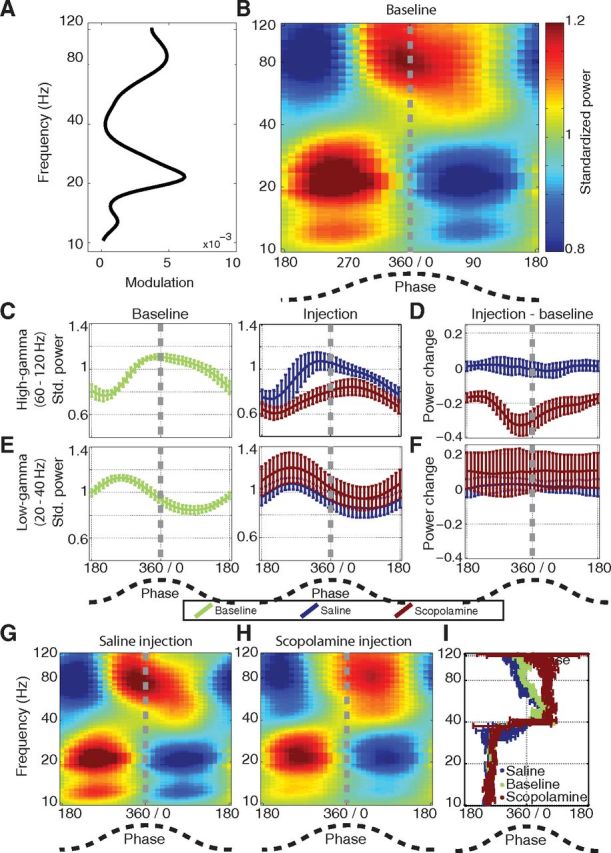
Scopolamine selectively decreases peak-locked high-gamma power. A, The modulation score between 6–9 Hz theta and each of 95 logarithmically spaced frequency bands spanning 10–120 Hz (plotted along the y-axis). Three peaks were visible, one spanning 10–16 Hz beta, another spanning 16–40 Hz low-gamma, and another spanning 60–120 Hz high-gamma. B, The distribution of power for each of the frequency bands shown in A over theta phases. Below ∼40 Hz, the power was maximal during the rising phase of theta. Above ∼40 Hz, the maximal power was observed during the peak of theta, particularly in the 60–120 Hz range. C, The mean distribution of power over theta phases for the 60–120 Hz high-gamma band during epochs of moderate movement speeds with error bars indicating the SEM over animals for the baseline trial (left) and the injection trials (right). In this plot, and in all other error bar plots in this figure, the power was standardized to the mean of the baseline trial. The blue line on the right reflects the mean distribution of high-gamma power over phases for the saline injection trials and the red line reflects the mean of the scopolamine trials. Relative to the saline trials, the maximal power was skewed away from the peak of theta, toward the later phases, in the scopolamine trials. D, The difference in the power distributions between the injection and baseline trials for both saline (blue) and scopolamine (red) conditions. During scopolamine trials, the power of high-gamma was particularly reduced around the peak of theta. All phases were minimally changed in the saline condition. E, The mean distribution of low-gamma power over theta phases during epochs of moderate movement speeds for the baseline (left) and injection trials (right; blue for saline, red for scopolamine). There was little change in the distribution between the baseline and injection trials in both conditions. F, The difference in the power distributions between the injection and baseline trials. Similar minimal changes were observed over all phases in both conditions. G, H, The distribution of power over theta phases for all frequency bands during saline trials (G) and scopolamine trials (H). I, The phase of maximal power in each frequency band during the baseline (green), saline (blue), and scopolamine (red) trials. Below ∼40 Hz, the phase remained stable over trials. Above ∼40 Hz, the phase was shifted later during the scopolamine trials, particularly in the 60–120 Hz band. The error bars indicate SE over animals (saline: n = 4; scopolamine: n = 6). Std. power, the quotient of the power to the mean of the trial mentioned in the legend.
Figure 5.

Scopolamine reduced the slope relating movement speed to theta frequency. A, Theta frequency plotted as a function of movement speed for baseline, injection, and recovery trials in the saline condition. With additional experience, the slope became steeper. B, The mean slope (top) and intercept (bottom) over trials in the saline and scopolamine conditions. The slope became steeper over trials in the saline condition but not the scopolamine condition. The slope during the injection trial of the scopolamine session was not significantly greater than zero. The intercept remained stable over trials but increased significantly during scopolamine trials. C, Theta frequency plotted as a function of movement speed for baseline, injection, and recovery trials in the scopolamine condition. During the scopolamine injection trial, theta frequency was significantly less modulated by running speed. A, C, Error bars indicate modified Loftus–Mason SEs over animals (Cousineau, 2005) to account for baseline shifts in mean theta frequency over animals. B, Error bars indicate SEM (saline: n = 4; scopolamine: n = 6).
Data analysis.
All analyses were performed in MATLAB using the custom written Center for Memory and Brain software (CMBHOME) data processing toolbox, as well as the MATLAB signal processing toolbox, the statistics toolbox, and additional custom analysis scripts.
Statistics.
Statistical comparisons of linear variables (in contrast to circular variables such as theta phase) were performed using Student's t tests with an α of 0.05 after verifying that each approximated a normal distribution. To test if the theta phase of maximal gamma power changed between two samples (e.g., before vs after scopolamine administration) we performed both independent and paired-samples tests. For the independent test, we used the Watson–Williams F statistic (Fisher, 1996; Douchamps et al., 2013). Paired-samples test were performed by testing if the mean difference in phase values over rats was different from zero using the circ_mtest.m function in the circStat MATLAB toolbox (Berens, 2009). The test was considered significant at the 0.05 level if the 95% confidence limits computed by this function did not include zero. In all tests, individual animals served as the unit of analysis unless explicitly stated. When multiple sessions were available for individual animals, the mean was computed over sessions within animal before performing the statistics over animals.
Behavior.
Movement speed was estimated from the difference between sequential head tracking coordinates. Movement speed histograms, shown in Figure 1C, were computed for each trial by summing the percentage of head tracking samples that the speed fell into for each 1 cm/s bin from 0 to 80 cm/s. Behavior was split into epochs of minimal movement (<4 cm/s) and epochs of movement to explore scopolamine-induced shifts in the electrophysiology during these two types of behaviors. As described (see Results), animals ran faster during baseline and saline trials than during scopolamine trials. To prevent movement-related shifts in electrophysiology from biasing the comparison of scopolamine trials to baseline trials, movement epochs were further split into epochs of moderate (4–40 cm/s) and fast (>40 cm/s) movement speeds. This allowed us to compare the electrophysiology during moderate speeds for which ample data were available during both the baseline and scopolamine trials.
Data inclusion criteria.
Field potential data from individual tetrodes were cleaned and selected for inclusion in the analysis based on the quality and content of the signal. Before processing, the data were cleaned by removing epochs of signal saturation and a 500 ms buffer around any instance of saturation to prevent the inclusion of saturation-related artifacts in the analyses. Among the channels included in the analyses, an average of 95 ± 2% of the data from each trial remained following this cleaning step.
The cleaned data from all channels available for a given session were then subjected to a series of objective channel inclusion criteria to identify the best channel for the session. The inclusion criteria included the following: (1) The ratio of theta (6–10 Hz) to delta (1–3 Hz) power must be greater than two for >5% of the trial duration; (2) The theta-gamma comodulation in both the low-gamma (20–40 Hz) and high-gamma (60–120 Hz) bands must be >0.002; (3) The frequency of maximum comodulation in the high-gamma band must be a local maximum (i.e., not 60 Hz or 120 Hz) to prevent spectral bleed from other bands, including from spiking, from appearing as high-gamma modulation; (4) the mean standardized 60–120 Hz power in “Phase window I” must be <1; and (5) the mean standardized 60–120 Hz power in “Phase window II” must be >1. The boundaries of phase windows I and II were defined relative to the phase ϕ, where ϕ is the phase at which the slope of the low-gamma power distribution over theta phases (Fig. 2D, gray line) is most negative. Window I is defined as ϕ − 180° through ϕ − 60° and window II is defined as ϕ − 60° through ϕ + 60°, as shown in Figure 2E. Criteria 1–3 served to require adequate theta power and robust theta-gamma phase amplitude coupling. Criteria 4 and 5 served to choose only those channels in which the pattern of phase amplitude coupling matched the target pattern. To be included in the analysis, the data collected from a given channel must meet all of these criteria during the baseline trial and must meet criteria 1 for all trials. In the case that multiple channels met these criteria, the channel with the largest difference in mean standardized power between phase window I and II was chosen.
The inclusion criteria were designed to capture the specific pattern of theta-gamma phase amplitude coupling that was characteristic to the superficial layers of the MEC. While the anatomical specificity of this pattern is beyond the scope of this work, the histology and casual observation of the coexistence of this pattern with simultaneous recordings of layer II grid cells suggest that the pattern is most characteristic of layer II local field recordings. Notably, a theta phase reversal occurs around layer II (Mitchell and Ranck, 1980; Chrobak and Buzsáki, 1998) such that layer III is in-phase and layer I is out-of-phase with hippocampal area CA1 (Mizuseki et al., 2009). The theta-gamma coupling pattern of interest, as identified using the automatic selection approach described above, was observed on both sides of the phase reversal. The distribution of gamma power over theta phases, however, was likewise reversed. For example, as Figure 2C illustrates, low-gamma power was greatest on the ascending phase of theta (∼270 degrees) in layer III but was greatest on the descending phase of theta (∼90 degrees) in layer I. Thus, to aggregate phase amplitude histograms over recordings made on either side of the phase reversal, results of analyses performed on recordings in which the low-gamma power was greatest on the descending phase (layer I) were rotated by 180 degrees. Consequently, all references to theta phase in this article are in reference to layer III theta phase.
Spectral analyses.
Analyses of power and phase were performed using a wavelet-decomposition (Morlet; width 6). Spectral power analyses were done in the log-frequency log-power space to account for the 1/f relationship between power and frequency. That is, the frequency bands selected for computing power were logarithmically spaced between 5 and 125 Hz to minimize oversampling high frequencies. Likewise, power was quantified using the log10 transformation of the squared wavelet convolved signal. With respect to phase estimation, while the wavelet-based approach does not account for theta wave asymmetry, we found that results of the theta-gamma phase amplitude coupling analyses were not qualitatively different when phase was estimated from a waveform-based phase estimation approach as described previously (Belluscio et al., 2012).
Analysis of instantaneous theta frequency was also performed by using a wavelet analysis (Morlet wavelet; using width 8 to improve frequency resolution). To compute instantaneous frequency, the signal was decomposed into 49 bands spanning 4–10 Hz in 0.125 Hz increments. The band with the maximum power within this range at each time point was taken to reflect the instantaneous frequency. Any time points for which the maximum power occurred in a band below 6 Hz was labeled as having no significant theta. This method was preferable to estimating frequency as the inverse phase change over time as computed from the Hilbert transform of the bandpass filtered signal because the frequency estimates obtained with the method described here were more stable over time and remained within physiological range (i.e., no negative frequencies or infinite frequencies could result).
Phase amplitude coupling.
Analysis of phase amplitude coupling revolved around computing phase amplitude plots. The phase amplitude plot reflected the power distribution over theta phases of each of the 95 logarithmically spaced frequency bands, spanning 10–125 Hz. Theta phase was discretized into 36 bins spanning −π to π. Theta phase was calculated using a wavelet with a center frequency of 7.75 Hz and width 6, providing sensitivity over the 6–9 Hz bandwidth. Before computing the distribution of power over theta phases for a given trial, the raw time-varying power data for each frequency band was standardized to either the mean power of that trial or to the mean power of the baseline trial, as indicated in the text. Following the methods of Tort et al., 2010, raw power values were used instead of using the log-transformed values. Because electrodes could sit on either side of the phase reversal point in layer II MEC, the x-axis of the phase amplitude plots were rotated by 180 degrees for electrodes on which the peak 23 Hz power occurred between 0 and π radians during the baseline trial. Analyses of the theta phase of maximal gamma power used the phase bin with the largest amplitude value. This was used instead of a circular mean angle because two peaks in the distribution of gamma power over theta phases were commonly observed and the mean resulting angle rarely aligned with a phase with elevated power in these cases. Analyses of discrete bands (e.g., beta) were performed by first computing the distribution of power over theta phases for each of the full set of 95 frequency bands and then taking the mean over the relevant bands (12–20 Hz) as the power distribution for the discrete band.
Speed modulation of theta frequency.
The relationship between running speed and theta frequency was calculated by down sampling the instantaneous frequency and power estimates described above (with 250 Hz sampling) to match the 50 Hz sampling rate of the tracking data by keeping every fifth value. Following the methods of Jeewajee et al. (2008), we computed average frequency for each of 11 bins spanning 5–30 cm/s in 2.5 cm/s increments and computed the slope and intercept for a line fit to the binned data. The slope and intercept resulting from this regression were then compared across conditions.
Results
Here, we sought to characterize the effects of systemically administered scopolamine, a muscarinic antagonist, on the movement-induced theta and gamma rhythms recorded in the superficial layers of the MEC of freely moving rats. We were particularly interested in testing the hypothesis that scopolamine would change the distribution of gamma power over theta phases, differentially impacting the dynamics at the peak and trough of theta. We found that systemic scopolamine administration had significant effects on running behavior, spectral content, theta-gamma coupling, and the modulation of theta frequency by movement speed. These effects are described in turn here.
Behavioral shifts
Before scopolamine administration, animal behavior could be broadly categorized as falling into three conditions based on movement speed. Movement speeds of 4 cm/s or less were categorized as “minimal movement.” Minimal movement epochs accounted for an average of 30% of the duration of pre-scopolamine baseline trials (32% for pre-saline baseline). During these epochs, animals spent time eating rewards and grooming but also spent time orienting (e.g., rearing). Epochs of non-minimal movement (>4 cm/s) were comprised of two types of locomotion: moderate and fast. The distinction between these was based on a clear local minimum in the histogram of movement speeds ∼40 cm/s (Fig. 1C). Movements of 4–40 cm/s comprised the “moderate movement” condition, accounting for 54% of the duration of the pre-scopolamine baseline trials (54% for pre-saline baseline). Movements of >40 cm/s comprised the “fast movement” condition, accounting for 16% of the duration of the pre-scopolamine baseline trials (14% for pre-saline baseline).
Following scopolamine administration, we observed a sharp significant reduction in the amount of time animals moved faster than 40 cm/s as shown in Figure 1C (2.8% post- vs 15% pre-injection; t(5) = 3.6, p = 0.016). We did not observe a change in the amount of time spent generating minimal movements (30% post- vs 30% pre-injection; t(5) = 0.01, p = 0.99). Instead, the animals spent significantly more time moving at moderate speeds (68% post- vs 55% pre-injection; t(5) = 2.6, p = 0.047). To prevent the reduction in time spent running fast from introducing biases in our analyses, we focused our analyses on the minimal and moderate movement conditions for which plenty of data were available.
In the saline condition, animals trended toward spending more time moving 4 cm/s or less (39% post- vs 32% pre-injection; t(3) = 2.7, p = 0.076) and less time moving at moderate speeds (46% post- vs 55% pre-injection; t(3) = 4.5, p = 0.021). We did not observe a change in the amount of time spent running fast between the baseline and saline injection trials (15% post- vs 14% pre-injection; t(3) = 0.63, p = 0.57).
Muscarinic blockade induced spectral shifts
Before assessing the influence of muscarinic blockade on the interactions between theta and gamma bands, we sought to characterize the influences of scopolamine on the spectral content of the LFP. The spectra for the preinjection and injection trials for epochs of minimal and moderate movement speeds are shown in Figure 3, A and B, for the saline and scopolamine conditions, respectively. We discretized the broadband signal into four bands of interest: theta (6–9 Hz), beta (12–20 Hz), and two gamma sub-bands: low gamma (20–40 Hz) and high gamma (60–120 Hz). These gamma sub-bands were selected based on the results of the theta-gamma coupling analysis reported below.
During baseline trials, we observed movement-related increases in the power of the theta, beta, low-gamma, and high-gamma bands. That is, the power in these bands was greater during epochs of moderate movement than during epochs of minimal movement, as shown in Figure 3, A, B, and E (mean increase ± SE for theta: 0.25 ± 0.04 dB, t(5) = 6.5, p = 0.0012; beta: 0.25 ± 0.02 dB, t(5) = 15, p < 3e–5; low-gamma: 0.063 ± 0.02, t(5) = 4.1, p = 0.0096; high-gamma: 0.15 ± 0.04 dB, t(5) = 4.5, p = 0.0066).
During scopolamine trials, only high-gamma power was significantly reduced relative to the power observed during baseline trials as shown in Figure 3C (−0.14 ± 0.042 dB, t(5) = 3.7, p = 0.014). However, the robust movement-related increase in high-gamma power observed during baseline trials was not changed during scopolamine trials, as shown in Figure 3E (0.15 dB post- vs 0.15 dB pre-injection, t(5) = 0.17, p = 0.88). Examination of the change in mean high-gamma power between scopolamine and baseline trials separately for minimal and moderate movement epochs shows that both were equivalently reduced during scopolamine trials (Fig. 3D).
Importantly for the accurate estimation of theta phase in the analyses of theta-gamma coupling, theta power in scopolamine trials was similar to that observed during baseline trials (mean change between scopolamine and baseline trials was −0.061 ± 0.06 dB (t(5) = 1.1, p = 0.30; Fig. 3C). Likewise, movement-related increases in theta power remained stable between scopolamine and baseline trials (0.28 dB post- vs 0.25 dB pre-injection, t(5) = 0.70, p = 0.51; Fig. 3E). As such, a robust theta phase signal was equivalently available in both trial types.
Scopolamine had other influences on the LFP spectra that were less central to the primary goal of the paper, which, for the sake of completeness, are briefly mentioned here. The difference in 12–20 Hz beta power between minimal and moderate movement epochs decreased from 0.25 dB pre-injection to 0.11 dB post-injection (t(5) = 3.6, p = 0.016). This was the result of an increase in beta power during minimal movement epochs rather than a loss of power during moderate movement (Fig. 3D).
Multiple distinct gamma components were modulated by theta phase
We began our assessment of the interactions between theta and higher frequency bands by computing the comodulation (Tort et al., 2010) between 6 and 9 Hz theta and each of 95 logarithmically spaced bands spanning the 10–120 Hz range. Higher comodulation reflected a greater coupling between theta phase and the power of a particular frequency band. The plot of comodulation over frequencies revealed three distinct local maxima, as shown in Figure 4) A: a beta band, spanning 10–16 Hz; a low-gamma band, spanning 16–40 Hz; and a high gamma band, spanning 60–120 Hz.
To better understand the coupling between theta phase and the power in each of the higher frequency bands, we computed the power distribution over theta phases for each band. That is, for each frequency band, we computed the mean power in that band at each phase of theta, discretized into 36 phase bands. We then plotted the full set of power distributions as a false color map with theta phase along the x-axis and the frequency of the higher frequency bands plotted along the y-axis, as shown in Figure 4B. The color map shows pockets of warmer colors and cooler colors, reflecting frequency/phase combinations for which the power was above and below the mean, respectively. The pattern shown in Figure 4B reflects the average pattern over animals. To facilitate direct comparison of the pattern of phase amplitude coupling across frequencies, we standardized the power of each frequency band by the trial-wide mean power for that frequency band for the heat maps shown in Figure 4B, G, and H. This standardization facilitates identification of (1) changes in the theta phase at which maximal gamma power occurs over frequency bands and (2) changes in the phase at which gamma power for a particular band is maximal.
Examination of the mean phase amplitude plots over the baseline trials (Fig. 4B) revealed multiple distinct gamma components, each spanning a distinct frequency band corresponding to the peaks observed in the comodulation plot shown in Figure 4A. We focused our analyses on the low- and high-gamma bands. For the remainder of the analyses, we defined the bounds of the low-gamma band as 20–40 Hz to reduce potential contamination by the first harmonic of theta ∼16 Hz. High gamma was defined as 60–120 Hz to capture the window of maximal comodulation. The mean power distribution over theta phases for the high- and low-gamma bands are shown with confidence intervals, computed over animals, are shown in Figure 4, C and E, respectively. We describe each in turn.
Power in the 20–40 Hz low-gamma band was deeply modulated by theta phase (0.0030 ± 0.0008) and was maximal during the rising phase of theta (263° ± 14° where 0 and 360° mark the peak of theta; shown in Fig. 4B,E) during epochs of moderate movement. Low-gamma modulation increased significantly with increased running speed between the minimal and moderate movement epochs (mean increase was 0.0025 ± 0.0006, t(5) = 4.2, p = 0.0083). The phase of maximal low gamma showed a statistical trend toward occurring at earlier phases during moderate movement speeds relative to minimal movement speeds (mean shift was −32° ± 14°; 95% confidence limits = [−66° 1.7°]), shifting from 293° ± 33° during minimal movement epochs to 263° ± 14° during moderate movement epochs. This low-gamma component bares a strong resemblance to the low-gamma observed near the pyramidal layer of CA1 in mice (Chen et al., 2011) in that it occupies the same frequency band, is strongly modulated by theta phase with the maximal power aligning with the ascending phase of theta, and running speed modulates both the depth of modulation and phase of maximal power.
In the 60–120 Hz high-gamma band, robust modulation was observed (0.0040 ± 0.0015) in which the maximal power occurred just before the peak of theta (350° ± 9°; Fig. 4B,C). Consistent with the robust movement-induced high-gamma power increases described above, the depth of modulation increased significantly with faster running speeds (mean increase was 0.0021 ± 0.0006, t(5) = 3.7, p = 0.014). The phase of maximal high-gamma power, however, remained fixed between minimal movement epochs (14° ± 53°) and moderate movement epochs (348° ± 9°), yielding no significant effect of movement speed (mean shift was −26° ± 61°; 95% confidence limits = [−79° 29°]). The properties of this high-gamma component, including the frequency band, the phase of maximal power, the increased modulation during faster movements, and the stability of the phase of maximal power over running speeds resembles the high-gamma observed near the pyramidal layer of CA1 in mice (Chen et al., 2011).
Scopolamine selectively reduced peak-locked high-gamma power
During baseline trials, high-gamma (60–120 Hz) power was maximal at the peak of theta, the phase at which memory encoding is hypothesized to occur (Hasselmo et al., 2002; Easton et al., 2012). Because systemic administration of scopolamine has been shown to specifically interfere with memory encoding, we hypothesized that high gamma in particular would be impacted by scopolamine. Consistent with this hypothesis, high gamma was the only band to exhibit scopolamine-induced reductions in power, as described above. Yet, high-gamma power still increased significantly between the minimal and moderate movement epochs following scopolamine administration, suggesting that residual high gamma was present during scopolamine trials. This raised the question of whether this residual high gamma still occurred preferentially during the peak of theta, as had been observed during baseline trials. We sought to answer this question by comparing the distribution of high-gamma power over theta phases during epochs of moderate movement in the injection trials and contrasting them to the distribution observed in the baseline trial.
During scopolamine trials, the distribution of high-gamma power was changed from that observed during saline and baseline trials as shown in Figure 4C. While the power was reduced at all phases relative to the power distribution observed in the saline trial, the shape of the distribution was qualitatively changed. It is worth noting that for all of the line plots in Figure 4, the power was standardized to the mean power of the baseline trials to allow for comparison over trials. By this standardization, a value of one in Figure 4C or E would indicate that the mean power for a particular phase was equal to the mean baseline power, while a value of 0.6 would indicate that the power was 40% lower than the mean baseline power. In Figure 4D or F, a value of 0 reflects no change from the power observed at that phase in the baseline trial, and a value of −0.3 reflects a reduction in the power observed at that phase equal to 30% of the mean baseline power.
The phase of maximal power during scopolamine trials was significantly later than during baseline (mean shift was 75° ± 24°, n = 6, W-W test: F(1,10) = 13.95, p = 0.0039; 95% confidence limits = [37° ± 114°]). Specifically, the maximal high-gamma power shifted from the peak of theta (349° ± 9°) to the descending phase (63° ± 30°), as shown in Figure 4C. A subtraction of the baseline distribution (Fig. 4C, left) from the injection trial distributions for the saline and scopolamine conditions (Fig. 4C, right) demonstrates that high-gamma power was reduced more at the peak of theta than during the trough as shown in Figure 4D. The mean reduction in standardized power over the 180° phase window centered on the peak was −0.30 ± 0.055, whereas the mean reduction in the 180° window centered on the trough was −0.21 ± 0.040. As such, significantly more high-gamma power was lost during the peak of theta than during the trough (mean difference was −0.090 ± 0.023, t(5) = 4.3, p = 0.007).
In contrast, during saline trials, the distribution of high-gamma power did not differ from the distribution observed during baseline trials at any phase. The phase of maximal power was 340° ± 17° before the injection and 339° ± 21° following the injection (mean change was 1.0° ± 2.9°, n = 4, W-W test: F(1,6) = 0.0052, p = 0.94; 95% confidence limits = [−16° ± 18°]). No significant changes in power were observed between the baseline and injection trials during either the peak phase (mean change was 0.0080 ± 0 0.045, t(3) = 0.20, p = 0.85) or the trough phase (mean change was 0.0058 ± 0.032, t(3) = 0.20, p = 0.85). Accordingly, there was no difference in the power changes between the peak and trough following the saline injection (mean difference was 0.0023 ± 0.015, t(3) = 0.18, p = 0.87).
To better understand how the distribution of power changed over theta phases as a function of gamma frequency, we plotted the power distribution over theta phases for all bands in both the saline and scopolamine trials (Fig. 4G,H). Consistent with the changes in the high-gamma band during scopolamine trials, the distribution of power was shifted to later phases throughout the 60–120 Hz range, visible in Figure 4H as a rightward shift in the warmest colors throughout this band. The distribution of power over frequencies was not qualitatively different in the saline trial (Fig. 4, compare B, G). In both scopolamine and saline trials, the distribution of power throughout the 20–40 Hz range was qualitatively the same as was observed during baseline trials. To facilitate comparison of the power distributions over frequencies, the power in Figure 4B, G, and H was standardized to the mean of that particular trial instead of to the baseline trial mean. Thus, the mean of each row in these plots is one independent of shifts in mean power over trials thereby prohibiting direct comparison of absolute power over trials. However, these plots are well suited to demonstrating the phase at which the maximal power in each frequency band occurred. The phases of maximal power over frequencies for each trial type are summarized in Figure 4I. This figure shows that in both the baseline (green) and saline (blue) trials, the maximal power throughout the 60–120 Hz range occurs at the peak of theta. The peak power occurs at a later phase during scopolamine trials. The phase of maximal power for bands <40 Hz occurs at a similar rising phase for all trial types.
Although outside of the primary focus of this article, it is worth noting the apparent reduction in the modulation of 10–16 Hz frequency during the scopolamine trial (Fig. 4H). The reduced modulation of these bands may reflect reduced asymmetry in the theta wave following scopolamine administration.
Experience-dependent steepening of slope relating speed to theta frequency is dampened by scopolamine
Theta frequency has been repeatedly shown to depend upon running speed (Vanderwolf, 1969; Jeewajee et al., 2008; Hinman et al., 2011). Moreover, the rate at which theta frequency increases as running speed increases has been shown to depend upon familiarity of the testing enclosure (Wells et al., 2013). Because scopolamine is understood to reduce the capacity for encoding, we sought to test the effects of scopolamine administration on the relationship between theta frequency and running speed over trials.
First, we confirmed that theta frequency increased as a function of movement speed during baseline trials as shown by the darkest lines in Figure 5A and C. During pre-saline baseline trials, the slope was also positive (0.51 ± 0.42 Hz/m/s) but because of the low number of animals and the variance in slope over animals, the trend was not significant (t(3) = 1.4, p = 0.26). If, however, we computed the mean slope over all saline sessions, instead of on the average slope per animal, the slope was significant (0.92 ± 0.22 Hz/M/s, t(11) = 4.36, p = 0.001). During pre-scopolamine baseline trials, the mean slope was significantly positive both when computed over rats (0.91 ± 0.28 Hz/M/s, t(5) = 3.53, p = 0.017) and when computed over sessions (1.03 ± 0.16 Hz/M/s, t(14) = 6.72 p < 10e-6). The mean and SE of the slopes over rats is shown at the top of Figure 5B.
We then asked whether the slope relating theta frequency to running speed increased as a function experience with the testing enclosure over the course of the day as was reported previously (Wells et al., 2013). Here, we compared the slope observed during the baseline and recovery trials so as to avoid the first-order influences of scopolamine on the relationship between theta frequency and running speed. Instead, the hope was that measuring the change in the slope between the first and last trial of the session would reveal changes in the slope related to changes in familiarity of the animal with the testing enclosure. During the saline condition, we observed a significant increase in the slope from 0.51 Hz/m/s during the baseline trial to 1.30 Hz/m/s during the recovery session (mean increase was 0.79 ± 0.19, t(3) = 4.85, p = 0.017). This increase was not due to the weak relationship between theta frequency and running speed during the baseline trial as a robust increase was also observed when computed over sessions, for which the slope was already robustly significantly positive during the baseline trial (mean increase was 0.78 ± 0.14 Hz/m/s, t(11) = 5.77, p = 0.0001). Wells et al. (2013) demonstrated that such increases in the slope depend upon experience with a testing enclosure over the course of the day to increase familiarity (Burgess, 2008). Thus, the slope increases observed in the saline condition in the present study likely reflect increased familiarity with the testing enclosure rather than an effect of the saline injection itself.
Finally, we asked whether the magnitude of the slope increase between the baseline and recovery trials was changed by the administration of scopolamine during the injection trial in the scopolamine condition. Regardless of whether the change was computed over animal or session, the slope did not increase significantly between the baseline and recovery trials in the scopolamine condition (by rat: mean change was 0.34 ± 0.19 Hz/m/s, t(5) = 1.97, p = 0.11; by session: mean change was 0.20 ± 0.22, t(14) = 0.98, p = 0.35). The lack of a significant slope increase suggests that the familiarity of enclosure increased less following scopolamine administration, consistent with the understanding that scopolamine impairs novel encoding.
In relating theta frequency to running speed over trials, we observed a notable reduction in the speed modulation of theta frequency during the scopolamine trial, as shown in Figure 5B and C. Despite having shown a robust positive slope during the baseline trials, the slope dropped to virtually zero following scopolamine administration regardless of whether computed over rats (mean slope was 0.07 ± 0.34 Hz/m/s, t(5) = 0.22, p = 0.82) or sessions (mean slope was −0.14 ± 0.17, t(14) = 0.83, p = 0.42). Accordingly, the difference in slope between the injection trial and the baseline trial was significantly less than zero, both when computed over rats (mean slope change was −0.84 ± 0.36 Hz/m/s, t(5) = 2.6, p = 0.050) and when computed over sessions (mean slope change was −1.17 ± 0.22 Hz/m/s, t(14) = 5.6, p = 0.0001). This loss of speed modulation of theta frequency may reflect a desensitization to movement-related perceptual input (Shin, 2010; Tai et al., 2012). This influence of scopolamine on the speed modulation of theta frequency is particularly noteworthy in the context of existing models that suggest that such modulation is critical for the generation of the precise spatial tuning of grid cells (Burgess et al., 2007; Burgess, 2008; Jeewajee et al., 2008). The loss of such modulation predicts that the spatial tuning of grid cells may be reduced following scopolamine administration.
Casual inspection of the plots of theta frequency plotted as a function of running speed suggested that theta frequency differed from those observed during baseline trials particularly at lower running speeds. To explore this further, we compared the intercept derived from the regression of theta frequency versus running speed between the baseline and injection trials. As illustrated in the bottom of Figure 5B, the intercept was elevated during the scopolamine injection trial relative to that observed during the baseline trial. While this was not significant when computed over rats (mean change was 0.21 ± 0.18 Hz, t(5) = 1.34, p = 0.24), it was significant when computed over sessions (mean change was 0.34 ± 0.08 Hz, t(14) = 4.30, p = 0.0007). We did not observe a significant change in the intercept during the saline trials either while computing over rats (mean change was 0.01 ± 0.02 Hz, t(3) = 0.65, p = 0.56) or over sessions (mean change was 0.01 ± 0.04 Hz, t(11) = 0.32, p = 0.75). The work of Burgess (2008) and Wells et al. (2013) suggests that the intercept can vary independently from the slope and reflects the anxiety level of the animal. As such, the increased intercept observed here suggests that scopolamine had an anxiogenic effect, as observed previously following systemic administration (Rodgers and Cole, 1995; Smythe et al., 1996). The lack of such an effect during the saline sessions suggests that it was not the delivery of the intraperitoneal injection that might have increased the anxiety of the animals.
Discussion
In this study, we characterized the influences of muscarinic blockade on the large-scale neural activation dynamics of the MEC through analysis of the LFP. We report for the first time that multiple gamma bands could be observed (low: 20–40 Hz; and high: 60–120 Hz) and that muscarinic blockade reduced high-gamma power particularly strongly during the peak of theta. We also report for the first time that speed modulation of theta frequency is reduced following scopolamine administration and that the slope relating movement speed to theta frequency increased significantly less between the preinjection and recovery trials when scopolamine, but not when saline, was administered during the injection session. Combined with the extensive data showing that scopolamine impairs encoding, but not retrieval, these results are consistent with computational models suggesting that encoding occurs during the peak of theta and support the theory that acetylcholine regulates the balance between encoding versus retrieval.
Cholinergic modulation of encoding and retrieval
Behavioral studies in humans and rats demonstrate that acetylcholine plays an important role in healthy memory encoding but not retrieval (Ghoneim and Mewaldt, 1977; Petersen, 1977; Broks et al., 1988; Atri et al., 2004). Cholinergic dysfunction may contribute to the memory deficits observed in elderly individuals and Alzheimer's patients (Bartus et al., 1982; Coyle et al., 1983; Gallagher and Colombo, 1995; Contestabile, 2011; Craig et al., 2011). At a systems level, acetylcholine promotes encoding through modulation of cellular and network physiology (Hasselmo and Sarter, 2011; Newman et al., 2012). Acetylcholine suppresses the strength of intrinsic excitatory projections relative to afferent excitatory projections and decreases the threshold at which LTP is induced (Hasselmo, 1999). Input to CA1 from entorhinal cortex layer III (ECIII) arrives around the peak of theta as measured in the CA1 pyramidal layer (CA1pyr) (Buzsáki et al., 1986; Brankack et al., 1993; Bragin et al., 1995), roughly corresponding to the peak of theta recorded in ECIII (Mizuseki et al., 2009). During the same phase, LTP is most readily induced at the Schaffer collaterals (Huerta and Lisman, 1993; Hyman et al., 2003). The coincidence of arrival from ECIII and facilitated LTP during the peak of theta led to the hypothesis that encoding occurs preferentially during the peak of theta (Hasselmo et al., 2002; Easton et al., 2012). Thus, the reduction in gamma at the peak of theta, observed here, may mark the reduction of the large-scale activation dynamics related to encoding. Indeed, reduced theta-gamma coupling was recently identified as a potential biomarker of early onset Alzheimer's after it was demonstrated that such modulation was reduced months before the pathological buildup of aBeta42 in the TgCRND8 mouse model of the disease (Goutagny et al., 2013).
Research on theta phase locking of hippocampal CA1 principal cells supports the hypothesis that encoding and retrieval occur during the peak and trough of theta, respectively. Most relevantly, Douchamps et al. (2013) explored the preferred theta phase of place cells in novel versus familiar testing enclosures and the influence of scopolamine on that phase. As observed here, muscarinic blockade shifted the preferred phase of firing closer to the trough. They also found that manipulations that increased novelty shifted the preferred phase closer to the peak of theta (Manns et al., 2007; Lever et al., 2010). However, the shift toward the trough following muscarinic blockade observed by Douchamps et al. (2013) was generated by a shift to earlier phases, instead of later phases as we observed. We speculate that this difference may reflect a difference in the processing dynamics of the superficial layers of the MEC versus hippocampal area CA1.
Multiple distinct gamma components of the MEC
Consistent with previous reports, we observed clear theta modulation of gamma in the MEC (Chrobak and Buzsáki, 1998; Colgin et al., 2009; Quilichini et al., 2010; Pastoll et al., 2013). In our analysis, we identified multiple distinct theta modulated frequency bands, each showing maximal power at a distinct phase of theta. These bands included a rising phase-locked low-gamma (20–40 Hz) component and a high-gamma (60–110 Hz) component with maximal amplitude near the peak of theta. Following scopolamine administration, the distribution of high-gamma power was shifted to peak at later phases, while no change in the distribution of low-gamma power over theta phases was observed (Fig. 4).
A promising interpretation of distinct phase-locked gamma components is that each component reflects the arrival of input from distinct populations (Dickson and de Curtis, 2002; Buschman and Miller, 2007; Colgin et al., 2009). In hippocampal area CA1, for example, two gamma components can be seen, reflecting input from either the entorhinal cortex or area CA3 (Colgin et al., 2009). In monkey cortex, similarly, multiple gamma components are identifiable; the power of each varying as the monkey shifted between top-down and bottom-up processing strategies (Buschman and Miller, 2007). In each case, the central frequency of each gamma differed based on the anatomical origin of the input, likely due to the specific cell types that reverberate given driving input (Buzsáki and Wang, 2012). Thus, caution should be used in interpreting a gamma component as the “same gamma” as was observed in another brain area. Instead, gamma bands observed in our data likely reflect the distinct inputs that project into the superficial layers of the entorhinal cortex.
Muscarinic influences on theta frequency
Based on the loss of the speed modulation of theta frequency following scopolamine administration observed here, we suggest that such speed modulation may be related to type II atropine-sensitive theta. Theta rhythms are historically categorized into two types: atropine-resistant type I and atropine-sensitive type II theta (Kramis et al., 1975). Whereas type I theta is only elicited during epochs of movement and persists after systemic administration of atropine (a muscarinic antagonist, like scopolamine), type II can be elicited during epochs of minimal movement by presentation of stimuli that increase arousal or anxiety (Sainsbury et al., 1987). While movement speed is a well recognized correlate of theta frequency (Vanderwolf, 1969), the sensitivity of this correlation to muscarinic blockade has remained unclear as both type I and type II theta are present during locomotion (Vanderwolf, 1969; Vanderwolf et al., 1985). Here, theta power increased similarly during scopolamine and baseline trials, consistent with the expected preservation of type I theta. However, the frequency of this “atropine-resistant” theta no longer varied with running speed, suggesting that the speed modulation of frequency may be a property of “atropine-sensitive” type II theta.
The sensorimotor integration hypothesis of theta (Bland and Oddie, 2001) suggests that type II theta is the hippocampal response to sensory input. Our observation that speed modulation of theta frequency is a property of type II theta would, by this hypothesis, imply that sensory input drives the speed modulation of theta frequency. As animals run faster, more sensory information becomes available per unit time driving theta to a higher frequency. Mechanistically, we speculate that scopolamine may reduce this modulation by blocking the sensitizing effects of endogenous acetylcholine on sensory cortices, resulting in a large-scale decrease of the signal-to-noise and activity level in sensory cortices (Metherate et al., 1988; Herrero et al., 2008; Shin, 2010; Tai et al., 2012).
In a related theoretical framework described by Burgess (2008), the intercept of the plot of movement speed versus theta frequency was suggested to be shaped by type II theta, reflecting arousal or anxiety level and the slope was suggested to be governed by type I theta, reflecting familiarity. While the present results challenge the prediction that the slope is governed by atropine-resistant physiological processes, strong empirical support exists for the anxiety and familiarity interpretations of the intercept and slope, respectively (Wells et al., 2013). We suggest that the anxiety/familiarity framework is compatible with the sensorimotor hypothesis as follows: increased experience (familiarity) with an environment could increase perceptual fluency, which, in turn, would increase sensory drive of theta frequency at a given running speed. Likewise, it may be that increased arousal or anxiety increases the level of perceptual processing at any speed and would thus increase the intercept, independent of the slope.
Summary
We tested the hypothesis that muscarinic blockade would preferentially block the large-scale neural activation dynamics that are predictive of memory encoding. Consistent with this hypothesis, gamma locked to the peak of theta rhythm was reduced following systemic scopolamine administration. We also observed a significant reduction in the experience-dependent steepening of the slope relating movement speed to theta frequency, suggesting that scopolamine reduced encoding of experience with the testing enclosure. These data support the hypotheses that acetylcholine promotes encoding-related neural processing dynamics and that encoding-related dynamics occur preferentially during the peak of theta (as recorded in the CA1 pyramidal layer or layer III MEC). Further, we demonstrated for the first time that multiple distinct gamma bands exist in the superficial layers of MEC and that speed modulation of theta frequency is sensitive to muscarinic blockade.
Footnotes
This work was supported by National Institute of Mental Health F32MH090671, R01MH60013, and R01MH61492, and the Office of Naval Research Multidisciplinary University Research Initiative award N00014-10-1-0936. We also thank Andrew Bogaard for his work building, supporting, and maintaining the CMBHOME in vivo data MATLAB analysis toolbox.
The authors declare no competing financial interests.
References
- Adams SV, Winterer J, Müller W. Muscarinic signaling is required for spike-pairing induction of long-term potentiation at rat Schaffer collateral-CA1 synapses. Hippocampus. 2004;14:413–416. doi: 10.1002/hipo.10197. [DOI] [PubMed] [Google Scholar]
- Addante RJ, Watrous AJ, Yonelinas AP, Ekstrom AD, Ranganath C. Prestimulus theta activity predicts correct source memory retrieval. Proc Natl Acad Sci U S A. 2011;108:10702–10707. doi: 10.1073/pnas.1014528108. [DOI] [PMC free article] [PubMed] [Google Scholar]
- Atri A, Sherman S, Norman KA, Kirchhoff BA, Nicolas MM, Greicius MD, Cramer SC, Breiter HC, Hasselmo ME, Stern CE. Blockade of central cholinergic receptors impairs new learning and increases proactive interference in a word paired-associate memory task. Behav Neurosci. 2004;118:223–236. doi: 10.1037/0735-7044.118.1.223. [DOI] [PubMed] [Google Scholar]
- Bartus RT, Dean RL, 3rd, Beer B, Lippa AS. The cholinergic hypothesis of geriatric memory dysfunction. Science. 1982;217:408–414. doi: 10.1126/science.7046051. [DOI] [PubMed] [Google Scholar]
- Belluscio MA, Mizuseki K, Schmidt R, Kempter R, Buzsáki G. Cross-frequency phase-phase coupling between θ and γ oscillations in the hippocampus. J Neurosci. 2012;32:423–435. doi: 10.1523/JNEUROSCI.4122-11.2012. [DOI] [PMC free article] [PubMed] [Google Scholar]
- Berens P. CircStat: a MATLAB toolbox for circular statistics. J Statistical Software. 2009:31. [Google Scholar]
- Bland BH, Oddie SD. Theta band oscillation and synchrony in the hippocampal formation and associated structures: the case for its role in sensorimotor integration. Behav Brain Res. 2001;127:119–136. doi: 10.1016/S0166-4328(01)00358-8. [DOI] [PubMed] [Google Scholar]
- Blitzer RD, Gil O, Landau EM. Cholinergic stimulation enhances long-term potentiation in the CA1 region of rat hippocampus. Neurosci Lett. 1990;119:207–210. doi: 10.1016/0304-3940(90)90835-W. [DOI] [PubMed] [Google Scholar]
- Bragin A, Jandó G, Nádasdy Z, Hetke J, Wise K, Buzsáki G. Gamma (40–100 Hz) oscillation in the hippocampus of the behaving rat. J Neurosci. 1995;15:47–60. doi: 10.1523/JNEUROSCI.15-01-00047.1995. [DOI] [PMC free article] [PubMed] [Google Scholar]
- Brankack J, Stewart M, Fox SE. Current source density analysis of the hippocampal theta rhythm: associated sustained potentials and candidate synaptic generators. Brain Res. 1993;615:310–327. doi: 10.1016/0006-8993(93)90043-M. [DOI] [PubMed] [Google Scholar]
- Broks P, Preston GC, Traub M, Poppleton P, Ward C, Stahl SM. Modelling dementia: effects of scopolamine on memory and attention. Neuropsychologia. 1988;26:685–700. doi: 10.1016/0028-3932(88)90004-8. [DOI] [PubMed] [Google Scholar]
- Burgess N. Grid cells and theta as oscillatory interference: theory and predictions. Hippocampus. 2008;18:1157–1174. doi: 10.1002/hipo.20518. [DOI] [PMC free article] [PubMed] [Google Scholar]
- Burgess N, Barry C, O'Keefe J. An oscillatory interference model of grid cell firing. Hippocampus. 2007;17:801–812. doi: 10.1002/hipo.20327. [DOI] [PMC free article] [PubMed] [Google Scholar]
- Buschman TJ, Miller EK. Top-down versus bottom-up control of attention in the prefrontal and posterior parietal cortices. Science. 2007;315:1860–1862. doi: 10.1126/science.1138071. [DOI] [PubMed] [Google Scholar]
- Buzsáki G. Theta oscillations in the hippocampus. Neuron. 2002;33:325–340. doi: 10.1016/S0896-6273(02)00586-X. [DOI] [PubMed] [Google Scholar]
- Buzsáki G, Wang XJ. Mechanisms of gamma oscillations. Annu Rev Neurosci. 2012;35:203–225. doi: 10.1146/annurev-neuro-062111-150444. [DOI] [PMC free article] [PubMed] [Google Scholar]
- Buzsáki G, Czopf J, Kondákor I, Kellényi L. Laminar distribution of hippocampal rhythmic slow activity (RSA) in the behaving rat: current-source density analysis, effects of urethane and atropine. Brain Res. 1986;365:125–137. doi: 10.1016/0006-8993(86)90729-8. [DOI] [PubMed] [Google Scholar]
- Charpak S, Paré D, Llinás R. The entorhinal cortex entrains fast CA1 hippocampal oscillations in the anaesthetized guinea-pig: role of the monosynaptic component of the perforant path. Eur J Neurosci. 1995;7:1548–1557. doi: 10.1111/j.1460-9568.1995.tb01150.x. [DOI] [PubMed] [Google Scholar]
- Chen Z, Resnik E, McFarland JM, Sakmann B, Mehta MR. Speed controls the amplitude and timing of the hippocampal gamma rhythm. PLoS One. 2011;6:e21408. doi: 10.1371/journal.pone.0021408. [DOI] [PMC free article] [PubMed] [Google Scholar]
- Chrobak JJ, Buzsáki G. Gamma oscillations in the entorhinal cortex of the freely behaving rat. J Neurosci. 1998;18:388–398. doi: 10.1523/JNEUROSCI.18-01-00388.1998. [DOI] [PMC free article] [PubMed] [Google Scholar]
- Cole AE, Nicoll RA. The pharmacology of cholinergic excitatory responses in hippocampal pyramidal cells. Brain Res. 1984;305:283–290. doi: 10.1016/0006-8993(84)90434-7. [DOI] [PubMed] [Google Scholar]
- Colgin LL, Denninger T, Fyhn M, Hafting T, Bonnevie T, Jensen O, Moser MB, Moser EI. Frequency of gamma oscillations routes flow of information in the hippocampus. Nature. 2009;462:353–357. doi: 10.1038/nature08573. [DOI] [PubMed] [Google Scholar]
- Contestabile A. The history of the cholinergic hypothesis. Behav Brain Res. 2011;221:334–340. doi: 10.1016/j.bbr.2009.12.044. [DOI] [PubMed] [Google Scholar]
- Cousineau D. Confidence intervals in within-subject designs: a simpler solution to Loftus and Masson's method. Tutorials in Quantitative Methods for Psychology. 2005;1:42–45. [Google Scholar]
- Coyle JT, Price DL, DeLong MR. Alzheimer's disease: a disorder of cortical cholinergic innervation. Science. 1983;219:1184–1190. doi: 10.1126/science.6338589. [DOI] [PubMed] [Google Scholar]
- Craig LA, Hong NS, McDonald RJ. Revisiting the cholinergic hypothesis in the development of Alzheimer's disease. Neurosci Biobehav Rev. 2011;35:1397–1409. doi: 10.1016/j.neubiorev.2011.03.001. [DOI] [PubMed] [Google Scholar]
- Dickson CT, de Curtis M. Enhancement of temporal and spatial synchronization of entorhinal gamma activity by phase reset. Hippocampus. 2002;12:447–456. doi: 10.1002/hipo.10013. [DOI] [PubMed] [Google Scholar]
- Douchamps V, Jeewajee A, Blundell P, Burgess N, Lever C. Evidence for encoding versus retrieval scheduling in the hippocampus by theta phase and acetylcholine. J Neurosci. 2013;33:8689–8704. doi: 10.1523/JNEUROSCI.4483-12.2013. [DOI] [PMC free article] [PubMed] [Google Scholar]
- Easton A, Douchamps V, Eacott M, Lever C. A specific role for septohippocampal acetylcholine in memory? Neuropsychologia. 2012;50:3156–3168. doi: 10.1016/j.neuropsychologia.2012.07.022. [DOI] [PMC free article] [PubMed] [Google Scholar]
- Eichenbaum H, Lipton PA. Towards a functional organization of the medial temporal lobe memory system: role of the parahippocampal and medial entorhinal cortical areas. Hippocampus. 2008;18:1314–1324. doi: 10.1002/hipo.20500. [DOI] [PMC free article] [PubMed] [Google Scholar]
- Fisher NI. Statistical analysis of circular data. Cambridge, UK: Cambridge UP; 1996. p. 277. [Google Scholar]
- Gallagher M, Colombo PJ. Ageing: the cholinergic hypothesis of cognitive decline. Curr Opin Neurobiol. 1995;5:161–168. doi: 10.1016/0959-4388(95)80022-0. [DOI] [PubMed] [Google Scholar]
- Ghoneim MM, Mewaldt SP. Studies on human memory: the interactions of diazepam, scopolamine, and physostigmine. Psychopharmacology. 1977;52:1–6. doi: 10.1007/BF00426592. [DOI] [PubMed] [Google Scholar]
- Gil Z, Connors BW, Amitai Y. Differential regulation of neocortical synapses by neuromodulators and activity. Neuron. 1997;19:679–686. doi: 10.1016/S0896-6273(00)80380-3. [DOI] [PubMed] [Google Scholar]
- Givens B, Olton DS. Local modulation of basal forebrain: effects on working and reference memory. J Neurosci. 1994;14:3578–3587. doi: 10.1523/JNEUROSCI.14-06-03578.1994. [DOI] [PMC free article] [PubMed] [Google Scholar]
- Goutagny R, Gu N, Cavanagh C, Jackson J, Chabot JG, Quirion R, Krantic S, Williams S. Alterations in hippocampal network oscillations and theta-gamma coupling arise before Aβ overproduction in a mouse model of Alzheimer's disease. Eur J Neurosci. 2013;37:1896–1902. doi: 10.1111/ejn.12233. [DOI] [PubMed] [Google Scholar]
- Gruber MJ, Watrous AJ, Ekstrom AD, Ranganath C, Otten LJ. Expected reward modulates encoding-related theta activity before an event. Neuroimage. 2013;64:68–74. doi: 10.1016/j.neuroimage.2012.07.064. [DOI] [PMC free article] [PubMed] [Google Scholar]
- Hasselmo ME. Neuromodulation: acetylcholine and memory consolidation. Trends Cogn Sci. 1999;3:351–359. doi: 10.1016/S1364-6613(99)01365-0. [DOI] [PubMed] [Google Scholar]
- Hasselmo ME. What is the function of hippocampal theta rhythm?–Linking behavioral data to phasic properties of field potential and unit recording data. Hippocampus. 2005;15:936–949. doi: 10.1002/hipo.20116. [DOI] [PubMed] [Google Scholar]
- Hasselmo ME. The role of acetylcholine in learning and memory. Curr Opin Neurobiol. 2006;16:710–715. doi: 10.1016/j.conb.2006.09.002. [DOI] [PMC free article] [PubMed] [Google Scholar]
- Hasselmo ME, Bower JM. Cholinergic suppression specific to intrinsic not afferent fiber synapses in rat piriform (olfactory) cortex. J Neurophysiol. 1992;67:1222–1229. doi: 10.1152/jn.1992.67.5.1222. [DOI] [PubMed] [Google Scholar]
- Hasselmo ME, Eichenbaum H. Hippocampal mechanisms for the context-dependent retrieval of episodes. Neural Netw. 2005;18:1172–1190. doi: 10.1016/j.neunet.2005.08.007. [DOI] [PMC free article] [PubMed] [Google Scholar]
- Hasselmo ME, Sarter M. Modes and models of forebrain cholinergic neuromodulation of cognition. Neuropsychopharmacology. 2011;36:52–73. doi: 10.1038/npp.2010.104. [DOI] [PMC free article] [PubMed] [Google Scholar]
- Hasselmo ME, Schnell E. Laminar selectivity of the cholinergic suppression of synaptic transmission in rat hippocampal region CA1: computational modeling and brain slice physiology. J Neurosci. 1994;14:3898–3914. doi: 10.1523/JNEUROSCI.14-06-03898.1994. [DOI] [PMC free article] [PubMed] [Google Scholar]
- Hasselmo ME, Schnell E, Barkai E. Dynamics of learning and recall at excitatory recurrent synapses and cholinergic modulation in rat hippocampal region CA3. J Neurosci. 1995;15:5249–5262. doi: 10.1523/JNEUROSCI.15-07-05249.1995. [DOI] [PMC free article] [PubMed] [Google Scholar]
- Hasselmo ME, Bodelón C, Wyble BP. A proposed function for hippocampal theta rhythm: separate phases of encoding and retrieval enhance reversal of prior learning. Neural Comput. 2002;14:793–817. doi: 10.1162/089976602317318965. [DOI] [PubMed] [Google Scholar]
- Herrero JL, Roberts MJ, Delicato LS, Gieselmann MA, Dayan P, Thiele A. Acetylcholine contributes through muscarinic receptors to attentional modulation in V1. Nature. 2008;454:1110–1114. doi: 10.1038/nature07141. [DOI] [PMC free article] [PubMed] [Google Scholar]
- Hinman JR, Penley SC, Long LL, Escabí MA, Chrobak JJ. Septotemporal variation in dynamics of theta: speed and habituation. J Neurophysiol. 2011;105:2675–2686. doi: 10.1152/jn.00837.2010. [DOI] [PubMed] [Google Scholar]
- Huerta PT, Lisman JE. Heightened synaptic plasticity of hippocampal CA1 neurons during a cholinergically induced rhythmic state. Nature. 1993;364:723–725. doi: 10.1038/364723a0. [DOI] [PubMed] [Google Scholar]
- Huerta PT, Lisman JE. Low-frequency stimulation at the troughs of theta-oscillation induces long-term depression of previously potentiated CA1 synapses. J Neurophysiol. 1996;75:877–884. doi: 10.1152/jn.1996.75.2.877. [DOI] [PubMed] [Google Scholar]
- Hyman JM, Wyble BP, Goyal V, Rossi CA, Hasselmo ME. Stimulation in hippocampal region CA1 in behaving rats yields long-term potentiation when delivered to the peak of theta and long-term depression when delivered to the trough. J Neurosci. 2003;23:11725–11731. doi: 10.1523/JNEUROSCI.23-37-11725.2003. [DOI] [PMC free article] [PubMed] [Google Scholar]
- Jeewajee A, Barry C, O'Keefe J, Burgess N. Grid cells and theta as oscillatory interference: electrophysiological data from freely moving rats. Hippocampus. 2008;18:1175–1185. doi: 10.1002/hipo.20510. [DOI] [PMC free article] [PubMed] [Google Scholar]
- Jutras MJ, Buffalo EA. Synchronous neural activity and memory formation. Curr Opin Neurobiol. 2010;20:150–155. doi: 10.1016/j.conb.2010.02.006. [DOI] [PMC free article] [PubMed] [Google Scholar]
- Kramis R, Vanderwolf CH, Bland BH. Two types of hippocampal rhythmical slow activity in both the rabbit and the rat: relations to behavior and effects of atropine, diethyl ether, urethane, and pentobarbital. Exp Neurol. 1975;49:58–85. doi: 10.1016/0014-4886(75)90195-8. [DOI] [PubMed] [Google Scholar]
- Lever C, Burton S, Jeewajee A, Wills TJ, Cacucci F, Burgess N, O'Keefe J. Environmental novelty elicits a later theta phase of firing in CA1 but not subiculum. Hippocampus. 2010;20:229–234. doi: 10.1002/hipo.20671. [DOI] [PMC free article] [PubMed] [Google Scholar]
- Lundqvist M, Herman P, Lansner A. Theta and gamma power increases and alpha/beta power decreases with memory load in an attractor network model. J Cogn Neurosci. 2011;23:3008–3020. doi: 10.1162/jocn_a_00029. [DOI] [PubMed] [Google Scholar]
- Manns JR, Zilli EA, Ong KC, Hasselmo ME, Eichenbaum H. Hippocampal CA1 spiking during encoding and retrieval: relation to theta phase. Neurobiol Learn Mem. 2007;87:9–20. doi: 10.1016/j.nlm.2006.05.007. [DOI] [PubMed] [Google Scholar]
- McNaughton BL, Barnes CA, Gerrard JL, Gothard K, Jung MW, Knierim JJ, Kudrimoti H, Qin Y, Skaggs WE, Suster M, Weaver KL. Deciphering the hippocampal polyglot: the hippocampus as a path integration system. J Exp Biol. 1996;199:173–185. doi: 10.1242/jeb.199.1.173. [DOI] [PubMed] [Google Scholar]
- Metherate R, Tremblay N, Dykes RW. The effects of acetylcholine on response properties of cat somatosensory cortical neurons. J Neurophysiol. 1988;59:1231–1252. doi: 10.1152/jn.1988.59.4.1231. [DOI] [PubMed] [Google Scholar]
- Mitchell SJ, Ranck JB., Jr Generation of theta rhythm in medial entorhinal cortex of freely moving rats. Brain Res. 1980;189:49–66. doi: 10.1016/0006-8993(80)90006-2. [DOI] [PubMed] [Google Scholar]
- Mitchell SJ, Rawlins JN, Steward O, Olton DS. Medial septal area lesions disrupt theta rhythm and cholinergic staining in medial entorhinal cortex and produce impaired radial arm maze behavior in rats. J Neurosci. 1982;2:292–302. doi: 10.1523/JNEUROSCI.02-03-00292.1982. [DOI] [PMC free article] [PubMed] [Google Scholar]
- Mizumori SJ, Perez GM, Alvarado MC, Barnes CA, McNaughton BL. Reversible inactivation of the medial septum differentially affects two forms of learning in rats. Brain Res. 1990;528:12–20. doi: 10.1016/0006-8993(90)90188-H. [DOI] [PubMed] [Google Scholar]
- Mizuseki K, Sirota A, Pastalkova E, Buzsáki G. Theta oscillations provide temporal windows for local circuit computation in the entorhinal-hippocampal loop. Neuron. 2009;64:267–280. doi: 10.1016/j.neuron.2009.08.037. [DOI] [PMC free article] [PubMed] [Google Scholar]
- Newman EL, Gupta K, Climer JR, Monaghan CK, Hasselmo ME. Cholinergic modulation of cognitive processing: insights drawn from computational models. Front Behav Neurosci. 2012;6:24. doi: 10.3389/fnbeh.2012.00024. [DOI] [PMC free article] [PubMed] [Google Scholar]
- O'Reilly RC, Bhattacharyya R, Howard MD, Ketz N. Complementary learning systems. Cogn Sci. 2011 doi: 10.1111/j.1551-6709.2011.01214.x. doi: 10.1111/j.1551-6709.2011.01214.x. Advance online publication. Retrieved Nov. 15, 2013. [DOI] [PubMed] [Google Scholar]
- Osipova D, Takashima A, Oostenveld R, Fernández G, Maris E, Jensen O. Theta and gamma oscillations predict encoding and retrieval of declarative memory. J Neurosci. 2006;26:7523–7531. doi: 10.1523/JNEUROSCI.1948-06.2006. [DOI] [PMC free article] [PubMed] [Google Scholar]
- Pastoll H, Solanka L, van Rossum MC, Nolan MF. Feedback inhibition enables theta-nested gamma oscillations and grid firing fields. Neuron. 2013;77:141–154. doi: 10.1016/j.neuron.2012.11.032. [DOI] [PubMed] [Google Scholar]
- Petersen RC. Scopolamine induced learning failures in man. Psychopharmacology. 1977;52:283–289. doi: 10.1007/BF00426713. [DOI] [PubMed] [Google Scholar]
- Pitler TA, Alger BE. Cholinergic excitation of GABAergic interneurons in the rat hippocampal slice. J Physiol. 1992;450:127–142. doi: 10.1113/jphysiol.1992.sp019119. [DOI] [PMC free article] [PubMed] [Google Scholar]
- Quilichini P, Sirota A, Buzsáki G. Intrinsic circuit organization and theta-gamma oscillation dynamics in the entorhinal cortex of the rat. J Neurosci. 2010;30:11128–11142. doi: 10.1523/JNEUROSCI.1327-10.2010. [DOI] [PMC free article] [PubMed] [Google Scholar]
- Rodgers RJ, Cole JC. Effects of scopolamine and its quaternary analogue in the murine elevated plus-maze test of anxiety. Behav Pharmacol. 1995;6:283–289. [PubMed] [Google Scholar]
- Sainsbury RS, Heynen A, Montoya CP. Behavioral correlates of hippocampal type 2 theta in the rat. Physiol Behav. 1987;39:513–519. doi: 10.1016/0031-9384(87)90382-9. [DOI] [PubMed] [Google Scholar]
- Sederberg PB, Kahana MJ, Howard MW, Donner EJ, Madsen JR. Theta and gamma oscillations during encoding predict subsequent recall. J Neurosci. 2003;23:10809–10814. doi: 10.1523/JNEUROSCI.23-34-10809.2003. [DOI] [PMC free article] [PubMed] [Google Scholar]
- Sederberg PB, Schulze-Bonhage A, Madsen JR, Bromfield EB, Litt B, Brandt A, Kahana MJ. Gamma oscillations distinguish true from false memories. Psychol Sci. 2007;18:927–932. doi: 10.1111/j.1467-9280.2007.02003.x. [DOI] [PMC free article] [PubMed] [Google Scholar]
- Shin J. Passive rotation-induced theta rhythm and orientation homeostasis response. Synapse. 2010;64:409–415. doi: 10.1002/syn.20742. [DOI] [PubMed] [Google Scholar]
- Smythe JW, Murphy D, Bhatnagar S, Timothy C, Costall B. Muscarinic antagonists are anxiogenic in rats tested in the black-white box. Pharmacol Biochem Behav. 1996;54:57–63. doi: 10.1016/0091-3057(95)02130-2. [DOI] [PubMed] [Google Scholar]
- Steffenach HA, Witter M, Moser MB, Moser EI. Spatial memory in the rat requires the dorsolateral band of the entorhinal cortex. Neuron. 2005;45:301–313. doi: 10.1016/j.neuron.2004.12.044. [DOI] [PubMed] [Google Scholar]
- Tai SK, Ma J, Ossenkopp KP, Leung LS. Activation of immobility-related hippocampal theta by cholinergic septohippocampal neurons during vestibular stimulation. Hippocampus. 2012;22:914–925. doi: 10.1002/hipo.20955. [DOI] [PubMed] [Google Scholar]
- Tort AB, Kramer MA, Thorn C, Gibson DJ, Kubota Y, Graybiel AM, Kopell NJ. Dynamic cross-frequency couplings of local field potential oscillations in rat striatum and hippocampus during performance of a T-maze task. Proc Natl Acad Sci U S A. 2008;105:20517–20522. doi: 10.1073/pnas.0810524105. [DOI] [PMC free article] [PubMed] [Google Scholar]
- Tort AB, Komorowski RW, Manns JR, Kopell NJ, Eichenbaum H. Theta-gamma coupling increases during the learning of item-context associations. Proc Natl Acad Sci U S A. 2009;106:20942–20947. doi: 10.1073/pnas.0911331106. [DOI] [PMC free article] [PubMed] [Google Scholar]
- Tort AB, Komorowski R, Eichenbaum H, Kopell N. Measuring phase-amplitude coupling between neuronal oscillations of different frequencies. J Neurophysiol. 2010;104:1195–1210. doi: 10.1152/jn.00106.2010. [DOI] [PMC free article] [PubMed] [Google Scholar]
- Vanderwolf CH. Hippocampal electrical activity and voluntary movement in the rat. Electroencephalogr Clin Neurophysiol. 1969;26:407–418. doi: 10.1016/0013-4694(69)90092-3. [DOI] [PubMed] [Google Scholar]
- Vanderwolf CH, Leung LW, Cooley RK. Pathways through cingulate, neo- and entorhinal cortices mediate atropine-resistant hippocampal rhythmical slow activity. Brain Res. 1985;347:58–73. doi: 10.1016/0006-8993(85)90889-3. [DOI] [PubMed] [Google Scholar]
- Wells CE, Amos DP, Jeewajee A, Douchamps V, Rodgers J, O'Keefe J, Burgess N, Lever C. Novelty and anxiolytic drugs dissociate two components of hippocampal theta in behaving rats. J Neurosci. 2013;33:8650–8667. doi: 10.1523/JNEUROSCI.5040-12.2013. [DOI] [PMC free article] [PubMed] [Google Scholar]
- Winson J. Loss of hippocampal theta rhythm results in spatial memory deficit in the rat. Science. 1978;201:160–163. doi: 10.1126/science.663646. [DOI] [PubMed] [Google Scholar]