

Abstract
Humans with Down syndrome (DS) and Ts65Dn mice both show a reduced volume of the cerebellum due to a significant reduction in the density of granule neurons. Recently, cerebellar hypoplasia in Ts65Dn mice was rescued by a single treatment with SAG, an agonist of the Sonic hedgehog pathway, administered on the day of birth. In addition to normalizing cerebellar morphology, this treatment restored the ability to learn a spatial navigation task, which is associated with hippocampal function. It is not clear to what extent this improved performance results from restoration of the cerebellar architecture or a yet undefined role of Sonic hedgehog (Shh) in perinatal hippocampal development. The absence of a clearly demonstrated deficit in cerebellar function in trisomic mice exacerbates the problem of discerning how SAG acts to improve learning and memory. Here we show that phase reversal adaptation and consolidation of the vestibulo-ocular reflex is significantly impaired in Ts65Dn mice, providing for the first time a precise characterization of cerebellar functional deficits in this murine model of DS. However, these deficits do not benefit from the normalization of cerebellar morphology following treatment with SAG. Together with the previous observation that the synaptic properties of Purkinje cells are also unchanged by SAG treatment, this lack of improvement in a region-specific behavioral assay supports the possibility that a direct effect of Shh pathway stimulation on the hippocampus might explain the benefits of this potential approach to the improvement of cognition in DS.
Introduction
Down syndrome (DS), which is caused by the presence of a third copy of chromosome 21, is one of the most common forms of autosomal aneuploidy (Epstein, 1986). Individuals with DS have a small and hypocellular brain and they suffer from a disproportionate reduction in the number of granule cells in their cerebellum (Aylward et al., 1997; Baxter et al., 2000). The best animal model for DS is the Ts65Dn mouse, which is trisomic for orthologs of approximately half of the genes on human chromosome 21 (Reeves et al., 1995). These mice display several anomalies analogous to those in DS including cognitive hippocampal disorders, premature aging, early cholinergic degeneration and a small cerebellum (Baxter et al., 2000). Similar to DS in human, Ts65Dn mice suffer from a reduction in cerebellar granule cells (Olson et al., 2004), but it remains unclear to what extent motor performance and/or motor learning deficits are affected in these mice (cf. Costa et al., 1999; Baxter et al., 2000; Hyde et al., 2001).
Sonic Hedgehog (Shh) mitogenic signaling is essential for rapid expansion of cerebellar granule cell precursors (gcp) early after birth (Wallace, 1999; Wechsler-Reya and Scott, 1999). Reduction of granule cells in Ts65Dn is correlated with reduced mitogenic gcp in trisomic mice compared with euploid (Roper et al., 2006). Indeed, treatment of Ts65Dn mice on the day of birth with the “small agonist of hedgehog pathway 1.1” (SAG) has been shown to restore granule cell precursor mitogenesis and normalize cerebellar morphology in adults (Roper et al., 2006; Das et al., 2013). However, because no consistent, cerebellum-specific functional effect has been documented in Ts65Dn mice, it is unclear whether SAG treatment might relieve Ts65Dn animals from potential deficits in cerebellar motor coordination.
To determine whether the reduction of granule cells in Ts65Dn mice contributes to specific cerebellar motor problems and whether rescuing these cells during early development might improve motor coordination, we subjected untreated and SAG-treated Ts65Dn mice to various compensatory eye movements tasks that depend on the vestibulocerebellum (Gao et al., 2012). We investigated their basic vestibulo-ocular reflex in dark (VOR) and light (VVOR) and their ability to adapt and consolidate their VOR. We chose these particular paradigms because, due to the physical properties of the oculomotor plant, eye movements are relatively insensitive to detriments in musculoskeletal performance and/or changes in body weight (Kaminski and Richmonds, 2002), both of which have been reported in Ts65Dn mice (Costa et al., 2010).
Materials and Methods
Founder B6EiC3H-a/A-Ts65Dn (Ts65Dn) mice were obtained from The Jackson Laboratory and maintained in our colony as an advanced intercross on a (C57BL/6J × C3H/HeJ; B6C3) genetic background, i.e., both euploid mice and their trisomic littermates were ∼50% B6 and 50% C3H on average. The T65Dn chromosome was transmitted from mothers, fathers or by in vitro fertilization. Ts65Dn mice were identified by PCR (Reinholdt et al., 2011).
SAG was synthesized (Chen et al., 2002), dissolved in ethanol, or DMSO and resuspended in triolein. SAG activity was established by comparison to the amount of gcp proliferation after Shh stimulation (Roper et al., 2006; Das et al., 2013). On the day of birth (P0), each pup in a litter received a subcutaneous injection of 20 μl of SAG to a final dose of 20 μg/g, or an equal volume of vehicle. For details on the methods for histology, see Das et al. (2013) and for impact of SAG on histology of cerebellar granular layer, including that of vestibulocerebellum, see Table 1.
Table 1.
Cerebellar histological measurements
| Normalized cerebellar area (Cb area/total brain area) |
Granule cell density (No. cells per μm2) |
|||
|---|---|---|---|---|
| Mean | SEM | Mean | SEM | |
| EuVeh (n = 8) | 0.17 | 0.005 | 0.023 | 0.0009 |
| TsVeh (n = 5) | 0.15* | 0.007 | 0.018* | 0.0007 |
| TsSAG (n = 8) | 0.16 | 0.003 | 0.022 | 0.0006 |
| P value | 0.002 | 0.006 | ||
Mean and SEM of the different experimental groups for normalized cerebellar area (total cerebellar area divided by total brain area) and granule cell density. P values after one-way ANOVA show significant differences of TsVeh versus EuVeh and TsSAG for both parameters.
*p < 0.05 after Tukey–Kramer post hoc test, showing significant lower values for normalized cerebellar area and granule cell density of TsVeh animals compared with EuVeh and TsSAG (Das et al., 2013).
Wild-types injected with vehicle (WT, n = 12), Ts65Dn mice injected with vehicle (n = 10), and SAG-treated Ts65Dn mice (n = 13) were prepared and tested for eye movement recordings as described by de Jeu and De Zeeuw (2012). All procedures were in line with the European guidelines for the care and use of laboratory animals (Council Directive 2003/65/CE) and approved by the Dutch Animal Experimentation Committee (DEC-KNAW). In short, mice were placed head-fixed in a holder on a vestibular platform (R2000 Rotopod, Parallel Robotic Systems; Fig. 1A) and left eye orientation was measured using pupil tracking with a CCD camera (Pulnix TM-6710CL, 120 frames/s) and analyzed using custom-built software for Labview (National Instruments) and MATLAB (MathWorks; Stahl et al., 2000). Horizontal VOR was characterized in both darkness and light using sinusoidal rotation at frequencies ranging between 1/16th to 4 Hz, holding constant peak velocity of 18.8°/s. VOR adaptation was tested using the VOR reversal paradigm (Gutierrez-Castellanos et al., 2013). Mice were subjected to a VOR cancellation stimulus on the first day (in-phase sinusoidal movement at 0.6 Hz, 5° amplitude of both table and visual surround) and a VOR reversal stimulus on subsequent days (2–5), during which the amplitude of the visual surround was increased to 7.5° (day 2) and 10° (days 3–5). Amplitude of the turntable remained constant at 5° amplitude (18.8°/s peak velocity). Training sessions consisted of six VOR measurements (30 cycles, 50 s, in darkness) that were alternated with five periods of visuo-vestibular mismatch training (300 cycles, 500 s). In between training sessions, animals were kept in darkness. Gain of the eye movement response was defined as the ratio between eye velocity and table velocity. Phase shift was expressed in degrees and offset by 180°, so that a phase of 0° indicates an eye movement that is in-phase with contraversive head movement; positive phase shift indicates phase lead. Error bars represent SEM. Consolidation of adapted VOR was assessed by computing the ratio between long-term change in VOR and cumulative sum of short-term changes in VOR of preceding training sessions. The long-term change was defined as the absolute difference between the ending VOR on day 5 and naive VOR on day 1. The short-term change was defined as the absolute difference between the VOR at the end of a training session and beginning of a training session. For at least 10 d, animals were allowed to rest between different adaptation protocols. Bivariate 2-sample Hotelling's T2 test was used to compare gain and phase values between groups, and one-way ANOVA/Tukey post hoc test was used for cumulative consolidation values.
Figure 1.

Basic sensorimotor integration and short-term VOR adaptation. A, Behavioral setup with eye movements captured by CCD camera, example of corneal reflection and pupil edge detection, and a trace indicating raw eye velocity (red line) in response to vestibular stimulation (black line). B, Schematic representations of the stimulus presented for basic compensatory eye movements assessment followed by plots of gain and phase during the vestibulo-ocular reflex in the light (VVOR, open marks) and dark (VOR, filled marks). C, Representations of the stimulus used for short-term adaptation of the VOR and VOR gain changes following either increase or decrease training. D, E, P values for comparisons among group means for each frequency tested with bivariate Hotteling's T2 test. Top and bottom, Group comparisons for VVOR and VOR performances, respectively. The combination of colors indicates which groups are compared in each case. The results show unaffected basic sensorimotor integration (D) and impaired VOR adaptation (E), which is minimal in the range of frequencies from 0.5 to 1 Hz, in which the VOR adaptation paradigms are performed. Error bars represent SEM.
Results
Baseline performance
VOR was tested over a range of frequencies to assess basic vestibular function (Fig. 1B, filled marks). Vehicle-treated euploid mice (EuVeh) had a significantly higher gain and lower phase lead (p < 0.05) in the low-frequency range than both vehicle- or SAG-treated Ts65Dn mice (TsVeh and TsSAG, respectively), whereas the latter two groups had virtually indistinguishable performances. However, this difference was minimal between all three groups at 0.6 Hz (Fig. 1E), the frequency used for VOR reversal training. In contrast, during VOR in the light (VVOR) the different groups of mice showed no statistical difference for either gain or phase across the entire frequency range (Fig. 1D), which indicates that visuo-vestibular integration was not altered in Ts65Dn mice injected with vehicle or SAG compared with euploid littermates.
VOR short-term adaptation
VOR cancellation training (visual stimulus in-phase with turntable) and VOR gain increase training (visual stimulus out-of-phase with turntable) was presented to assess short-term adaptation of the VOR gain. Six catch trials (1 min each) were recorded in between five training blocks of the visuo-vestibular training signal (8 min each; Fig. 1C). No significant differences were observed after 1 h of training among any of the three groups (p > 0.05, Fig. 1D), indicating that Ts65Dn mice have normal ability to modify their VOR gain after short-term visuo-vestibular training.
VOR long-term adaptation
The animals were then trained using the long-term VOR reversal paradigm. All groups displayed comparable oculomotor behavior in response to visuo-vestibular mismatch stimulus during the course of training. The EuVeh group presented a faster adaptation curve during the training, but there were no significant differences between the eye movement responses to the visuo-vestibular mismatch stimulus after the third day of training (Fig. 2A,D, top). All mice were able to follow the visual stimulus and showed a gradual increase in compensatory eye movement performance on all training days. At the end of each training day, all groups reached comparable oculomotor performance (Fig. 2D), which indicates that Ts65Dn mice were able to integrate both vestibular and visual cues and to adapt normally to improve performance.
Figure 2.

Ts65dn mice show impaired long-term VOR adaptation, which is not rescued by SAG treatment. A, Gain and phase values during mismatch training are comparable between groups. B, Gain and phase values of VOR catch trials showing significant impairment in both TsVeh and TsSAG groups compared with EuVeh increasing over consecutive days. C, From left to right, representative eye velocity traces of the initial VOR previous to the mismatch training, resulting VOR after the mismatch training where the differences between EuVeh mice and both Ts groups are evident, and VVOR performance on last day of mismatch training, showing comparable performance to the training signal. D, P values for comparisons between group means for the VVOR plotted in A, tested using the bivariate Hotteling's T2 test. E, P values indicating the significance of differences between group means for the VOR plotted in B, which have been tested using the bivariate Hotteling's T2 test. Error bars represent SEM.
In contrast to the optokinetic behavior during mismatch stimulation, the learning of the VOR, evaluated from the catch trials presented during the VOR reversal training, was significantly different (p < 0.05) between Ts65Dn mice and their euploid littermates (Fig. 2B,E). The VOR of both groups of Ts65Dn mice adapted more slowly than their euploid littermates, so that after the training session on day 5, EuVeh mice had successfully reversed the direction of the VOR, whereas the Ts65Dn groups showed no reversal. The amplitude of eye movements of EuVeh mice was significantly higher (p < 0.05). Surprisingly, TsSAG and TsVeh mice showed virtually indistinguishable adaptation during VOR reversal learning (Fig. 2B). Similarly, cumulative consolidation values of EuVeh mice were significantly higher (p < 0.05) than those of TsVeh and TsSAG mice (Fig. 3C), these latter two not being significantly different from each other (p > 0.05). These data show that VOR adaptation and consolidation are affected in Ts65Dn mice and that normalizing their cerebellar volume postnatally by restoration of granule cell numbers by SAG treatment is not sufficient to restore their levels of cerebellar learning to those of euploid controls.
Figure 3.
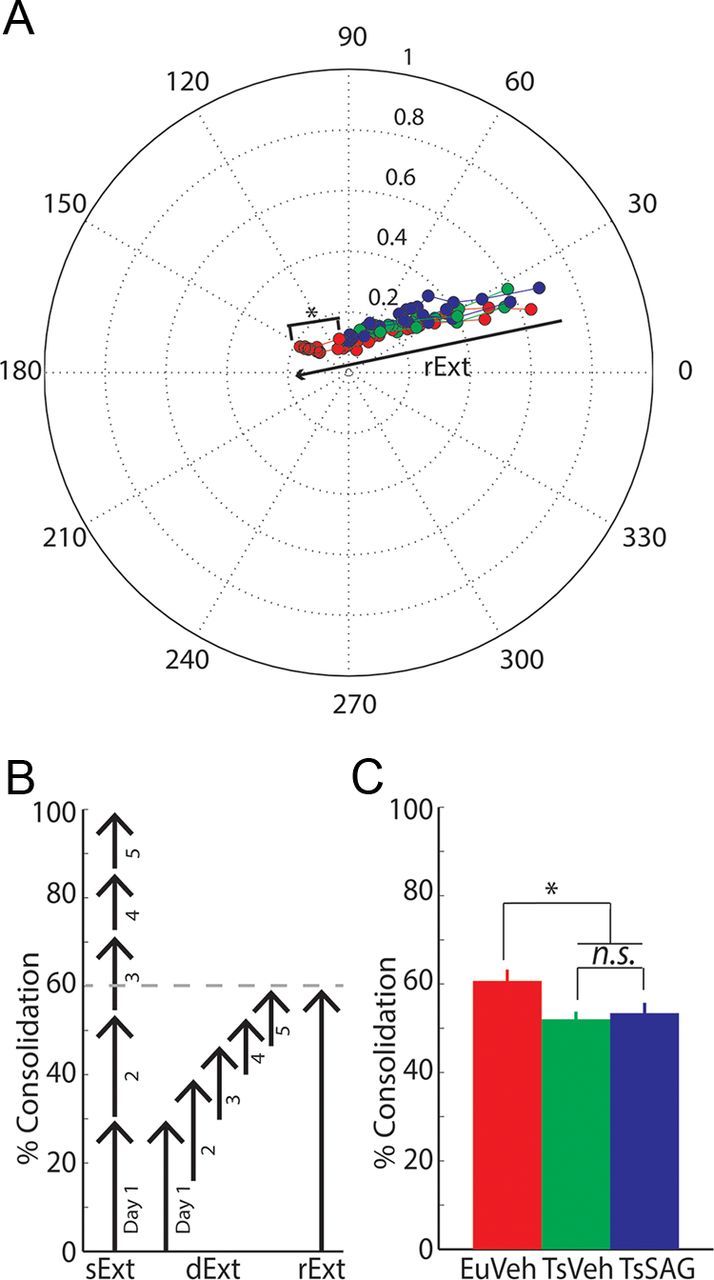
Consolidation of vestibulo-cerebellar learning is impaired in Ts65Dn mice, but not rescued by SAG treatment. A, Polar plot showing the trajectory of VOR gain and phase change during adaptation for the different groups. Gain is represented as distance from the center and phase as the angle relative to perfect compensation at 0 degrees. Note the significant difference between the learning extent of EuVeh and both Ts65Dn groups. B, Schematic explanation of the consolidation calculation, exemplified with the EuVeh dataset. Consolidation of VOR adaptation is calculated by dividing the extent of the real learning vector (rExt) achieved after the 5-day training paradigm by the sum of the short-term learning vectors achieved each day as if there was no loss of learning overnight (sExt). Therefore, the rExt can be interpreted as the fraction of the short-term learning vectors retained between training days (dExt). C, Motor memory consolidation in the phase reversal task is significantly decreased in both TsVeh and TsSAG groups compared with EuVeh mice. Error bars represent SEM. Asterisks represent p < 0.05 after multivariate Hotteling's T2 test (A) and Tukey–Kramer post hoc test (C).
Discussion
We used long-term VOR phase reversal adaptation to assess cerebellar learning in the Ts65Dn mouse model of DS and determine the effect of normalizing cerebellar development on this outcome. This oculomotor task presents several advantages compared with other cerebellar tasks. The modification of a reflex behavior is largely independent from other cognitive functions and depends specifically on the activity of the vestibulocerebellum (Gao et al., 2012), which makes it appropriate to measure cerebellar learning in cognitively impaired mice. The input (visual and/or vestibular) can be precisely controlled and the output (eye movement) can be monitored by video-oculography, a noninvasive technique that enables us to measure eye position virtually continuously. Thereby, this approach provides a better understanding of the input/output relation of the behavioral response than tasks, such as the accelerating rotorod, gait analysis, or grip strength task, which can be affected by noncerebellar deficits in the musculoskeletal system or nervous system.
As the Ts65Dn mice had intact basic oculomotor performance and sensorimotor integration without showing any sign of ataxia, our results are in line with a previous Ts65Dn study that showed little to no deficits in basic motor performance (Hyde et al., 2001), whereas they stand in marked contrast with a study reporting deficits in basic gait (Costa et al., 1999). Yet, unlike the absence of a prominent phenotype during motor performance, our data revealed that Ts65Dn mice have significant motor learning and consolidation deficits in a cerebellum-specific learning task. Interestingly, the data on deficits in long-term phase reversal learning and consolidation were in line with those found in other mutants, in which cerebellar granule cells were affected in a cell-specific fashion using the GABA-α6 subunit promoter (Seja et al., 2012; Galliano et al., 2013). Whereas Ts65Dn mice suffer from a loss of ∼30% of their granule cells (Baxter et al., 2000) and show relatively mild deficits in learning and consolidation, α6-Cacna1a modified mice, which are missing ∼75% of their granule cell output, show qualitatively the exact same phenotype of learning and consolidation deficits without ataxia, yet at a more severe level (Galliano et al., 2013).
Until now the source of motor learning deficits in Ts65Dn mice has remained controversial, because the tests used were not sensitive enough or not cerebellum-specific and therefore potentially biased by extra-cerebellar deficits, leading in some cases to misinterpretation (Costa et al., 1999; Baxter et al., 2000; Hyde et al., 2001; Costa et al., 2010; Di Filippo et al., 2010). Here, we provide evidence that trisomic mice have a specific cerebellar deficit in VOR long-term adaptation. Our data on short-term VOR learning differ somewhat from results in people with DS, in whom greater deficits were reported for both gain-increase and gain-decrease learning (Costa, 2011). However, the VOR measurements in human subjects were taken at low stimulus frequencies, in which the vestibular system has lower reliability (van Alphen et al., 2001). Moreover, it is unclear to what extent attention deficits might have affected outcomes in these cognitively impaired individuals, who were required to fix their eyes on a target for an extended period during training.
Despite its positive impact on cerebellar neuroanatomical architecture (Roper et al., 2006; Das et al., 2013), SAG treatment failed to rescue long-term cerebellar-based learning. Our results cannot argue in favor of a positive impact of SAG-treatment on neither acquisition nor consolidation during phase-reversal learning; the outcomes of TsVeh and TsSAG mice were virtually indistinguishable, whereas they significantly diverged from those of controls. In principle, SAG treatment itself might have induced adverse side effects and thereby blurred a potential therapeutic impact. However, our finding that baseline motor performance during both optokinetic and vestibular, oculomotor behavior was normal in SAG-treated Ts65Dn mice compared with Veh-treated mice suggests that SAG by itself does not present severe adverse side effects on motor behavior. Moreover, SAG treatment can rescue spatial navigation in Ts65Dn mice, although it does not cause such deficits in euploid controls (Das et al., 2013). Therefore, our data suggest that the biological causes underlying cerebellar learning deficits in DS are multicausal, which is not surprising for a complex genetic condition.
At least two factors may explain why SAG treatment failed to recover cerebellar function in Ts65Dn mice. First, in Ts65Dn mice granule cells present functional abnormalities that are characterized by increased excitability and shorter action potentials with larger amplitudes (Usowicz and Garden, 2012). Even though SAG treatment rescues the decrease in granule cell number, it appears to fail at rescuing their cell physiological abnormalities as shown by their altered release probability at parallel fiber to Purkinje cell synapses (Das et al., 2013). Because a similar increase in excitability of granule cells can be observed in mice with granule cell specific knock outs of the potassium chloride transporter Kcc2, which also show a similar behavioral phenotype (Seja et al., 2012), it is parsimonious to explain the prevailing phenotype at least in part by this factor. Second, Ts65Dn mice show an increased release probability for GABA (Kleschevnikov et al., 2012), which may not only affect the output of Purkinje cells directly, but also cause overinhibition by GABAergic cerebellar interneurons. Thus, as manipulation of release probability of GABA has a positive impact on hippocampal tests in Ts65Dn mice (Martínez-Cué et al., 2013), this type of release process may also play a role in the cerebellum. Because Ts65Dn mice also show deficits in the Purkinje cells which supply the Shh that stimulates granule cell precursors to divide and migrate (Currier et al., 2012) and because Shh-responsive genes have been found in the cerebellum as early as embryonic day 17 in mice (Dahmane et al., 1999), it will be interesting to find out whether administration of SAG at an earlier, prenatal time point might also rescue the functionality of granule cells as opposed to only normalizing their numbers.
Cerebellar LTD might be involved in spatial navigation (Burguière et al., 2005), which raises the question of whether the impact of SAG treatment on cerebellar neuroanatomy contributes to improved hippocampal learning. However, our data demonstrates little impact of SAG treatment on behavioral correlates of cerebellar function. In addition, cerebellar LTD has been shown to be comparable between EuVeh and TsVeh mice (Das et al., 2013), rendering it unlikely that any impact on cerebellar LTD could improve hippocampal function. Thus together with the findings on therapeutic effects of SAG treatment on spatial navigation (Das et al., 2013), our results suggest that SAG could have an as-yet unknown direct effect on hippocampal function, for instance by enhancing downstream Shh-dependent expression of genes involved in LTP-induction (Pereira et al., 2009), whereas the same treatment normalizes cell numbers in the cerebellar granular layer without functionally ameliorating the trisomy-specific motor learning deficits of Ts65Dn mice.
Footnotes
This work was supported by the Dutch Organization for Medical Sciences (ZonMw; C.I.D.Z.), Life Sciences (ALW; C.I.D.Z.), Senter (Neuro-Basic), ERC-adv, CEREBNET, C7 programs of the European Community (N.G.-C., L.T.R., and C.I.D.Z.) and the Down Syndrome Research and Treatment Foundation, Research Down Syndrome and R01HD038384-13 (R.H.R.). We thank J. Plugge for technical assistance.
The authors declare no competing financial interests.
References
- Aylward EH, Habbak R, Warren AC, Pulsifer MB, Barta PE, Jerram M, Pearlson GD. Cerebellar volume in adults with Down syndrome. Arch Neurol. 1997;54:209–212. doi: 10.1001/archneur.1997.00550140077016. [DOI] [PubMed] [Google Scholar]
- Baxter LL, Moran TH, Richtsmeier JT, Troncoso J, Reeves RH. Discovery and genetic localization of Down syndrome cerebellar phenotypes using the Ts65Dn mouse. Hum Mol Genet. 2000;9:195–202. doi: 10.1093/hmg/9.2.195. [DOI] [PubMed] [Google Scholar]
- Burguière E, Arleo A, Hojjati Mr, Elgersma Y, De Zeeuw CI, Berthoz A, Rondi-Reig L. Spatial navigation impairment in mice lacking cerebellar LTD: a motor adaptation deficit? Nat Neurosci. 2005;8:1292–1294. doi: 10.1038/nn1532. [DOI] [PubMed] [Google Scholar]
- Chen JK, Taipale J, Young KE, Maiti T, Beachy PA. Small molecule modulation of smoothened activity. Proc Natl Acad Sci U S A. 2002;99:14071–14076. doi: 10.1073/pnas.182542899. [DOI] [PMC free article] [PubMed] [Google Scholar]
- Costa AC. An assessment of the vestibulo-ocular reflex (VOR) in persons with Down syndrome. Exp Brain Res. 2011;214:199–213. doi: 10.1007/s00221-011-2820-y. [DOI] [PubMed] [Google Scholar]
- Costa AC, Walsh K, Davisson MT. Motor dysfunction in a mouse model for Down syndrome. Physiol Behav. 1999;68:211–220. doi: 10.1016/S0031-9384(99)00178-X. [DOI] [PubMed] [Google Scholar]
- Costa AC, Stasko MR, Schmidt C, Davisson MT. Behavioral validation of the Ts65Dn mouse model for Down syndrome of a genetic background free of the retinal degeneration mutation Pde6b(rd1) Behav Brain Res. 2010;206:52–62. doi: 10.1016/j.bbr.2009.08.034. [DOI] [PMC free article] [PubMed] [Google Scholar]
- Currier DG, Polk RC, Reeves RH. A Sonic hedgehog (Shh) response deficit in trisomic cells may be a common denominator for multiple features of Down syndrome. Prog Brain Res. 2012;197:223–236. doi: 10.1016/B978-0-444-54299-1.00011-X. [DOI] [PMC free article] [PubMed] [Google Scholar]
- Dahmane N, Ruiz i Altaba A. Sonic hedgehog regulates the growth and patterning of the cerebellum. Development. 1999;126:3089–3100. doi: 10.1242/dev.126.14.3089. [DOI] [PubMed] [Google Scholar]
- Das I, Park JM, Shin JH, Jeon SK, Lorenzi H, Linden DJ, Worley PF, Reeves RH. Hedgehog agonist therapy corrects structural and cognitive deficits in a Down syndrome mouse model. Sci Translational Med. 2013;5:201ra120. doi: 10.1126/scitranslmed.3005983. [DOI] [PMC free article] [PubMed] [Google Scholar]
- de Jeu M, De Zeeuw CI. Video-oculography in mice. J Vis Exp. 2012;65:e3971. doi: 10.3791/3971. [DOI] [PMC free article] [PubMed] [Google Scholar]
- Di Filippo FM, Tozzi A, Ghiglieri V, Picconi B, Costa C, Cipriani S, Tantucci M, Belcastro V, Calabresi P. Impaired plasticity at specific subset of striatal synapses in the Ts65Dn mouse model of Down syndrome. Biol Psychiatry. 2010;67:666–671. doi: 10.1016/j.biopsych.2009.08.018. [DOI] [PubMed] [Google Scholar]
- Epstein C. The consequences of chromosome imbalance: principles, mechanisms, and models. Cambridge: Cambridge UP; 1986. [Google Scholar]
- Galliano E, Gao Z, Schonewille M, Todorov B, Simons E, Pop AS, D'Angelo E, van den Maagdenberg AM, Hoebeek FE, De Zeeuw CI. Silencing the majority of cerebellar granule cells uncovers their essential role in motor learning and consolidation. Cell Reports. 2013;3:1239–1251. doi: 10.1016/j.celrep.2013.03.023. [DOI] [PubMed] [Google Scholar]
- Gao Z, van Beugen BJ, De Zeeuw CI. Distributed synergistic plasticity and cerebellar learning. Nat Rev Neurosci. 2012;13:619–635. doi: 10.1038/nrn3312. [DOI] [PubMed] [Google Scholar]
- Gutierrez-Castellanos N, Winkelman BH, Tolosa-Rodriguez L, De Gruijl JR, De Zeeuw CI. Impact of aging on long-term ocular reflex adaptation. Neurobiol Aging. 2013;pii(13):S0197–4580. doi: 10.1016/j.neurobiolaging.2013.06.012. 00267–4. [DOI] [PubMed] [Google Scholar]
- Hyde LA, Crnic LS, Pollock A, Bickford PC. Motor learning in Ts65Dn mice, a model for Down syndrome. Dev Psychobiol. 2001;38:33–45. doi: 10.1002/1098-2302(2001)38:1<33::AID-DEV3>3.0.CO%3B2-0. [DOI] [PubMed] [Google Scholar]
- Kaminski HJ, Richmonds CR. Extraocular muscle fatigue. Ann N Y Acad Sci. 2002;956:397–398. doi: 10.1111/j.1749-6632.2002.tb02838.x. [DOI] [PubMed] [Google Scholar]
- Kleschevnikov AM, Belichenko PV, Gall J, George L, Nosheny R, Maloney MT, Salehi A, Mobley WC. Increased efficiency of the GABAA and GABAB receptor-mediated neurotransmission in the Ts65Dn mouse model of Down syndrome. Neurobiol Dis. 2012;45:683–691. doi: 10.1016/j.nbd.2011.10.009. [DOI] [PMC free article] [PubMed] [Google Scholar]
- Martínez-Cué C, Martínez P, Rueda N, Vidal R, García S, Vidal V, Corrales A, Montero JA, Pazos Á, Flórez J, Gasser R, Thomas AW, Honer M, Knoflach F, Trejo JL, Wettstein JG, Hernández MC. Reducing GABAA α5 receptor-mediated inhibition rescues functional and neuromorphological deficits in a mouse model of down syndrome. J Neurosci. 2013;33:3953–3966. doi: 10.1523/JNEUROSCI.1203-12.2013. [DOI] [PMC free article] [PubMed] [Google Scholar]
- Olson LE, Roper RJ, Baxter LL, Carlson EJ, Epstein CJ, Reeves RH. Down syndrome mouse models Ts65Dn, Ts1Cje, and Ms1Cje/Ts65Dn exhibit variable severity of cerebellar phenotypes. Dev Dyn. 2004;230:581–589. doi: 10.1002/dvdy.20079. [DOI] [PubMed] [Google Scholar]
- Pereira PL, Magnol L, Sahún I, Brault V, Duchon A, Prandini P, Gruart A, Bizot JC, Chadefaux-Vekemans B, Deutsch S, Trovero F, Delgado-García JM, Antonarakis SE, Dierssen M, Herault Y. A new mouse model for the trisomy of the Abcg1–U2af1 region reveals the complexity of the combinatorial genetic code of down syndrome. Hum Mol Genet. 2009;18:4756–4769. doi: 10.1093/hmg/ddp438. [DOI] [PMC free article] [PubMed] [Google Scholar]
- Reeves RH, Irving NG, Moran TH, Wohn A, Kitt C, Sisodia SS, Schmidt C, Bronson RT, Davisson MT. A mouse model for Down syndrome exhibits learning and behaviour deficits. Nat Genet. 1995;11:177–184. doi: 10.1038/ng1095-177. [DOI] [PubMed] [Google Scholar]
- Reinholdt LG, Ding Y, Gilbert GT, Czechanski A, Solzak JP, Roper RJ, Johnson MT, Donahue LR, Lutz C, Davisson MT. Molecular characterization of the translocation breakpoints in the Down syndrome mouse model Ts65Dn. Mamm Genome. 2011;22:685–691. doi: 10.1007/s00335-011-9357-z. [DOI] [PMC free article] [PubMed] [Google Scholar]
- Roper RJ, Baxter LL, Saran NG, Klinedinst DK, Beachy PA, Reeves RH. Defective cerebellar response to mitogenic hedgehog signaling in Down syndrome mice. Proc Natl Acad Sci U S A. 2006;103:1452–1456. doi: 10.1073/pnas.0510750103. [DOI] [PMC free article] [PubMed] [Google Scholar]
- Seja P, Schonewille M, Spitzmaul G, Badura A, Klein I, Rudhard Y, Wisden W, Hübner CA, De Zeeuw CI, Jentsch TJ. Raising cytosolic Cl− in cerebellar granule cells affects their excitability and vestibulo-ocular learning. EMBO J. 2012;31:1217–1230. doi: 10.1038/emboj.2011.488. [DOI] [PMC free article] [PubMed] [Google Scholar]
- Stahl JS, van Alphen AM, De Zeeuw CI. A comparison of video and magnetic search coil recordings of mouse eye movements. J Neurosci Methods. 2000;99:101–110. doi: 10.1016/S0165-0270(00)00218-1. [DOI] [PubMed] [Google Scholar]
- Usowicz MM, Garden CL. Increased excitability and altered action potential waveform in cerebellar granule neurons of the Ts65Dn mouse model of Down syndrome. Brain Res. 2012;1465:10–17. doi: 10.1016/j.brainres.2012.05.027. [DOI] [PMC free article] [PubMed] [Google Scholar]
- van Alphen AM, Stahl JS, De Zeeuw CI. The dynamic characteristics of the mouse horizontal vestibulo-ocular and optokinetic response. Brain Res. 2001;890:296–305. doi: 10.1016/S0006-8993(00)03180-2. [DOI] [PubMed] [Google Scholar]
- Wallace VA. Purkinje-cell-derived Sonic hedgehog regulates granule neuron precursor cell proliferation in the developing mouse cerebellum. Curr Biol. 1999;9:445–448. doi: 10.1016/S0960-9822(99)80195-X. [DOI] [PubMed] [Google Scholar]
- Wechsler-Reya RJ, Scott MP. Control of neuronal precursor proliferation in the cerebellum by Sonic hedgehog. Neuron. 1999;22:103–114. doi: 10.1016/S0896-6273(00)80682-0. [DOI] [PubMed] [Google Scholar]