

Abstract
Sleep encompasses approximately a third of our lifetime, yet its purpose and biological function are not well understood. Without sleep optimal brain functioning such as responsiveness to stimuli, information processing, or learning may be impaired. Such observations suggest that sleep plays a crucial role in organizing or reorganizing neuronal networks of the brain toward states where information processing is optimized.
Increasing evidence suggests that cortical neuronal networks operate near a critical state characterized by balanced activity patterns, which supports optimal information processing. However, it remains unknown whether critical dynamics is affected in the course of wake and sleep, which would also impact information processing. Here, we show that signatures of criticality are progressively disturbed during wake and restored by sleep. We demonstrate that the precise power-laws governing the cascading activity of neuronal avalanches and the distribution of phase-lock intervals in human electroencephalographic recordings are increasingly disarranged during sustained wakefulness. These changes are accompanied by a decrease in variability of synchronization. Interpreted in the context of a critical branching process, these seemingly different findings indicate a decline of balanced activity and progressive distance from criticality toward states characterized by an imbalance toward excitation where larger events prevail dynamics. Conversely, sleep restores the critical state resulting in recovered power-law characteristics in activity and variability of synchronization. These findings support the intriguing hypothesis that sleep may be important to reorganize cortical network dynamics to a critical state thereby assuring optimal computational capabilities for the following time awake.
Introduction
Sleep is crucial for daytime functioning and well being. Although a vital part of life, its purpose and biological function are not yet well understood (Mignot, 2008). The importance of sleep is illustrated by the deteriorating effects of chronic sleep restriction or total sleep deprivation on human performance (Banks and Dinges, 2007). Without sleep optimal brain functioning such as responsiveness to stimuli, information processing, or learning may be impaired. Such observations suggest that sleep may play an important role in organizing or reorganizing neuronal networks in the brain toward states where information processing is optimized.
The general idea that both the computational capabilities of a system and its complexity are maximized at or nearby critical states related to phase transitions or bifurcations (Langton, 1990) led to the hypothesis that neuronal networks in the brain operate at or close to a critical state. The observation of neuronal activity patterns consistently following power-law distributions, a hallmark of systems at a continuous phase transition, further raised the interest in the hypothesis of critical brain dynamics (Linkenkaer-Hansen et al., 2001; Worrell et al., 2002; Beggs and Plenz, 2003; Fraiman et al., 2009; Benayoun et al., 2010; Chialvo, 2010; Poil et al., 2012). Spatiotemporal cascades of activity termed neuronal avalanches obeying a power-law size distribution were observed in vitro (Beggs and Plenz, 2003, 2004), in vivo (Gireesh and Plenz, 2008; Petermann et al., 2009; Ribeiro et al., 2010), and human magnetoencephalogram (MEG; Palva et al., 2013; Shriki et al., 2013). Recently, the spatiotemporal patterns of coherence potentials, i.e., large-amplitude negative deflections with high similarity, were reported to express neuronal avalanches in local field potentials (LFP; Thiagarajan et al., 2010; Plenz, 2012). Neuronal avalanches have been regarded an indication of balanced dynamics, i.e., avoiding regimes of overexcitation or underexcitation. The balance in activity is captured by the branching parameter σ = 1 indicating that one event on average leads to one future event resulting in the corresponding cascade size distribution to follow a power-law with exponent −3/2 (Zapperi et al., 1995; de Carvalho and Prado, 2000; Haldeman and Beggs, 2005).
The idea of a balanced regime of activity in cortical networks also extends to properties of synchrony between neuronal groups. Recent insights from in vitro experiments and computational modeling indicated that a balanced critical state with neuronal avalanches is also characterized by moderate mean and maximal variability of neuronal synchrony (Yang et al., 2012). As an alternative synchronization metric, the durations of transient synchronization events between channel pairs in electroencephalography (EEG) were first reported to follow a power-law density distribution in Gong et al. (2003). Later on, the distribution of phase-lock intervals (PLIs) was observed to follow a power-law function in functional magnetic resonance imaging and electrocorticographic recordings, too (Kitzbichler et al., 2009; Meisel et al., 2012). Although not limited to it (Botcharova et al., 2012), power-law scaling of PLIs also arises in computational models at criticality (Kitzbichler et al., 2009), which led to the hypothesis that its observation in neurophysiological data is indicative of a critical state of brain dynamics.
While there is growing evidence for the existence of critical states in cortical networks it is still an unresolved question how this relates to modifications of these networks in the course of wake and sleep (Pearlmutter and Houghton, 2009; Ribeiro et al., 2010; Priesemann et al., 2013). In the present work, we investigated the hypothesis that wakefulness moves cortical networks away from a critical state, which is restored by sleep. We focused on the detection of neuronal avalanches and measures of synchrony (mean, variability, the distribution of PLIs) as means to detect critical dynamics in the EEG during a period of sustained wakefulness (sleep deprivation).
Materials and Methods
EEG recordings during prolonged wakefulness.
We analyzed wake EEG recordings of eight healthy young right-handed males (23.0 ± 0.46 years; mean ± SEM) during 40 h of sustained wakefulness (data from a previous study; Finelli et al., 2000). During this time, participants were under constant surveillance. The waking EEG was recorded in 14 sessions at 3 h intervals starting at 07:00. Another waking EEG was recorded after a recovery night following the sleep deprivation period amounting to a total of 15 EEG sessions. Sessions consisted of a first 5 min eyes-open period, followed by a 4–5 min eyes-closed period, and a second 5 min eyes-open period. Twenty-seven EEG derivations (extended 10–20 system; reference electrode 5% rostral to Cz) were sampled with 256 Hz (high-pass filter at 0.16 Hz; anti-aliasing low-pass filter at 70 Hz). Artifacts including eye blinks were marked by visual inspection.
Rating of alertness.
Alertness was self-rated on a pseudo-analog scale, which consisted of a 20 point subjective rating scale using a palmtop computer. Alertness, date, and time of rating were recorded from each subject at each EEG session (Finelli et al., 2000).
Detection of cascades of coherence potentials.
We used artifact-free EEG segments during the eyes-open condition. The length of segments was chosen to be 5000 samples long (corresponding to 19.53 s) to strike a compromise between, on one hand, including as many artifact-free segments as possible in the analysis and, on the other hand, having these segments long enough to provide a sufficiently large number of events. An average of 18 segments corresponding to a total of ∼6 min of EEG data was analyzed in each subject and EEG session.
Large-amplitude activity patterns in the LFP, termed coherence potentials, have previously been shown to occur without distortion at other cortex sites via fast synaptic transmission extending up to hundreds of milliseconds (Thiagarajan et al., 2010). In this work, we used coherence potentials to detect cascades of neuronal activity in space and time in EEG. Coherence potentials were defined as EEG segments across time and different EEG channels characterized by crossing a positive or negative threshold at some point and exhibiting high mutual similarity. It should be noted, that although we followed a similar approach as described by Thiagarajan et al. (2010) in identifying coherence potentials, the method applied here to the EEG is different to previous studies where coherence potentials were derived from LFP. LFP allows for detection of neuronal activity with high spatial resolution. In the EEG, the determination of the spatial location of the signal is not possible to the same extent. In this respect, the detection of cascading events in neuronal activity in our work differs from the original works on neuronal avalanches derived from LFP (Beggs and Plenz, 2003; Petermann et al., 2009; Thiagarajan et al., 2010). Furthermore, coherence potentials were originally only defined for negative potentials due to their close correlation to neuronal spiking. This justification, however, does not necessarily hold for the EEG. In view of these differences, we considered both positive and negative potentials to identify coherence potentials.
First, large positive or negative excursions beyond a threshold were identified for each EEG channel after normalization of the signal by subtraction of the mean and dividing by the SD. The comparison of the signal distribution to the best Gaussian fit indicated that the two distributions start to deviate from one another around ±4 SD (see Fig. 1A). We therefore chose to use a threshold of ±4 SD throughout the paper. We systematically explored other thresholds around ±4 SD to verify that results were robust for a parameter range around the chosen threshold (see Results). Once a positive or negative excursion beyond the threshold had been detected in one of the channels, we then defined the period of interest on this channel as the continuous positive or negative excursion until the signal returned the baseline (0 SD) on both sides of the threshold crossing similar to Thiagarajan et al. (2010) and termed those segments Fi trigger events (Fig. 1B). The time of the signal's baseline crossing on either side of the excursion therefore determined the length of the trigger event.
Figure 1.
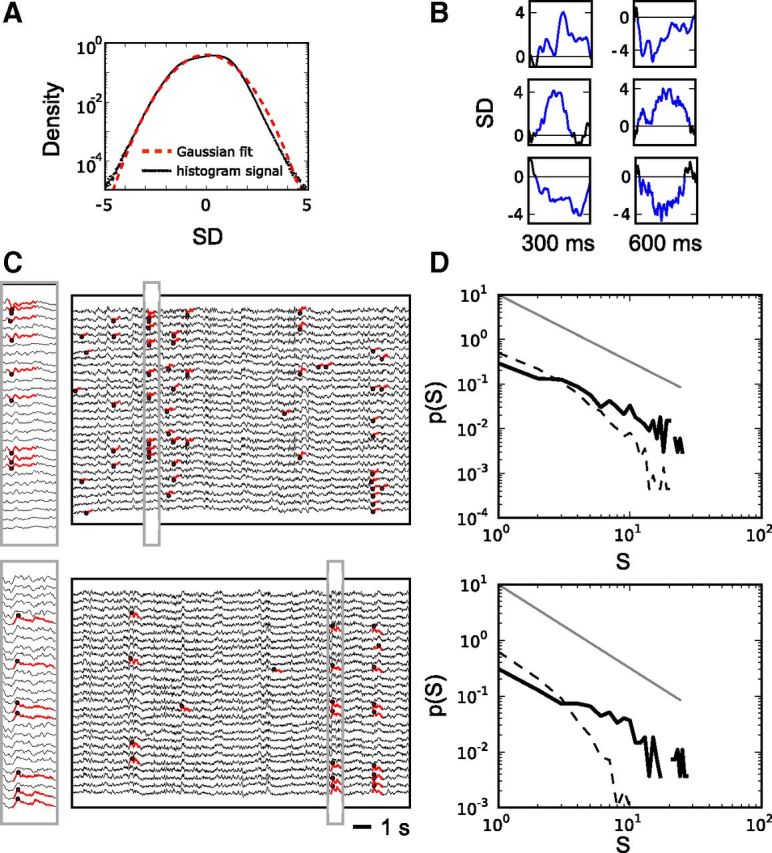
Coherence potentials organize as neuronal avalanches in EEG. A, The amplitude distribution of all EEG derivations from artifact-free segments (black curve) starts deviating from the best Gaussian fit (red dashed line) for excursions at approximately ±4 SD. B, The plot shows different examples of trigger events (blue). Trigger events are defined as segments with large-amplitude deflections exceeding either 4 or −4 SD. Their duration was defined by the crossing of the zero SD line. C, Exemplary EEG segments (5000 sampling points corresponding to 19.53 s) from two subjects. Coherence potentials are indicated by red lines. Plots on the left are a magnification of the segment indicated by the gray rectangle. The most extreme excursions of the coherence potentials (red dots) were used to discretized events in time and space. D, Cascade sizes S defined by the number of consecutive events follow a power-law probability distribution with an exponent of ≈−3/2. The two plots show the distributions of all cascade sizes from all EEG segments during one EEG session for each of the two subjects. Dashed black lines represent the cascade size distribution derived from phase-shuffled surrogate data. The gray lines show a power-law function with exponent −3/2.
Second, coherent segments between a trigger event Fi and periods Fj of equal duration in all channels were identified when correlations R as follows:
 |
were R ≥ 0.75. A correlation threshold in this range was identified by Thiagarajan et al. (2010) to robustly detect coherence potentials. We systematically changed the correlation threshold to verify that results were robust for a broad range around this value (see Results). Together with the trigger event, these coherent segments form the set of coherence potentials.
Next, coherence potentials were discretized in a raster plot to identify cascades in space and time. The time point of a single event was defined as the time point of the occurrence of the minimum (or maximum, depending on the trigger event) for each coherence potential (Fig. 1C). For each trigger event, the time series of events from each channel was discretized with time bins of duration Δt. Along the line of previous work (Beggs and Plenz, 2003; Gireesh and Plenz, 2008; Ribeiro et al., 2010; Friedman et al., 2012; Priesemann et al., 2013; Shriki et al., 2013), a continuous sequence of time bins with events in any channel ending with a time bin with no events in any channel was defined as a cascade of events. The cascade size S was defined as the number of events in all channels in a cascade. To prevent double counting of events and cascades we required trigger events not to have been an event in a previous cascade.
For control, we generated phase-shuffled surrogate data for each channel, which shuffles the phase of the original signal but keeps the amplitude spectra unchanged in the frequency domain (Theiler et al., 1992).
As an alternative approach to coherence potentials, we also derived neuronal avalanches by identifying large positive or negative deflections above a threshold at single EEG channels and combined them into spatiotemporal cascades by discretizing them in time by their most extreme excursion as described previously (Palva et al., 2013; Shriki et al., 2013). This method was recently shown to allow identification of neuronal avalanches in EEG and MEG.
Branching parameter σ.
The branching parameter σ quantifies the ratio of future events to ancestor events. Previously, it has been used to characterize cascading events on different scales, from activity in neuronal cultures to events in the MEG. We calculated σ as the ratio of the number of events in the second time bin of a cascade to the one in the first time bin. The ratio was averaged over all cascades for each subject and each EEG session.
Synchrony and entropy measurements.
We followed the approach described previously (Yang et al., 2012) to quantify mean and variability of synchronization. The calculation was performed on the same artifact-free segments used for the derivation of coherence potentials. After filtering the data in the alpha band (8–12 Hz), we first obtained a phase trace θi(t) from each EEG trace Fi(t) using its Hilbert transform H[Fi(t)]:
 |
Next, we quantified the mean synchrony in each EEG segment by
 |
where L = 5000 is the length of our EEG segments in samples and r(t) is the Kuramoto order parameter:
 |
which was used as a time-dependent measure of phase synchrony with n = 27 being the number of EEG channels in our data.
As a measure for the variability of synchronization we derived the entropy of r(t) in each EEG segment by
 |
where we estimated a probability distribution of r(t) by binning values into intervals. pi is then the probability that r(t) falls into a range bi < r(t) ≤ bi+1. Similar to Yang et al. (2012), we found results to be robust over a broad range for the number of bins B used. We applied B = 24 in the current analysis.
Derivation of the distribution of PLIs.
PLIs were calculated for all possible pairs of derivations of artifact-free EEG segments of 19.53 s duration (5000 samples, same segments as for the analysis of coherence potentials and synchronization measures). The analysis was performed for scale 4 (8–16 Hz; alpha band; see below) and scale 5 (4–8 Hz; theta band).
Hilbert wavelet transforms.
To derive a scale-dependent estimate of the phase difference between two EEG channels, we follow the approach described previously (Kitzbichler et al., 2009) using Hilbert transform derived pairs of wavelet coefficients (Whitcher et al., 2005). We define the instantaneous complex phase vector for two signals Fi(t) and Fj(t) as follows:
 |
where Wk denotes the kth scale of a Hilbert wavelet transform and † its complex conjugate. Here Fi(t) and Fj(t) are different EEG derivations. A local mean phase difference in the frequency interval defined by the kth wavelet scale is then given by
 |
with
 |
being a less noisy estimate of Ci,j(t) where 〈 · 〉 indicates the temporal average over a time window Δt = 2k8 in sampling steps (Kitzbichler et al., 2009).
Intervals of phase locking can then be identified as periods when |Δφi,j(t)| is smaller than some arbitrary threshold, which we set to π/4. We also require the modulus squared of the complex time average, , to be larger than 0.5, limiting the analysis to phase difference estimates above this level of significance.
Estimation of the goodness of power-law fit.
To determine the quality of the fit of a power-law function to the observed distribution we performed a goodness-of-fit test, which leads to a p value that quantifies the plausibility of the hypothesis that the distribution is power-law like (Clauset et al., 2009). Upon fitting the empirical distribution, power-law distributed synthetic data were generated with parameters derived from the power-law fit and individually fit to their own power-law model. The p values were then defined as the fraction of times the resulting Kolmogorov–Smirnov statistics for each synthetic data (n = 1000) relative to its own model was larger than the value of the empirical data. Larger p values therefore indicate a higher probability that the observed distribution could be explained by an underlying power-law characteristic. Conversely, low p values make a power-law distribution a less likely distribution to describe the empirical data.
As a measure quantifying the difference of a given empirical distribution of some quantity X (in our case S or PLI) from a power-law distribution with exponent α, we defined
 |
for which the cumulative probability distribution P(X) of the distribution's tail, i.e., the NX number of X values with values larger than some minimal value Xmin, was used. For distributions of cascade sizes the minimum Smin was set to 1 and cascade sizes up to system size (i.e., number of channels 27) were included in the sum. For the distribution of PLI the minimal value PLImin given by the fitting algorithm was applied.
Power density spectra.
EEG power density spectra were computed for derivation C3A2 of artifact-free 20 s epochs (same starting points as segments used for the derivation of coherence potentials, synchronization measures, and PLIs; fast Fourier transform routine; Hanning window; frequency resolution 0.25 Hz). Power in the theta (5–8 Hz) and alpha (8.25–12 Hz) range was determined and averaged for eyes-open segments per session and subject.
Results
Coherence potentials organize as neuronal avalanches in the EEG
We investigated the spatiotemporal organization of coherence potentials in artifact-free EEG intervals in the eyes-open condition. Artifact-free EEG intervals were analyzed in segments of length 5000 samples (corresponding to 19.53 s; see Materials and Methods). Multiple segments were analyzed for each subject and EEG session. On each of these segments, we first determined potentials with either a positive or a negative deflection larger than a certain threshold, which we termed trigger events and second identified segments with high similarity to these trigger events (see Materials and Methods). Amplitude distributions from EEG signals start to deviate from a Gaussian distribution for deflections larger than 4 SD (Fig. 1A). For the detection of coherence potentials we therefore focused on a threshold of ±4 SD throughout the paper. Systematic exploration of other thresholds around ±4 SD verified that results were independent of the exact choice of threshold (Fig. 2C,D). Figure 1B shows some exemplary trigger events, their mean duration in all subjects was 468 ± 5 ms. Next, segments of the same length and with high similarity to trigger events were located. Potentials were considered similar to a trigger event when their correlation R was equal to or greater than 0.75 (see Materials and Methods). Again, systematic analysis with different R values confirmed that results were robust over a range of values (Fig. 2C,D).
Figure 2.

Changes in the organization of neuronal avalanches with increasing duration of wakefulness. A, The probability distribution of cascade sizes S deviates from a power-law distribution in the tail (arrow) after sustained wakefulness. Curves represent combined avalanches from a subject for the first four EEG recordings (blue, 0–9 h of wakefulness) and the last four recordings (red, 30–39 h of wakefulness). B, Both σn (branching parameter, left plot) and ΔDn (indexing the deviation from a power-law function, right plot) progressively increased during sustained wakefulness (hours 0–39) and return to lower values after recovery sleep (ps). Values were normalized to z-scores in each subject before averaging over the different subjects, which is denoted by subscripts n. Gray curves show the continuous measurements, the colored bars correspond to averages of the four EEG recordings at 0–9 h (blue) and at 30–39 h (red) of wakefulness. The plot in the middle shows absolute mean values of σ over all individuals without prior normalization of the data at the beginning of sleep deprivation (blue) and toward the end (red). Error bars indicate SE. Parameters were Δt = 39 ms, threshold = 4.0, r = 0.75; p values indicate the difference between red and blue bars (two-tailed paired t test). C, The increase in σn (gray bars) and ΔDn (brown bars) is illustrated as the difference (Diff) between values at the end (30–39 h of wakefulness) and the beginning (0–9 h) of the sleep deprivation period. Positive values therefore indicate an increase of σn or ΔDn in the course of sleep deprivation, which was significant for a broad range of thresholds (th) and correlations (R, *p ≤ 0.05, **p ≤ 0.01; two-tailed paired t test). D, Recovery after sleep. Bars illustrate the decrease in σn (gray bars) and ΔDn (brown bars) after recovery sleep (ps) compared with the last value of the sleep deprivation period (after 39 h of wakefulness). Negative values therefore indicate a decrease of σn or ΔDn after recovery sleep following the 40 h sleep deprivation period. Differences were significant over a range of parameters.
We observed these coherence potentials to organize in cascades of continuous events in time and space (n = 59258 cascades; Fig. 1C). Cascade sizes exhibited a high degree of variability. At the beginning of the sleep deprivation period, the probability distribution of cascade sizes S closely followed a power-law function p(S) ∼ Sα with α close to −3/2 (Fig. 1D). The total number of EEG channels determined the observed cutoff of the power-law function at ∼27. In line with reports of neuronal avalanches observed in other model and experimental systems (Beggs and Plenz, 2003; Priesemann et al., 2013; Shriki et al., 2013), the distribution of cascade sizes remained a power-law distribution for different bin sizes Δt with shallower slopes for larger Δt. Conversely, phase shuffling of the data destroyed the power-law distribution indicating that the long-range spatiotemporal correlations were captured by the power-law distribution of cascade sizes (Fig. 1D). Along with a power-law exponent of ∼−3/2, we observed the branching parameter, i.e., the ratio of descendant events to ancestor events, to be σ = 1.17 ± 0.03 (Fig. 2B).
Sustained wakefulness leads to changes in the distribution of cascade sizes and branching parameter σ
With increasing duration of sustained wakefulness, we observed changes in the distributions of cascade sizes. During prolonged wakefulness the probability for larger cascade sizes increased giving rise to a shallower power-law slope with a heavier tail in the distribution (Fig. 2A). We quantified the deviation of the distribution's tail from a power-law function with exponent α = −3/2 and calculated ΔD by combining cascade sizes into one distribution for each subject and EEG session (see Materials and Methods). To account for differences in absolute values between subjects, ΔD and σ values were first transformed into z-scores, i.e., subtraction of the mean and division by the SD, for each individual before averaging over subjects. Regardless of the underlying distribution, z-scores reflect performance relative to some group, rather than relative to an absolute standard. We denote the normalized data by subscript n throughout the paper. With growing time awake ΔD progressively increased. Similarly, the branching parameter σ increased during sustained wakefulness. Figure 2B illustrates the evolution of the two metrics as a function of time awake.
To statistically evaluate the changes of ΔD and σ in the course of sleep deprivation we averaged the values of the first four recordings (0–9 h awake) and compared them to the corresponding averages over the last four recordings (30–39 h awake). The increase in both metrics was significant for a wide range of correlations R and thresholds (Fig. 2C; bar heights reflect the difference of average metrics at 30–39 h and at 0–9 h, two-tailed paired t test). The return of σ and ΔD to lower values after recovery sleep was similarly observed across a broad range of parameters (significant decrease of values after recovery sleep compared with the value after 39 h of wakefulness; two-tailed paired t test; Fig. 2D). In absolute values, σ increased from 1.17 ± 0.03 during the first four EEG recordings (0–9 h awake) to 1.45 ± 0.09 at the end of the sleep deprivation period (30–39 h awake; Fig. 2B, middle).
We also derived cascades of activity using only events with a positive or negative excursion larger than a certain threshold as previously reported (Palva et al., 2013; Shriki et al., 2013). Using only the threshold as an event detection criterion substantially lowered the number of detected events and cascade sizes when compared with the approach involving coherence potentials (5992 cascades vs 59,258 cascades using coherence potentials). This alternative approach similarly produced power-laws of cascade sizes and a significant increase of σ with increasing duration of sleep deprivation (Fig. 3).
Figure 3.

Changes in the organization of neuronal avalanches identified by large deflections. As an alternative approach, neuronal avalanches were identified as large positive or negative deflections (≥±3.8 SD) at single EEG channels and combined into spatiotemporal cascades on the channel array (binning size Δt = 39 ms). A, The probability distribution of cascade sizes S follows a power-law distribution with an exponent of ≈−3/2 (gray dashed line). Curves represent combined avalanches from a subject for the first four EEG recordings (blue, 0–9 h of wakefulness) and the last four recordings (red, 30–39 h of wakefulness). A weak tendency for an increase in the distribution's tail can be observed after prolonged wakefulness (black arrow). B, Increase of the branching parameter σ during sustained wakefulness. The plot shows the average over all eight subjects. Values were transformed to z-scores in each subject before averaging over the different subjects, which is denoted by subscript n. Gray curves show the continuous measurements, the colored bars correspond to averages of the four EEG recordings at 0–9 h (blue) and at 30–39 h (red) of wakefulness; p values indicate the difference between red and blue bars (two-tailed paired t test).
Decreasing variability and increase of mean synchrony during sustained wakefulness
The extent and variability of synchrony has been demonstrated to be sensitive to the balance between excitation and inhibition similar to cascades of activity (Yang et al., 2012). Given the changes observed in the distribution of cascade sizes and σ in our data during sustained wakefulness, we next investigated whether these were accompanied by corresponding alterations in synchronization metrics. We calculated mean and variability of synchrony from the same artifact-free segments used for the analysis of coherence potentials during the eyes-open condition. In our analysis we focused on the alpha and theta frequency bands since power changes in these bands during wake were found to be associated with sleep propensity (Torsvall and Akerstedt, 1987; Cajochen et al., 1995; Aeschbach et al., 1999; Finelli et al., 2000; Strijkstra et al., 2003). During sustained wakefulness we observed an increase in mean synchrony as a function of time awake in the alpha band while the variability of synchrony quantified by its entropy decreased significantly (Fig. 4). After consecutive recovery sleep (ps) both metrics recovered in the direction of initial values. Interestingly, no significant changes were observed in the theta band for the eyes-open condition. Extending our analysis to the eyes-closed condition in the theta band revealed similar, albeit weaker changes than in the alpha band in both synchronization metrics indicating the observed effects to occur predominantly in the alpha band.
Figure 4.

Changes in synchronization measures with growing sleep deprivation. A, Mean synchrony <r(t)> increased during sustained wakefulness. B, The variability of synchronization measured by its entropy decreased as a function of time awake. The plots show the averages over all eight subjects in the alpha band during the eyes-open condition. Again, values were transformed to z-scores in each subject before averaging over the different subjects, which is denoted by subscript n. Gray curves show the continuous measurements, the colored bars correspond to averages of the four EEG recordings at 0–9 h (blue) and at 30–39 h (red) of wakefulness; p values indicate the difference between red and blue bars (two-tailed paired t test).
The initially low mean and high variability of synchrony in our data closely resemble the findings in Yang et al. (2012) where a maximum of phase synchrony was found to be associated with a balanced regime characterized by neuronal avalanches and the onset of synchrony.
Distribution of PLIs
To further test for changes in synchronization in the EEG we computed the distribution of PLIs. We calculated PLIs between all pairs of EEG derivations of the same artifact-free EEG segments during the eyes-open condition that were used for the derivation of coherence potentials and the analysis of the mean and variability of synchrony. The probability distribution of PLIs closely followed a power-law function p(PLI) ∼ PLI−α as reported previously (Gong et al., 2003; Kitzbichler et al., 2009) with estimated exponents α in the range of 2 to 2.5 (Fig. 5A). The distribution's p value based on the Kolmogorov–Smirnov statistic provides a measure of the plausibility of a power-law fit to the data (Clauset et al., 2009). Statistical analysis revealed high p values in many time intervals suggesting that the power-law hypothesis cannot be rejected. A recent comprehensive analysis of various fitting functions applied to PLI distributions had revealed a power-law function to be the most likely fit (Kitzbichler et al., 2009).
Figure 5.
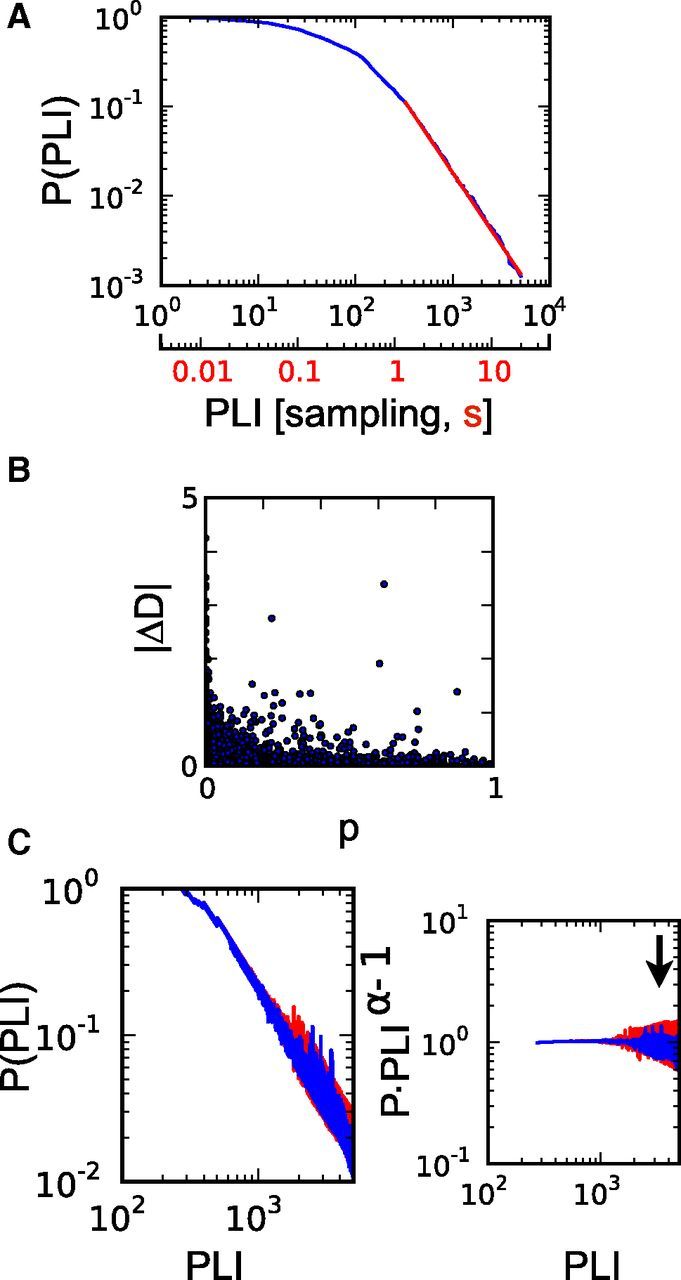
Analysis of PLI distributions of the alpha band (8–16 Hz) derived from EEG recordings in terms of p and ΔD values. The PLI distribution was derived from artifact-free intervals of a length 5000 sampling points (19.53 s) during periods with eyes open. A, As an example, the cumulative PLI probability distribution derived from the EEG recording of one subject after 3 h of wakefulness is depicted. PLIs are given as number sampling intervals (black) and in seconds (red). B, p and ΔD values provide metrics for the goodness-of-fit estimation of a power-law function (see Materials and Methods). With higher p values the number of |ΔD| values measuring a large deviation in the tail decreased. C, The distribution of PLIs changed during sustained wakefulness (sleep deprivation). Depicted are the average cumulative distributions of PLIs over all eight subjects from the first EEG recording (blue, 0 h of wakefulness) and after 39 h of time awake (red). With increasing time awake larger PLIs appeared, leading to a change in the distribution's tail (arrow), which becomes more visible when the distribution is transformed to the horizontal (right plot).
During prolonged wakefulness, we observed changes in the PLI distributions similar to the ones for cascades of coherence potentials. With increasing duration of sleep deprivation, the probability for longer PLIs increased (Fig. 5C) giving rise to an increasing deviation from a power-law distribution. ΔD (see Materials and Methods) again quantifies the deviation of the distribution's tail from a power-law function with exponent α. Both p and ΔD values can be regarded as complementary measures characterizing a power-law distribution with on average larger p values corresponding to smaller ΔD values (Fig. 5B). Our analysis was performed on cumulative distributions P(PLI), with α and PLImin being averaged values of the power-law fit of each participant's first EEG recording (0 h of wakefulness). To compare p and ΔD values and to account for differences in absolute values between subjects, values were first transformed to z-scores for each individual before averaging over subjects. Figure 6 shows normalized p values (left), ΔD (middle), and spectral power (right) averaged over all eight participants in the 8–16 Hz frequency band (alpha band; corresponding to scale 4; see Materials and Methods) and the 4–8 Hz frequency band (theta band; corresponding to scale 5). Along with time course at 3 h intervals, averages of values of the first (blue, 0–9 h of wakefulness) and last four recording sessions (red, 30–39 h of wakefulness) are illustrated. With increasing duration of sleep deprivation the PLI distributions deviated stronger from a power-law distribution (as quantified by the decrease in p values) showing a larger tail (captured by the increase in ΔD values). The change in both measures was significant for the alpha band (two-tailed paired t test; Fig. 6A) and qualitatively also observed in the theta band (Fig. 6B). Similar to the cascade size of coherence potentials, the observed changes correspond to the increasing incidence of larger events compared with scale-free activity observed earlier in the course of sustained wakefulness.
Figure 6.

Changes in the PLI distributions during sustained wakefulness (sleep deprivation). A, Evolution of p values (left), ΔD (middle), and spectral power (right) as a function of time awake (0–39 h) and after recovery sleep (ps) in the alpha band. Data for each individual were transformed to z-scores before averaging over all eight subjects (indicated by subscript n). The decrease in p and increase in ΔD values in terms of comparison of average values at the beginning (0–9 h of waking, blue bars) and at the end (30–39 h of waking, red bars) of sleep deprivation were significant (two-tailed paired t test, p values are depicted in each section). In contrast, the spectral power derived from derivation C3A2 showed a circadian behavior with no significant trend as a function of time awake (plot on the right; note the period of ∼24 h). B, Evolution of p values, ΔD, and spectral power in the theta band. Similar to the alpha band, however, not significant, a decrease for p values (left) and increase for ΔD (middle) as a function of time awake can be observed whereas spectral power showed a significant increase over time (right).
Previously, changes in EEG spectral power have been described in the alpha and theta bands during sustained wakefulness (Torsvall and Akerstedt, 1987; Cajochen et al., 1995; Aeschbach et al., 1999; Finelli et al., 2000; Strijkstra et al., 2003). The time-dependent changes in the metrics of PLI distributions as well as mean and variability of synchronization in these two frequency bands (scales) differed from prior observations in the time course of spectral power in the corresponding frequency bands during sleep deprivation. Normalized power calculated from derivation C3A2 for the same EEG segments showed a predominantly circadian pattern for the alpha band (Fig. 6A, right plot; note the period of ∼24 h in spectral power) and a circadian component superimposed on an increasing trend for the theta band (Fig. 6B, right plot) similar to previously reported data (Aeschbach et al., 1999; Finelli et al., 2000) while the indices p and ΔD quantifying the PLI and also coherence potential distribution as well as the other metrics σ, <r(t)> and H(r(t)) exhibited a more monotonic trend.
Correlation of EEG indices to subjective alertness
Self-rated alertness declined significantly with increasing time awake (Fig. 7A). Before averaging over subjects, alertness scales were transformed to z-scores for each subject in the same way as the EEG indices. To compare its evolution with EEG indices, we calculated their correlation coefficients R for which we used averaged data over all subjects (Fig. 7B; see Materials and Methods). Similar to a previous report (Finelli et al., 2000), theta power and alertness were negatively correlated (r = −0.94) and exhibited the largest absolute correlation value of all indices. The avalanche metrics and synchronization measures also exhibited a high correlation with alertness. From these indices, σ correlated best with alertness (r = −0.77).
Figure 7.

A, Self-rated alertness decreases with growing sleep deprivation. Gray curves show the continuous measurements, the colored bars correspond to averages of the four EEG recordings at 0–9 h (blue) and at 30–39 h (red) of wakefulness; p values indicate the difference between red and blue bars (two-tailed paired t test). B, Of all metrics, theta spectral power and σ exhibit the highest correlation with alertness as quantified by the absolute correlation coefficient |R|.
Discussion
In the present work, we reported several changes in EEG indices during sustained wakefulness: the organization of cascade sizes of coherence potentials, the mean and variability of synchronization, and the distribution of PLIs. These indices changed as a function of time awake and recovered toward baseline values after subsequent recovery sleep. The changes in synchronization measures (mean synchronization, variability of synchronization, and distribution of PLIs) were most predominant in the alpha band. This is in contrast to the changes in spectral EEG power as a marker of sleep propensity, which are most evident in the theta band (Finelli et al., 2000). Thus, the changes in synchronization cannot be explained as a direct consequence of the alterations in spectral power.
At the beginning of the sleep deprivation period coherence potentials in the EEG were organized as neuronal avalanches, i.e., events in space and time characterized by a power-law size distribution with exponent close to −3/2 and branching parameter of ∼1 (σ = 1.17). Neuronal activity patterns following a power-law size distribution with exponent −3/2, a lifetime distribution with power-law exponent −2, and a branching ratio of 1 have previously been interpreted as an indication that cortical neuronal networks operate at criticality (Beggs and Plenz, 2003; Larremore et al., 2011; Friedman et al., 2012; Palva et al., 2013; Shriki et al., 2013). This conclusion is based on insights derived from theoretical models of systems poised at a phase transition exhibiting the same scaling laws. The case of neuronal avalanches refers to a critical branching process giving rise to scale-free avalanches of activity and avoiding activity regimes comprising only either large or small parts of a network (Bak and Paczuski, 1995). This balanced propagation of activity is also reflected in the branching parameter, which in such a case is expected to be exactly 1. Although close to 1, we observed a baseline branching parameter of 1.17, which could be caused by uncertainty in its exact determination or, if taken by itself, indicate a slightly supercritical state.
With increasing duration of wakefulness, both size distributions of coherence potentials and PLIs increased in tail as measured by ΔD and p values in the case of PLIs. For the neuronal avalanches we observed a coincidental increase in σ, defined as the ratio between descendant events to ancestor events. Furthermore, mean synchronization increased while its variability decreased.
A critical branching process provides an interesting framework connecting these seemingly different observations. It was recently shown that power-law neuronal avalanches are accompanied by a maximum of synchronization variability in vitro and in modeling systems (Yang et al., 2012). Conversely, disinhibited networks exhibited cascades of activity with an imbalance toward larger avalanches, which coincided with decreased variability in synchronization and increased mean of synchronization in some metrics. These findings closely resemble the observations in our data. In the context of a critical branching process they can be interpreted in the sense that network activity is increasingly shifted toward a state in which larger events prevail in the dynamics, unlike in the critical state with scale-free avalanches of activity and high variability of synchronization.
The balance between excitation and inhibition depends crucially on synaptic strength in neuronal systems. It was recently demonstrated that a reduction of inhibitory synaptic transmission by application of GABA receptor blockers resulted in an artificial imbalance toward excitation related to a supercritical regime with larger neuronal avalanches than predicted by a power-law characteristic (Beggs and Plenz, 2003; Shew et al., 2009). Although the changes in such pharmacologically disinhibited networks were more drastic than what we observed, they qualitatively well correspond to alterations in the distribution of neuronal avalanches and σ reported here. Indirect evidence for changes in excitability and synaptic strength during wake and sleep comes from observations in the EEG, where power changes in the theta and alpha bands during wake were found to be associated with sleep propensity (Torsvall and Akerstedt, 1987; Cajochen et al., 1995; Aeschbach et al., 1999; Finelli et al., 2000; Strijkstra et al., 2003) and slow-wave activity during sleep to be associated with sleep intensity reflecting a regulatory process termed sleep homeostasis (Achermann and Borbély, 2011). Tononi and Cirelli (2003, 2006) hypothesized that synaptic homeostasis is underlying sleep homeostasis: synaptic strength is high at the beginning of a night, due to plastic processes occurring during waking, and decreases by means of synaptic downscaling during sleep. Recent investigations of changes in synaptic strength in Drosophila (Bushey et al., 2011) and neuronal excitability in human cortex (Huber et al., 2012) support the hypothesis by providing evidence of structural changes occurring in neuronal networks during waking and their reorganization during sleep. It is conceivable that the increase in excitability of cortical circuits caused by the buildup in synaptic strength provides the cellular basis for the observed shift away from critical dynamics in the course of wakefulness. Similarly, rebalancing and synaptic downscaling during sleep could tune network dynamics back to criticality. However, a plausible hypothesis for the detailed mechanisms, how the changes in synaptic strength could induce the observed changes both in spectral power and in the signatures of criticality, is still missing. From a clinical perspective, disinhibited networks are reminiscent of epileptic seizures where activity engages most of the network. In fact, for many forms of epilepsy sleep deprivation is known to increase the probability of seizure occurrence (Ellingson et al., 1984).
Power-law probability distributions of PLIs between pairs of neurophysiological time series were recently studied (Kitzbichler et al., 2009; Meisel et al., 2012) and interpreted as signatures of criticality in human brain dynamics. Evidence for power-law PLI distributions as an indicator for criticality derives from computational models, which show power-law PLI distributions at the transition between an ordered and a disordered phase, i.e., when they are in a critical state (Kitzbichler et al., 2009; Meisel et al., 2012). A PLI power-law distribution can, however, also arise when systems are away from a phase transition making the PLI distribution a sensitive but not specific indicator for critical dynamics (Botcharova et al., 2012). A clear power-law PLI distribution in neurophysiological data can, as any power-law scaling (Touboul and Destexhe, 2010; Beggs and Timme, 2012), therefore only be seen as an indication for the possibility of a phase transition. In our case, this indication is further supported by the simultaneous detection of neuronal avalanches in coherence potentials following a power-law distribution with exponent −3/2, a σ of 1.17, and high variability in synchronization. Conversely, PLI probability distributions with a large tail and weak power-law statistics along with similar changes in the distribution of neuronal avalanches and a σ much larger than 1 together with reduced variability of synchronization support the conclusion that the system is not directly located at a critical state.
It was previously hypothesized that normal activity is located in a slightly subcritical regime and that sleep could function to establish a safety margin by reorganizing activity toward it while wakefulness drives it closer to criticality (Pearlmutter and Houghton, 2009). A recent analysis of neuronal avalanches from human intracranial depth recordings in fact implied that the human brain might not operate at criticality directly but in a somewhat subcritical regime (Priesemann et al., 2013). While we cannot exclude the possibility that network activity in the brain is poised in a slightly subcritical regime, when interpreted in the context of criticality, the fading power-law statistics of the PLI distribution, the increase of σ to values much larger than 1, and the decrease in variability of synchronization in our opinion provide more support to the notion that cortical networks are near or at a critical state initially and shift toward a supercritical regime during wakefulness. Furthermore, the characteristic changes of synchronization metrics accompanying the alterations in the power-law characteristics of neuronal avalanches suggest a growing deviation from criticality as a function of time awake instead of the system remaining critical with a different exponent as could be concluded by looking solely at the distribution of neuronal avalanches.
Critical dynamics are often regarded to support optimal computational functioning (Langton, 1990; Bertschinger and Natschläger, 2004; Haldeman and Beggs, 2005; Kinouchi and Copelli, 2006; Shew et al., 2009, 2011). The observation of fading signatures of critical dynamics during prolonged wakefulness and their correlation to alertness could provide an interesting link to behavioral observations of impaired cognitive functioning and information processing after sleep deprivation (Banks and Dinges, 2007). Our findings support the intriguing hypothesis that sleep might serve to reorganize cortical network dynamics to a critical state thereby assuring optimal computational capabilities for the time awake.
Footnotes
The study was supported by the Swiss National Science Foundation Grant 320030-130766 (P.A.) and by the European Community's Seventh Framework Programme (FP7/2007-2013) under Grant agreement no. 258749 (E.O.). We thank Thilo Gross for comments on an earlier version of this manuscript.
References
- Achermann P, Borbély AA. Sleep homeostasis and models of sleep regulation. In: Kryger MH, Roth T, Dement WC, editors. Principles and practice of sleep medicine. Ed 5. St. Louis MO: Elsevier Saunders; 2011. pp. 431–444. [Google Scholar]
- Aeschbach D, Matthews JR, Postolache TT, Jackson MA, Giesen HA, Wehr TA. Two circadian rhythms in the human electroencephalogram during wakefulness. Am J Physiol. 1999;277:R1771–R1779. doi: 10.1152/ajpregu.1999.277.6.R1771. [DOI] [PubMed] [Google Scholar]
- Bak P, Paczuski M. Complexity, contingency, and criticality. Proc Natl Acad Sci U S A. 1995;92:6689–6696. doi: 10.1073/pnas.92.15.6689. [DOI] [PMC free article] [PubMed] [Google Scholar]
- Banks S, Dinges DF. Behavioral and physiological consequences of sleep restriction. J Clin Sleep Med. 2007;3:519–528. [PMC free article] [PubMed] [Google Scholar]
- Beggs JM, Timme N. Being critical of criticality in the brain. Front Physiol. 2012;3:163. doi: 10.3389/fphys.2012.00163. [DOI] [PMC free article] [PubMed] [Google Scholar]
- Beggs JM, Plenz D. Neuronal avalanches in neocortical circuits. J Neurosci. 2003;23:11167–11177. doi: 10.1523/JNEUROSCI.23-35-11167.2003. [DOI] [PMC free article] [PubMed] [Google Scholar]
- Beggs JM, Plenz D. Neuronal avalanches are diverse and precise activity patterns that are stable for many hours in cortical slice cultures. J Neurosci. 2004;24:5216–5229. doi: 10.1523/JNEUROSCI.0540-04.2004. [DOI] [PMC free article] [PubMed] [Google Scholar]
- Benayoun M, Kohrman M, Cowan J, van Drongelen W. EEG, temporal correlations, and avalanches. J Clin Neurophysiol. 2010;27:458–464. doi: 10.1097/WNP.0b013e3181fdf8e5. [DOI] [PubMed] [Google Scholar]
- Bertschinger N, Natschläger T. Real-time computation at the edge of chaos in recurrent neural networks. Neural Comput. 2004;16:1413–1436. doi: 10.1162/089976604323057443. [DOI] [PubMed] [Google Scholar]
- Botcharova M, Farmer SF, Berthouze L. Power-law distribution of phase-locking intervals does not imply critical interaction. Phys Rev E Stat Nonlin Soft Matter Phys. 2012;86 doi: 10.1103/PhysRevE.86.051920. 051920. [DOI] [PubMed] [Google Scholar]
- Bushey D, Tononi G, Cirelli C. Sleep and synaptic homeostasis: structural evidence in drosophila. Science. 2011;332:1576–1581. doi: 10.1126/science.1202839. [DOI] [PMC free article] [PubMed] [Google Scholar]
- Cajochen C, Brunner DP, Kräuchi K, Graw P, Wirz-Justice A. Power density in theta/alpha frequencies of the waking EEG progressively increases during sustained wakefulness. Sleep. 1995;18:890–894. doi: 10.1093/sleep/18.10.890. [DOI] [PubMed] [Google Scholar]
- Chialvo DR. Emergent complex neural dynamics. Nat Phys. 2010;6:744–750. doi: 10.1038/nphys1803. [DOI] [Google Scholar]
- Clauset A, Shalizi CR, Newman MEJ. Power-law distributions in empirical data. SIAM Rev Soc Ind Appl Math. 2009;51:661–703. [Google Scholar]
- de Carvalho JX, Prado CP. Self-organized criticality in the Olami-Feder-Christensen model. Phys Rev Lett. 2000;84:4006–4009. doi: 10.1103/PhysRevLett.84.4006. [DOI] [PubMed] [Google Scholar]
- Ellingson RJ, Wilken K, Bennett DR. Efficacy of sleep deprivation as an activation procedure in epilepsy patients. J Clin Neurophysiol. 1984;1:83–101. doi: 10.1097/00004691-198401000-00005. [DOI] [PubMed] [Google Scholar]
- Finelli LA, Baumann H, Borbély AA, Achermann P. Dual electroencephalogram markers of human sleep homeostasis: correlation between theta activity in waking and slow-wave activity in sleep. Neuroscience. 2000;101:523–529. doi: 10.1016/S0306-4522(00)00409-7. [DOI] [PubMed] [Google Scholar]
- Fraiman D, Balenzuela P, Foss J, Chialvo DR. Ising-like dynamics in large-scale functional brain networks. Phys Rev E Stat Nonlin Soft Matter Phys. 2009;79 doi: 10.1103/PhysRevE.79.061922. 061922. [DOI] [PMC free article] [PubMed] [Google Scholar]
- Friedman N, Ito S, Brinkman BAW, Shimono M, DeVille RE, Dahmen KA, Beggs JM, Butler TC. Universal critical dynamics in high resolution neuronal avalanche data. Phys Rev Lett. 2012;108:208102. doi: 10.1103/PhysRevLett.108.208102. [DOI] [PubMed] [Google Scholar]
- Gireesh ED, Plenz D. Neuronal avalanches organize as nested theta-and beta/gamma-oscillations during development of cortical slice cultures. Proc Natl Acad Sci U S A. 2008;105:7576–7581. doi: 10.1073/pnas.0800537105. [DOI] [PMC free article] [PubMed] [Google Scholar]
- Gong P, Nikolaev AR, van Leeuwen C. Scale-invariant fluctuations of the dynamical synchronization in human brain electrical activity. Neurosci Lett. 2003;336:33–36. doi: 10.1016/S0304-3940(02)01247-8. [DOI] [PubMed] [Google Scholar]
- Haldeman C, Beggs JM. Critical branching captures activity in living neural networks and maximizes the number of metastable states. Phys Rev Lett. 2005;94 doi: 10.1103/PhysRevLett.94.058101. 058101. [DOI] [PubMed] [Google Scholar]
- Huber R, Mäki H, Rosanova M, Casarotto S, Canali P, Casali AG, Tononi G, Massimini M. Human cortical excitability increases with time awake. Cereb Cortex. 2012;23:332–338. doi: 10.1093/cercor/bhs014. [DOI] [PMC free article] [PubMed] [Google Scholar]
- Kinouchi O, Copelli M. Optimal dynamical range of excitable networks at criticality. Nat Phys. 2006;2:348–351. doi: 10.1038/nphys289. [DOI] [Google Scholar]
- Kitzbichler MG, Smith ML, Christensen SR, Bullmore E. Broadband criticality of human brain network synchronization. PLoS Comput Biol. 2009;5:e1000314. doi: 10.1371/journal.pcbi.1000314. [DOI] [PMC free article] [PubMed] [Google Scholar]
- Langton CG. Computation at the edge of chaos: phase transitions and emergent computation. Physica D. 1990;42:12–37. doi: 10.1016/0167-2789(90)90064-V. [DOI] [Google Scholar]
- Larremore DB, Shew WL, Restrepo JG. Predicting criticality and dynamic range in complex networks: effects of topology. Phys Rev Lett. 2011;106 doi: 10.1103/PhysRevLett.106.058101. 058101. [DOI] [PubMed] [Google Scholar]
- Linkenkaer-Hansen K, Nikouline VV, Palva JM, Ilmoniemi RJ. Long-range temporal correlations and scaling behavior in human brain oscillations. J Neurosci. 2001;21:1370–1377. doi: 10.1523/JNEUROSCI.21-04-01370.2001. [DOI] [PMC free article] [PubMed] [Google Scholar]
- Meisel C, Storch A, Hallmeyer-Elgner S, Bullmore E, Gross T. Failure of adaptive self-organized criticality during epileptic seizure attacks. PLoS Comput Biol. 2012;8:e1002312. doi: 10.1371/journal.pcbi.1002312. [DOI] [PMC free article] [PubMed] [Google Scholar]
- Mignot E. Why we sleep: the temporal organization of recovery. PLoS Biol. 2008;6:e106. doi: 10.1371/journal.pbio.0060106. [DOI] [PMC free article] [PubMed] [Google Scholar]
- Palva JM, Zhigalov A, Hirvonen J, Korhonen O, Linkenkaer-Hansen K, Palva S. Neuronal long-range temporal correlations and avalanche dynamics are correlated with behavioral scaling laws. Proc Natl Acad Sci U S A. 2013;110:3585–3590. doi: 10.1073/pnas.1216855110. [DOI] [PMC free article] [PubMed] [Google Scholar]
- Pearlmutter BA, Houghton CJ. A new hypothesis for sleep: tuning for criticality. Neural Comput. 2009;21:1622–1641. doi: 10.1162/neco.2009.05-08-787. [DOI] [PubMed] [Google Scholar]
- Petermann T, Thiagarajan TC, Lebedev MA, Nicolelis MA, Chialvo DR, Plenz D. Spontaneous cortical activity in awake monkeys composed of neuronal avalanches. Proc Natl Acad Sci U S A. 2009;106:15921–15926. doi: 10.1073/pnas.0904089106. [DOI] [PMC free article] [PubMed] [Google Scholar]
- Plenz D. Neuronal avalanches and coherence potentials. Eur Phys J. 2012;205:259–301. [Google Scholar]
- Poil SS, Hardstone R, Mansvelder HD, Linkenkaer-Hansen K. Critical-state dynamics of avalanches and oscillations jointly emerge from balanced excitation/inhibition in neuronal networks. J Neurosci. 2012;32:9817–9823. doi: 10.1523/JNEUROSCI.5990-11.2012. [DOI] [PMC free article] [PubMed] [Google Scholar]
- Priesemann V, Valderrama M, Wibral M, Le Van Quyen M. Neuronal avalanches differ from wakefulness to deep sleep evidence from intracranial depth recordings in humans. PLoS Comput Biol. 2013;9:e1002985. doi: 10.1371/journal.pcbi.1002985. [DOI] [PMC free article] [PubMed] [Google Scholar]
- Ribeiro TL, Copelli M, Caixeta F, Belchior H, Chialvo DR, Nicolelis MA, Ribeiro S. Spike avalanches exhibit universal dynamics across the sleep-wake cycle. PLoS ONE. 2010;5:e14129. doi: 10.1371/journal.pone.0014129. [DOI] [PMC free article] [PubMed] [Google Scholar]
- Shew WL, Yang H, Petermann T, Roy R, Plenz D. Neuronal avalanches imply maximum dynamic range in cortical networks at criticality. J Neurosci. 2009;29:15595–15600. doi: 10.1523/JNEUROSCI.3864-09.2009. [DOI] [PMC free article] [PubMed] [Google Scholar]
- Shew WL, Yang H, Yu S, Roy R, Plenz D. Information capacity and transmission are maximized in balanced cortical networks with neuronal avalanches. J Neurosci. 2011;31:55–63. doi: 10.1523/JNEUROSCI.4637-10.2011. [DOI] [PMC free article] [PubMed] [Google Scholar]
- Shriki O, Alstott J, Carver F, Holroyd T, Henson RN, Smith ML, Coppola R, Bullmore E, Plenz D. Neuronal avalanches in the resting MEG of the human brain. J Neurosci. 2013;33:7079–7090. doi: 10.1523/JNEUROSCI.4286-12.2013. [DOI] [PMC free article] [PubMed] [Google Scholar]
- Strijkstra AM, Beersma DG, Drayer B, Halbesma N, Daan S. Subjective sleepiness correlates negatively with global alpha (8–12 Hz) and positively with frontal theta (4–8 Hz) frequencies in the human resting awake electroencephalogram. Neurosci Lett. 2003;340:17–20. doi: 10.1016/S0304-3940(03)00033-8. [DOI] [PubMed] [Google Scholar]
- Theiler J, Eubank S, Longtin A, Galdrikian B, Farmer JD. Testing for nonlinearity in time series: the method of surrogate data. Physica D. 1992;58:77–94. doi: 10.1016/0167-2789(92)90102-S. [DOI] [Google Scholar]
- Thiagarajan TC, Lebedev MA, Nicolelis MA, Plenz D. Coherence potentials: lossless, all-or-none network events in the cortex. PLoS Biol. 2010;8:e1000278. doi: 10.1371/journal.pbio.1000278. [DOI] [PMC free article] [PubMed] [Google Scholar]
- Tononi G, Cirelli C. Sleep and synaptic homeostasis: a hypothesis. Brain Res Bull. 2003;62:143–150. doi: 10.1016/j.brainresbull.2003.09.004. [DOI] [PubMed] [Google Scholar]
- Tononi G, Cirelli C. Sleep function and synaptic homeostasis. Sleep Med Rev. 2006;10:49–62. doi: 10.1016/j.smrv.2005.05.002. [DOI] [PubMed] [Google Scholar]
- Torsvall L, Akerstedt T. Sleepiness on the job: continuously measured EEG changes in train drivers. Electroencephalogr Clin Neurophysiol. 1987;66:502–511. doi: 10.1016/0013-4694(87)90096-4. [DOI] [PubMed] [Google Scholar]
- Touboul J, Destexhe A. Can power-law scaling and neuronal avalanches arise from stochastic dynamics? PLoS One. 2010;5:e8982. doi: 10.1371/journal.pone.0008982. [DOI] [PMC free article] [PubMed] [Google Scholar]
- Whitcher B, Craigmile PF, Brown P. Time-varying spectral analysis in neurophysiological time series using Hilbert wavelet pairs. Signal Processing. 2005;85:2065–2081. doi: 10.1016/j.sigpro.2005.07.002. [DOI] [Google Scholar]
- Worrell GA, Cranstoun SD, Echauz J, Litt B. Evidence for self-organized criticality in human epileptic hippocampus. Neuroreport. 2002;13:2017–2021. doi: 10.1097/00001756-200211150-00005. [DOI] [PubMed] [Google Scholar]
- Yang H, Shew WL, Roy R, Plenz D. Maximal variability of phase synchrony in cortical networks with neuronal avalanches. J Neurosci. 2012;32:1061–1072. doi: 10.1523/JNEUROSCI.2771-11.2012. [DOI] [PMC free article] [PubMed] [Google Scholar]
- Zapperi S, Bækgaard Lauritsen K, Stanley HE. Self-organized branching processes: mean-field theory for avalanches. Phys Rev Lett. 1995;75:4071–4074. doi: 10.1103/PhysRevLett.75.4071. [DOI] [PubMed] [Google Scholar]