

Abstract
Importance
Sporadic Alzheimer disease (AD) is caused in part by decreased clearance of the β-amyloid (Aβ) peptide breakdown products. Lipid-depleted (LD) apolipoproteins are less effective at binding and clearing Aβ, and LD Aβ peptides are more toxic to neurons. However, not much is known about the lipid states of these proteins in human cerebrospinal fluid.
Objective
To characterize the lipidation states of Aβ peptides and apolipoprotein E in the cerebrospinal fluid in adults with respect to cognitive diagnosis and APOE ε4 allele carrier status and after a dietary intervention.
Design
Randomized clinical trial.
Setting
Veterans Affairs Medical Center clinical research unit.
Participants
Twenty older adults with normal cognition (mean [SD] age, 69 [7] years) and 27 with amnestic mild cognitive impairment (67 [6] years).
Interventions
Randomization to a diet high in saturated fat content and with a high glycemic index (High diet;45% of energy from fat [>25% saturated fat], 35%-40%fromcarbohydrates with a mean glycemic index >70, and15%-20% from protein) or a diet low in saturated fat content and with a low glycemic index (Low diet; 25% of energy from fat [<7% saturated fat], 55%-60% from carbohydrates with a mean glycemic index <55, and 15%-20% from protein).
Main Outcomes and Measures
Lipid-depleted Aβ42 and Aβ40 and apolipoprotein E in cerebrospinal fluid.
Results
Baseline levels of LD Aβ were greater for adults with mild cognitive impairment compared with adults with normal cognition (LD Aβ42, P=.05; LD Aβ40, P=.01).These findings were magnified in adults with mild cognitive impairment and the ε4 allele, who had higher LD apolipoprotein E levels irrespective of cognitive diagnosis (P<.001). The Low diet tended to decrease LD Aβ levels, whereas the High diet increased these fractions (LD Aβ42, P=.01; LD Aβ40, P=.15). Changes in LD Aβ levels with the Low diet negatively correlated with changes in cerebrospinal fluid levels of insulin (LD Aβ42 and insulin, r= −0.68 [P=.01]; LD Aβ40 and insulin, r= −0.78 [P=.002]).
Conclusions and Relevance
The lipidation states of apolipoproteins and Aβ peptides in the brain differ depending on APOE genotype and cognitive diagnosis. Concentrations can be modulated by diet. These findings may provide insight into the mechanisms through which apolipoprotein E4 and unhealthy diets impart risk for developing AD.
INTRODUCTION
Sporadic Alzheimer Disease (AD) is caused in part by accumulation of β-amyloid (Aβ) peptides in the brain.1 These peptides can be bound to lipids or to lipid carrier proteins, such as apolipoprotein E (ApoE), or be free in solution (lipid-depleted [LD] Aβ).2 Levels of LD Aβ are higher in the plasma of adults with AD, but less is known about these peptides in the cerebrospinal fluid (CSF).2-5 Understanding the lipid environment in which Aβ exists—and understanding how to modulate that environment—is of interest because LD Aβ is more likely to form neurotoxic oligomers.6-8
One mechanism that could affect Aβ lipidation is to alter the concentration or function of the Aβ-binding apolipoproteins. Different alleles of APOE influence AD risk, with presence of an ε4 allele as a risk for AD (herein referred to as E4+ if present and E4− if absent), whereas the ε2 allele is protective.9 Adults with E4+ status have higher levels of brain amyloid, suggesting that the ApoE protein plays a role in Aβ clearance.10-12 Studies in cell culture and animals have shown that the function of ApoE depends on the degree to which it is associated with lipids (lipidation state) and that the ApoE4 isoform is less lipidated and less able to bind and clear Aβ.13-15 Little is known about LD ApoE in human CSF.
Another way to alter Aβ lipidation is through diet. Diets high in levels of saturated fat, cholesterol, and simple sugars have been implicated in AD pathogenesis16-19 and increase brain amyloid chemistry in animal models.20-24 Disrupted brain insulin signaling is thought to be one mechanism for how these diets affect the central nervous system because insulin may be involved in clearing Aβ.20,21,25,26 In a previously published diet intervention,27 we showed that a diet high in saturated fat content and with a high glycemic index (High diet) worsened CSF biomarkers of AD, lowered CSF insulin levels, and worsened visual memory, whereas a diet low in saturated fat content and with a low glycemic index (Low diet) had opposing effects.27 In our pilot study, we examine changes in LD ApoE and LD Aβ levels in the CSF of older adults at baseline and after diet intervention.
Herein we provide preliminary evidence that E4+ adults have higher basal levels of LD ApoE and that adults with mild cognitive impairment (MCI), particularly E4+ adults, have higher levels of LD Aβ. We also show that a High diet increases LD Aβ levels and that a Low diet has opposing effects. Furthermore, diet-induced changes in LD Aβ levels inversely correlate with changes in CSF insulin levels. These findings may provide insight into the mechanisms through which ApoE4 and unhealthy diets impart risk for developing AD.
METHODS
Study Participants
Study methods were published previously in detail.27This study was approved by the human subjects review committees of the University of Washington and the Veterans Affairs Puget Sound Health Care System. Written informed consent was obtained from all participants. All participants underwent a comprehensive neuropsychological battery. Participants with a delayed memory score of no more than 1.5 SDs from an estimate of their premorbid ability were considered for the diagnosis of amnestic MCI by expert consensus as per published criteria.28 Participants were excluded from the study if they had major psychiatric or neurologic disorders, alcoholism, renal or hepatic disease, diabetes mellitus, chronic obstructive pulmonary disease, unstable cardiac disease, or hyperlipidemia requiring cholesterol- lowering medication, including statins, fibrates, niacin, and fish oil. Each participant also underwent APOE genotyping.
Intervention
Study participants were randomized to receive the High or Low diet for 4 weeks. Participants and personnel involved in data collection were blinded to treatment. Blood and CSF samples were collected at baseline and week 4. The High diet provided 45% energy from total fat (25% from saturated fat), 35% to 40% from carbohydrates with a glycemic index greater than 70, and 15% to 20% from protein. The Low diet consisted of 25% energy from fat (<7% from saturated fat), 55% to 60% from carbohydrates with a glycemic index less than 55, and 15% to 20% from protein. Menus were created by a research nutritionist ( J.L.B.-C.) using commercially available software (ProNutra; VioCare Inc) to ensure adherence to macronutrient targets, and energy needs were calculated by averaging the Mifflin-St Jeor29 and Harris-Benedict equations30 as previously described. Diets were isocaloric, and weight remained stable for both diet groups. The glycemic index was calculated as described elsewhere.31 Adherence was assessed by having participants keep daily food records, and the number of nonadherent incidents (including failure to eat an entire item or eating an extra item) was small and comparable between diets (mean number of incidents per week, 1.49 for the Low diet vs 1.25 for the High diet).
Lumbar Puncture Procedure
Participants fasted for 12 hours before the procedure. The L4-L5 space was accessed with a 24-gauge Sprott spinal needle (Sprott; Pajunk), and 30 mL of CSF was withdrawn into sterile syringes. Samples were divided into aliquots in prechilled polyethylene tubes, immediately frozen with dry ice, and stored at −70°C until assays were performed.
CSF Markers
Total levels of ApoE, Aβ40, Aβ42, and insulin were measured by enzyme-linked immunosorbent assay as previously described.27 The LD fractions were separated by ultracentrifugation on a potassium bromide gradient of 1.25 g/mL at 120 000 rpm for 8 hours at 4°C.32 The top lipid-bound fractions were removed, and the bottom LD fractions containing LD ApoE, Aβ40, and Aβ42 were measured by enzyme-linked immunosorbent assay.
Statistical Analysis
For baseline analyses, we examined differences between groups using the x2 test for categorical variables and analysis of covariance for continuous variables, with E4 status (E4+ or E4-) and memory diagnosis (normal cognition or MCI) as the class variables and levels of total Aβ or ApoE as covariates. For diet analyses, we examined differences across the diet intervention using repeated-measures analysis of covariance, with time as the repeated factor, diet treatment and memory diagnosis as the between-subjects factors, and changes in total Aβ or ApoE levels as covariates. Significant effects were interpreted by examining changes from baseline. Pearson product moment correlations were used to assess the relationships among the CSF markers, and residual values from adjustment calculations were used to generate the scatterplots. For all analyses, LD Aβ and ApoE values were adjusted for total Aβ and ApoE levels, respectively, to determine whether differences in LD values existed in addition to differences in total levels. Sensitivity analyses that examined percentages of LD values relative to total values were also conducted. Levels of insulin, Aβ40, and Aβ42 were log transformed to achieve normal distributions. The covariates of age, sex, level of education, and baseline body mass index (and where indicated, baseline plasma glucose and insulin levels) were also included for all analyses but dropped if noncontributory. Significance was set at .05. We used commercially available statistical software for all analyses (SAS, version 9.2; SAS Institute, Inc).
RESULTS
Participant Characteristics
Participant characteristics are presented in Table 1. One participant with MCI randomized to the High diet had an unknown APOE status and was excluded from the baseline analysis. As expected, modified Mini-Mental State Examination scores were lower for adults with MCI compared with adults with normal cognition (P=.05). For the baseline analysis, the sex distribution differed among the groups (no male participants with normal cognition were in the E4+ group). For the intervention analysis, educational level differed among the groups; participants with normal cognition randomized to the Low diet had fewer years of education compared with the High diet group with normal cognition and the Low diet group with MCI (P<.05). Age, sex, educational level, and body mass index were included as covariates (and plasma glucose and insulin levels where indicated) and were not related to the pattern of any results.
Table 1.
Baseline Characteristics
| Baseline Analysis | Diet Analysis | |||||||
|---|---|---|---|---|---|---|---|---|
| Normal Cognition | MCI | Normal Cognition | MCI | |||||
| Variablea | E4− | E4+ | E4− | E4+ | Low | High | Low | High |
| No. of participants (No. female)b |
15 (8) | 5 (5 ) | 2 0 (9) | 6 (4 ) | 11 (7) | 9 (6) | 13 (7) | 14 (6) |
| Age, y | 69.8 (7.6) |
67.8 (7.0) |
66.3 (6.9) |
70.0 (4.6) |
69.7 (8.0) |
68.8 (7.0) |
66.2 (6.1) |
67.7 (7.0) |
| Education, yc |
14.6 (2.5) |
14 (1.4) |
15.3 (2.3) |
15.2 (1.8) |
13.5 (1.8) |
15.7 (2.2) |
15.4 (2.3) |
14.9 (2.3) |
| Modified MMSEd |
96.6 (2.8) |
98.8 (1.6) |
93.8 (4.5) |
94 (6.1) |
96.6 (2.6) |
97.8 (2.8) |
94.7 (5.1) |
93.3 (4.5) |
| BMI | 28.1 (4.3) |
26.8 (2.4) |
28.2 (3.7) |
25.1 (2.4) |
26.4 (2.6) |
29.5 (4.7) |
26.8 (4.0) |
27.8 (3.5) |
| Glucose level, mg/dLe |
102.2 (13.0) |
100.2 (16.3) |
98.9 (8.1) |
107.6 (7.9) |
102.3 (13.2) |
101.1 (14.6) |
103.9 (11.4) |
99.2 (5.7) |
| Insulin level, μIU/mLe |
14.9 (5.3) |
13.0 (4.8) |
13.3 (6.2) |
16.3 (6.3) |
13.4 (3.7) |
15.7 (6.5) |
13.6 (6.5) |
14.1 (6.0) |
Abbreviations: BMI, body mass index (calculated as weight in kilograms divided by height in meters squared); E4−, negative ε4 allele status; E4+, positive ε4 allele status; MCI, mild cognitive impairment; MMSE, Mini-Mental State Examination.
SI conversion factors: To convert glucose to millimoles per liter, multiply by 0.0555; insulin to picomoles per liter, multiply by 6.945.
One participant (in the MCI High diet group) had an unknown E4 status. Unless otherwise indicated, data are expressed as mean (SEM).
Groups differed by sex for baseline analysis; no male participants with normal cognition were in the E4+ group.
For the intervention analysis, educational level for Low diet group with normal cognition was lower than for the High diet group with normal cognition and the Low diet group with MCI (P<.05).
For both analyses, modified MMSE score was lower for adults with MCI than those with normal cognition (P = .05).
Indicates fasting plasma values.
Baseline Levels of LD Aβ Peptides
Log-transformed levels of LD Aβ adjusted for total Aβ levels were analyzed with analysis of covariance by cognitive diagnosis and E4 status. A significant effect was observed for cognitive diagnosis for LD Aβ40 and LD Aβ42 levels, indicating that adults with MCI had higher LD Aβ levels than did adults with normal cognition (LD Aβ42, P = .05 [Figure 1 A]; LD Aβ40, P = .01 [Figure 1B]). A trend was observed for the interaction of E4 status and cognitive diagnosis, particularly for LD Aβ40 level (LD Aβ42, P = .37; LD Aβ40, P = .11).To explore this trend, we compared least squares means, which revealed that LD Aβ42 levels were higher for E4+ adults with MCI than for E4− adults with normal cognition (P = .03 [Figure 1C]). Similarly, LD Aβ40 levels were higher for E4+ adults with MCI than for E4− (P = .01 [Figure 1D]) and E4+ (P = .01) adults with normal cognition and approached significance for E4+ than E4− adults with MCI (P = .06).
Figure 1.

Baseline analysis of lipid-depleted β-amyloid (LD Aβ) peptide by cognitive diagnosis and ε4 allele (E4) status. Graphs depict mean (SEM) log-transformed (Nat Log) values adjusted for total Aβ level. A, Adults with mild cognitive impairment (MCI) had higher LD Aβ42 levels than adults with normal cognition (P = .05). B, Adults with MCI had higher LD Aβ40 levels than adults with normal cognition (P = .01). C, Adults with positive E4 status (E4+) and MCI had higher LD peptide levels than adults with normal cognition and negative E4 status (E4-)42 (P = .03). D, Adults with E4+ status and MCI had higher LD Aβ40 levels compared with E4−- adults with normal cognition (P = .01), E4+ adults with normal cognition (P = .01), and E4− adults with MCI (P = .06).
The fraction of the total Aβ that was LD (calculated as [LD Aβ level/total Aβ level] × 100) was also analyzed and was again higher for E4+ adults with MCI (eTable 1; http://www.jamaneurology.com). For Aβ42, the percentages of LD levels for E4+ adults with MCI were higher than those of the E4− adults with MCI (P = .02) and E4− adults with normal cognition (P = .01). The fractions for the E4+ group with normal cognition (P = .06) approached statistical significance but did not achieve it. For Aβ40, the fractions of LD levels for E4+ adults with MCI were significantly higher than the percentages for the other 3 groups (P < .05).
Baseline Levels of LD ApoE
Levels of LD ApoE adjusted for total ApoE level were analyzed with analysis of covariance by cognitive diagnosis and E4 status. An overall effect for E4, but not for cognitive diagnosis, was observed; therefore, cognitive groups were combined. Levels of LD ApoE were statistically higher for E4+ compared with E4− adults (P < .001 [Figure 2A]) despite having similar total levels of ApoE (mean [SEM] level, 1030 [97] ng/mL for the E4+ group vs 1112 [60] ng/mL for the E4− group; P = .5). Next, the percentage of total ApoE that was LD was calculated ([LD ApoE level/total ApoE level] × 100) and was statistically higher for E4+ adults (56.7% [3.8%] compared with 30.2% [2.3%] for E4− adults; P < .001).
Figure 2.

Baseline analysis of lipid-depleted apolipoprotein E (LD ApoE) by genotype. Graphs depict mean (SEM) values adjusted for total ApoE level. A, Stratification by ε4 allele status (positive [E4+] or negative [E4−]) shows levels of LD ApoE were significantly higher for E4+ adults (P<.001). B, Stratification by 3 genotype levels shows that individuals in the E2 group had lower levels of LD ApoE than the E3 or E4 group (P = .2), whereas individuals in the E4 group had higher levels than the E3 or E2 group (P< .001).
To further explore the APOE genotype interaction with LD ApoE levels, we next stratified the results by 3 APOE genotype groups. Participants in the E2 group had ε2/ε2 or ε2/ε3 genotypes (n = 7); participants in the E3 group, ε3/ε3 genotype (n = 28); and participants in theE4 group, ε3/ ε4 or ε4/ε4 genotypes (n = 10). One participant with the ε2/ε4 genotype was excluded from this analysis. Figure 2B illustrates that the E4 group had the highest levels compared with the E2 and E3 group (P< .001), whereas the E2 group had the lowest levels of LD ApoE compared with the E3 group (P = .2).The same pattern was seen for the mean (SEM) fraction of LD ApoE, which was 56.9% (3.9%) for the E4 group (P < .001 compared with the E2 and E3 groups), 32.3% (2.6%) for the E3 group, and 22.2% (5.1%) for the E2 group (P = .08 compared with the E3 group). Our study enrolled 1 ε4/ε4participant (in the MCI group) whose LD ApoE proportion was 96%.
We next wanted to determine whether the depleted fractions of ApoE levels correlated with depleted fractions of Aβ levels. Pearson product moment correlations were used to assess the relationship between LD ApoE level adjusted for total ApoE level and LD Aβ40 and Aβ42 levels adjusted for total Aβ40 and Aβ42 levels. Residuals from the adjustment calculations were used to generate the scatterplot (Figure 3). We found that LD ApoE correlated with LD Aβ40 levels (r = 0.34 [P = .04]; Figure 3), but not LD Aβ42 levels (r = 0.04 [P = .80]).
Figure 3.

Scatterplot of lipid-depleted β-amyloid (LD Aβ40) peptide levels log transformed and adjusted for total Aβ40 level, compared with LD apolipoprotein E (ApoE) adjusted for total ApoE level. Baseline levels of LD Aβ40 directly correlated with baseline levels of LD ApoE (Pearson product moment correlation coefficient, 0.34 [P = .04]).
Diet Effects on CSF LD Peptides
Next, we analyzed the change in CSF Aβ peptide levels in response to the diet intervention by using repeated measures analysis of variance with cognitive diagnosis and diet treatment as class variables and change in total Aβ40 or Aβ42 level as covariates. Change scores from week 0 to week 4 were generated to display the data in graphical form (Figure 4). For LD Aβ42, the time X treatment interaction was significant, with the Low diet decreasing and the High diet increasing levels (Figure 4A; P = .01).The interaction among cognitive diagnosis X treatment X time was not significant (P = .68), indicating that similar patterns were observed for the normal cognition and MCI groups. This pattern was also seen for LD Aβ40, but the time X treatment interaction only approached significance (Figure 4B; P = .15), and the diagnosis X treatment X time effect again was not significant (P = .97). We also analyzed the change in the LD Aβ fractions and found that the Low diet decreased and the High diet increased LD Aβ40 fractions (P = .05).The Low diet also decreased LD Aβ42 fractions compared with the High diet, but the values only approached significance (P = .16) (eTable 2).
Figure 4.

Diet-induced changes (Δ) of β-amyloid (Aβ) peptides log transformed (Nat Log) and controlled for change in total Aβ levels. A, The diet with a low level of saturated fat and with a low glycemic index (Low diet) decreased lipid-depleted (LD) Aβ42 levels, whereas the diet with a high level of saturated fat and a high glycemic index (High diet) increased Aβ42 levels (P = .01). B, The Low diet decreased LD Aβ40 levels, whereas the High diet increased LD Aβ40 levels (P = .15).
Owing to small numbers in the E4+ group, we were unable to further analyze the diet intervention by E4 status. The diets did not significantly alter LD ApoE or LD ApoE fractions (eTable 2).
Correlations between Changes in LD Peptide and CSF Insulin Levels
In our previous study,27 we showed that the Low diet increased CSF insulin levels, whereas the High diet decreased them (P < .05). Pearson product moment correlations were used to analyze relationships between changes in CSF insulin and CSF LD Aβ levels. Residual change scores were constructed in which the variance due to baseline LD levels and the change in total levels were removed from week 4 LD values; thus, the residual score reflected the degree of diet-induced change in LD levels. Similar residual change scores were constructed for CSF insulin, in which the variance due to baseline levels was removed from week 4 values. For the Low diet, a higher CSF insulin level was associated with lower CSF LD Aβ levels for LD Aβ42 (Figure 5A; r = −0.68 [P = .01]) and for LD Aβ40 (Figure 5B; r = −0.78 [P = .002]). The correlations between the High diet changes were not significant (LD Aβ42 and insulin levels, r = 0.04 [P = .89]; LD Aβ40 and insulin levels, r = −0.33 [P = .18]). In addition to the covariates of age, sex, educational level, and baseline body mass index, we also analyzed plasma glucose and insulin levels as covariates, and they were not related to the pattern of these results.
Figure 5.
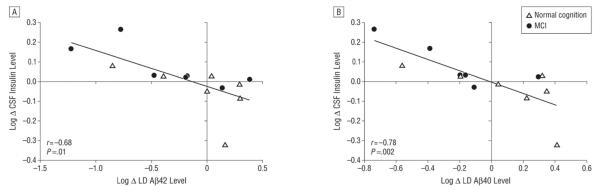
Scatterplots of the change in log-transformed (Log) cerebrospinal fluid (CSF) levels of lipid-depleted β-amyloid (LD Aβ42 and Aβ40) peptides adjusted for change in total peptide levels and compared with Log CSF insulin levels for individuals receiving a diet with a low level of saturated fat and a low glycemic index (Low diet). A, Change in CSF insulin levels inversely correlated with the change in LD Aβ42 levels (P = .01). B, Change in CSF insulin levels inversely correlated with the change in LD Aβ40 levels (P = .002). MCI indicates mild cognitive impairment.
DISCUSSION
Results from this pilot study suggest that adults with MCI have higher CSF LD Aβ levels, particularly if they also have E4+ status. We also show that E4+ adults have higher and E2+ adults have lower LD ApoE levels compared with E3 homozygotes. Together, these findings suggest that LD Aβ and LD ApoE are pathologic and that different APOE genotypes may modulate the risk for AD in part through alterations in ApoE lipidation. In addition, levels of LD ApoE correlate with levels of LD Aβ40. We also show that a dietary intervention modulated CSF levels of LD Aβ and that changes in LD Aβ levels inversely correlated with changes in CSF insulin levels. Therefore, altering LD fractions of Aβ may be one mechanism by which diets can increase or decrease AD risk. We have developed a hypothetical model of how APOE genotypes and diets may interact to affect binding and clearance of Aβ (Figure 6). A summary of our findings is noted in Table 2.
Figure 6.

Theoretical model of β-amyloid (Aβ) peptide and apolipoprotein E (ApoE) interaction in the central nervous system (CNS). In the top panel, when ApoE is more lipidated, such as with an ε2 allele (E2+) or a healthy diet, it may be more able to bind Aβ and facilitate its clearance and degradation. When ApoE is less lipidated, such as with the E4+ state or a diet with a high level of saturated fat and a high glycemic index (High diet), it may be less able to bind Aβ. In the bottom panel, when Aβ binds to carrier proteins, such as ApoE, it is more likely to be cleared by enzymatic degradation or by crossing the blood-brain barrier (BBB). However, when Aβ is not bound to proteins, it can form oligomers that are toxic to synapses and neurons. High diets may decrease Aβ-lipoprotein binding, which will increase the toxic forms of Aβ. Conversely, diets with low levels of saturated fat and glycemic index (Low diet) may enhance Aβ-lipoprotein binding, in part by raising CNS insulin levels to optimal.
Table 2.
Summary of Study Findingsa
| DIETb | |||
|---|---|---|---|
| Peptide | Baseline | Low | High |
| LD Aβ40 | ↑MCI, ↑ E4+ MCI | ↓ (NS) | ↑ (NS) |
| LD Aβ42 | ↑MCI, ↑ E4+ MCI | ↓ (Significant) | ↑ (Significant) |
| LD ApoE | ↑↑ for E4+ Adults | No change | No change |
Abbreviations: Aβ, β-amyloid; ApoE, apolipoprotein E; E4+, positive ε4 allele status; LD, lipid deleted; MCI, mild cognitive impairment; NS, not significant.
Arrows indicate increase (up) or decrease (down); 2 arrows, highly statistically significant findings (P < .001).
The Low diet includes low levels of saturated fat and glycemic index; the High diet, high levels of saturated fat and glycemic index.
Lipidation States of Amyloid Peptides
Impaired clearance of Aβ40 and Aβ42 is likely an important contributor to the development of sporadic AD.1 In vitro, oligomeric Aβ peptides that are unbound to lipoproteins (LD) are toxic to synapses and neurons.6-8 Patients with AD have higher levels of LD Aβ in the plasma,4,5,33 brain parenchyma,5 and CSF.3 Our results suggest that individuals with MCI also have higher CSF LD Aβ40 and Aβ42 levels compared with adults with normal cognition. Neuropathological samples from E4+ patients with AD show a higher amyloid plaque burden and higher synaptic oligomeric Aβ peptide levels than do samples from E4− adults, and herein we show that E4+ adults with MCI also have higher LD Aβ levels in the CSF.10,11,34 Although we did not directly determine whether these LD Aβ fractions are oligomers, a recent study suggests that LD Aβ fractions form oligomers in human brain tissue.5
Several epidemiological studies have linked a high intake of saturated fat and simple sugar with AD risk, but the mechanisms are largely unknown.16-19 High levels of low-density lipoprotein cholesterol were associated with higher LD Aβ levels in humans,35 and diets high in saturated fat levels in mice led to increased delivery of plasma Aβ across the blood-brain barrier.36,37 Herein we report that a diet consisting of high levels of saturated fat and high glycemic index carbohydrates increased levels of LD Aβ40 and Aβ42 in the CSF, and a diet with lower levels of these macronutrients decreased the fractions. These studies suggest that diets can impart AD risk or benefit through altering the lipid environment of Aβ.
Insulin and Aβ
Diets with high levels of saturated fat can cause insulin resistance, which is a risk factor for AD.38-40 Chronic peripheral hyperinsulinemia downregulates CNS insulin,41-44 and individuals with AD have reduced brain insulin activity, evidence of brain insulin resistance, and increased oligomeric Aβ levels.45-47 Insulin may help clear brain Aβ by increasing Aβ trafficking to the plasma membrane and downregulating Aβ binding sites.25,26 Conversely, Aβ oligomers disrupt insulin signaling in animal models.48-52 Therefore, once brain insulin is disrupted, Aβ oligomer levels tend to increase, setting up a vicious cycle. We have demonstrated that the High diet that promoted peripheral insulin resistance and decreased brain insulin levels27 also increased LD Aβ levels. Furthermore, changes in CSF insulin levels inversely correlated with changes in LD Aβ levels. Many pathways disrupted by altering CNS insulin levels are also altered in E4+ individuals, including decreased Aβ clearance, synapse loss, and increases in inflammation.53,54 Our results suggest that an optimal CSF insulin state from a healthy diet intervention or E4− status is associated with less toxic forms of CSF Aβ (Figure 6). Future studies that modulate CSF insulin with administration of intranasal insulin may be useful in clarifying the mechanisms for these findings.
Lipidation States of Apolipoproteins
Experimental manipulation of ApoE lipidation is emerging as a potential AD therapy. Mice treated with bexarotene, which upregulates the expression and lipidation of ApoE, demonstrated decreased levels of brain Aβ and improved scores on cognitive tasks.55 Work in vitro and in rodents has shown that the ApoE2 and ApoE3 isoforms are more lipidated and more efficient at binding Aβ and directing Aβ to degradation pathways.13,56-58 Conversely, the ApoE4 isoform is less lipidated and less able to bind and clear Aβ.59,60 Herein we provide evidence that E4+ adults have significantly less lipidated ApoE and that E2+ adults have more lipidation compared with E3 heterozygotes. We also show that levels of LD ApoE correlate with levels of LD Aβ40. These data support the theory that poorly lipidated ApoE is pathogenic. Why a similar relationship was not observed between LD ApoE and Aβ42 is unclear; future studies are needed to confirm this pattern and its possible significance.
We also show that, unlike mice that display lower levels of total ApoE when the protein is less lipidated,59,61-65 total ApoE4 is present at high levels in human CSF, which is in line with previous human studies.66,67 Thus, treatments that alter ApoE lipidation may work differently in humans, and the APOE genotype should be considered when analyzing these therapies.
Limitations
Owing to the intensive nature of our pilot study, the sample size was small, limiting our ability to analyze the effects of E4 status on diet response. Therefore, these data need to be replicated in a larger sample before drawing any firm conclusions. In addition, male participants were underrepresented in the E4+ group; therefore, sex effects could not be completely ruled out, although covarying for sex did not change the pattern of any result. The variability of CSF markers also limited the statistical significance of some of the findings. In addition, because of the ultracentrifuge protocol, samples underwent an additional freeze-thaw cycle before the measurement step, which may affect lipid-Aβ interactions. Baseline and 4-week samples were analyzed with this procedure, however, so how change over time would be influenced remains unclear because each participant served as his or her own control. Finally, our diet manipulated fat and carbohydrate levels; thus, we were unable to determine whether a single macronutrient class had a larger effect on Aβ lipidation.
CONCLUSIONS
These pilot findings suggest that E4+ individuals have significantly higher CSF LD ApoE levels than E4-individuals despite having similar total levels of ApoE and that E2+ individuals have less LD ApoE compared with other genotypes. We also show that adults with MCI have higher fractions of LD Aβ40 and Aβ42, particularly if they also have E4+ status, and that levels of LD Aβ40 correlated with LD ApoE. These preliminary data suggest that the LD fractions of ApoE and Aβ are pathogenic and that the APOE genotype should be considered when analyzing effects of AD treatments that act on lipidation.
We also demonstrate that a diet with a high level of saturated fat and a high glycemic index increases CSF LD Aβ levels, whereas a healthier diet decreases these fractions. These findings have implications not only for patients with AD but also for cognitively normal older adults who have risk factors for AD, such as E4+ status or insulin resistance. We also show that changes in LD Aβ peptide levels induced by diet moved in the opposite direction from CNS insulin levels, which may be one of the mechanisms for how diets impart AD risk or protection. Overall, these results suggest that the lipidation states of apolipoproteins and amyloid peptides might play a role in AD pathological processes and are influenced by APOE genotype and diet.
Supplementary Material
Acknowledgements
This study was supported by grant T32 AG-000258-13 and a Hartford Center of Excellence scholarship (Dr Hanson); by grants R37-AG-10880 (Dr Craft) and P50 AG-05136 (Dr Montine) from the National Institute on Aging; by the Nancy and Buster Alvord Endowment; and by the Department of Veterans Affairs.
Footnotes
Author Contributions: Study concept and design: Hanson, Bayer-Carter, Baker, and Craft. Acquisition of data: Bayer-Carter, Green, Montine, Baker, Bonner, Callaghan, Leverenz, Tsai, Postupna, Zhang, and Lampe. Analysis and interpretation of data: Hanson, Green, Wilkinson, Baker, Watson, Bonner, and Craft. Drafting of the manuscript: Hanson and Craft. Critical revision of the manuscript for important intellectual content: Bayer-Carter, Green, Montine, Wilkinson, Baker, Watson, Bonner, Callaghan, Leverenz, Tsai, Postupna, Zhang, and Lampe. Statistical analysis: Hanson. Obtained funding: Montine, Baker, Leverenz, and Craft. Administrative, technical, and material support: Bayer-Carter, Green, Wilkinson, Baker, Bonner, Callaghan, Zhang, and Lampe. Study supervision: Baker, Lampe, and Craft.
Conflicts of Interest: None reported.
REFERENCES
- 1.Hardy J, Selkoe DJ. The amyloid hypothesis of Alzheimer’s disease: progress and problems on the road to therapeutics. Science. 2002;297(5580):353–356. doi: 10.1126/science.1072994. [DOI] [PubMed] [Google Scholar]
- 2.Koudinov A, Matsubara E, Frangione B, Ghiso J. The soluble form of Alzheimer’s amyloid β protein is complexed to high density lipoprotein 3 and very high density lipoprotein in normal human plasma. Biochem Biophys Res Commun. 1994;205(2):1164–1171. doi: 10.1006/bbrc.1994.2788. [DOI] [PubMed] [Google Scholar]
- 3.Takamura A, Kawarabayashi T, Yokoseki T, et al. Dissociation of β -amyloid from lipoprotein in cerebrospinal fluid from Alzheimer’s disease accelerates β -amyloid-42 assembly. J Neurosci Res. 2011;89(6):815–821. doi: 10.1002/jnr.22615. [DOI] [PubMed] [Google Scholar]
- 4.Matsubara E, Ghiso J, Frangione B, et al. Lipoprotein-free amyloidogenic peptides in plasma are elevated in patients with sporadic Alzheimer’s disease and Down’s syndrome. Ann Neurol. 1999;45(4):537–541. [PubMed] [Google Scholar]
- 5.Matsubara E, Sekijima Y, Tokuda T, et al. Soluble Aβ homeostasis in AD and DS: impairment of anti-amyloidogenic protection by lipoproteins. Neurobiol Aging. 2004;25(7):833–841. doi: 10.1016/j.neurobiolaging.2003.10.004. [DOI] [PubMed] [Google Scholar]
- 6.Saavedra L, Mohamed A, Ma V, Kar S, de Chaves EP. Internalization of β-amyloid peptide by primary neurons in the absence of apolipoprotein E. J Biol Chem. 2007;282(49):35722–35732. doi: 10.1074/jbc.M701823200. [DOI] [PubMed] [Google Scholar]
- 7.Walsh DM, Selkoe DJ. Aβ oligomers: a decade of discovery. J Neurochem. 2007;101(5):1172–1184. doi: 10.1111/j.1471-4159.2006.04426.x. [DOI] [PubMed] [Google Scholar]
- 8.Larson ME, Lesne SE. Soluble Aβ oligomer production and toxicity. J Neurochem. 2012;120(suppl 1):125–139. doi: 10.1111/j.1471-4159.2011.07478.x. [DOI] [PMC free article] [PubMed] [Google Scholar]
- 9.Farrer LA, Cupples LA, Haines JL, et al. APOE and Alzheimer Disease Meta Analysis Consortium. Effects of age, sex, and ethnicity on the association between apolipoprotein E genotype and Alzheimer disease: a meta-analysis. JAMA. 1997;278(16):1349–1356. [PubMed] [Google Scholar]
- 10.Reiman EM, Chen K, Liu X, et al. Fibrillar amyloid- β burden in cognitively normal people at 3 levels of genetic risk for Alzheimer’s disease. Proc Natl Acad Sci U S A. 2009;106(16):6820–6825. doi: 10.1073/pnas.0900345106. [DOI] [PMC free article] [PubMed] [Google Scholar]
- 11.Walker LC, Pahnke J, Madauss M, et al. Apolipoprotein E4 promotes the early deposition of Aβ42 and then Aβ40 in the elderly. Acta Neuropathol. 2000;100(1):36–42. doi: 10.1007/s004010051190. [DOI] [PubMed] [Google Scholar]
- 12.Cole GM, Ard MD. Influence of lipoproteins on microglial degradation of Alzheimer’s amyloid beta-protein. Microsc Res Tech. 2000;50(4):316–324. doi: 10.1002/1097-0029(20000815)50:4<316::AID-JEMT11>3.0.CO;2-E. [DOI] [PubMed] [Google Scholar]
- 13.Fan J, Donkin J, Wellington C. Greasing the wheels of Aβ clearance in Alzheimer’s disease: the role of lipids and apolipoprotein E. Biofactors. 2009;35(3):239–248. doi: 10.1002/biof.37. [DOI] [PubMed] [Google Scholar]
- 14.Tokuda T, Calero M, Matsubara E, et al. Lipidation of apolipoprotein E influences its isoform-specific interaction with Alzheimer’s amyloid β peptides. Biochem J. 2000;348(pt 2):359–365. [PMC free article] [PubMed] [Google Scholar]
- 15.LaDu MJ, Falduto MT, Manelli AM, Reardon CA, Getz GS, Frail DE. Isoformspecific binding of apolipoprotein E to β-amyloid. J Biol Chem. 1994;269(38):23403–23406. [PubMed] [Google Scholar]
- 16.Berrino F. Western diet and Alzheimer’s disease [in Italian] Epidemiol Prev. 2002;26(3):107–115. [PubMed] [Google Scholar]
- 17.Gustaw-Rothenberg K. Dietary patterns associated with Alzheimer’s disease: population based study. Int J Environ Res Public Health. 2009;6(4):1335–1340. doi: 10.3390/ijerph6041335. [DOI] [PMC free article] [PubMed] [Google Scholar]
- 18.Whitmer RA, Gunderson EP, Quesenberry CP, Jr, Zhou J, Yaffe K. Body mass index in midlife and risk of Alzheimer disease and vascular dementia. Curr Alzheimer Res. 2007;4(2):103–109. doi: 10.2174/156720507780362047. [DOI] [PubMed] [Google Scholar]
- 19.Frisardi V, Solfrizzi V, Seripa D, et al. Metabolic-cognitive syndrome: a crosstalk between metabolic syndrome and Alzheimer’s disease. Ageing Res Rev. 2010;9(4):399–417. doi: 10.1016/j.arr.2010.04.007. [DOI] [PubMed] [Google Scholar]
- 20.Howland DS, Trusko SP, Savage MJ, et al. Modulation of secreted β-amyloid precursor protein and amyloid β-peptide in brain by cholesterol. J Biol Chem. 1998;273(26):16576–16582. doi: 10.1074/jbc.273.26.16576. [DOI] [PubMed] [Google Scholar]
- 21.Levin-Allerhand JA, Lominska CE, Smith JD. Increased amyloid-levels in APPSWE transgenic mice treated chronically with a physiological high-fat high-cholesterol diet. J Nutr Health Aging. 2002;6(5):315–319. [PubMed] [Google Scholar]
- 22.Sparks DL, Scheff SW, Hunsaker JC, III, Liu H, Landers T, Gross DR. Induction of Alzheimer-like β -amyloid immunoreactivity in the brains of rabbits with dietary cholesterol. Exp Neurol. 1994;126(1):88–94. doi: 10.1006/exnr.1994.1044. [DOI] [PubMed] [Google Scholar]
- 23.Kanoski SE, Meisel RL, Mullins AJ, Davidson TL. The effects of energy-rich diets on discrimination reversal learning and on BDNF in the hippocampus and prefrontal cortex of the rat. Behav Brain Res. 2007;182(1):57–66. doi: 10.1016/j.bbr.2007.05.004. [DOI] [PMC free article] [PubMed] [Google Scholar]
- 24.Takeda S, Sato N, Uchio-Yamada K, et al. Elevation of plasma β -amyloid level by glucose loading in Alzheimer mouse models. Biochem Biophys Res Commun. 2009;385(2):193–197. doi: 10.1016/j.bbrc.2009.05.037. [DOI] [PubMed] [Google Scholar]
- 25.Gasparini L, Gouras GK, Wang R, et al. Stimulation of β -amyloid precursor protein trafficking by insulin reduces intraneuronal β-amyloid and requires mitogen-activated protein kinase signaling. J Neurosci. 2001;21(8):2561–2570. doi: 10.1523/JNEUROSCI.21-08-02561.2001. [DOI] [PMC free article] [PubMed] [Google Scholar]
- 26.De Felice FG, Vieira MN, Bomfim TR, et al. Protection of synapses against Alzheimer’s-linked toxins: insulin signaling prevents the pathogenic binding of Aβ oligomers. Proc Natl Acad Sci U S A. 2009;106(6):1971–1976. doi: 10.1073/pnas.0809158106. [DOI] [PMC free article] [PubMed] [Google Scholar]
- 27.Bayer-Carter JL, Green PS, Montine TJ, et al. Diet intervention and cerebrospinal fluid biomarkers in amnestic mild cognitive impairment. Arch Neurol. 2011;68(6):743–752. doi: 10.1001/archneurol.2011.125. [DOI] [PMC free article] [PubMed] [Google Scholar]
- 28.Roberts RO, Geda YE, Knopman DS, et al. The Mayo Clinic Study of Aging: design and sampling, participation, baseline measures and sample characteristics. Neuroepidemiology. 2008;30(1):58–69. doi: 10.1159/000115751. [DOI] [PMC free article] [PubMed] [Google Scholar]
- 29.Mifflin MD, St Jeor ST, Hill LA, Scott BJ, Daugherty SA, Koh YO. A new predictive equation for resting energy expenditure in healthy individuals. Am J Clin Nutr. 1990;51(2):241–247. doi: 10.1093/ajcn/51.2.241. [DOI] [PubMed] [Google Scholar]
- 30.Harris JA, Benedict FG. A Biometric Study of Basal Metabolism in Man. Carnegie Institution of Washington; Washington, DC: 1919. [Google Scholar]
- 31.Wolever TM, Yang M, Zeng XY, Atkinson F, Brand-Miller JC. Food glycemic index, as given in glycemic index tables, is a significant determinant of glycemic responses elicited by composite breakfast meals. Am J Clin Nutr. 2006;83(6):1306–1312. doi: 10.1093/ajcn/83.6.1306. [DOI] [PubMed] [Google Scholar]
- 32.Green PS, Vaisar T, Pennathur S, et al. Combined statin and niacin therapy remodels the high-density lipoprotein proteome. Circulation. 2008;118(12):1259–1267. doi: 10.1161/CIRCULATIONAHA.108.770669. [DOI] [PMC free article] [PubMed] [Google Scholar]
- 33.Sagare A, Deane R, Bell RD, et al. Clearance of amyloid- β by circulating lipoprotein receptors. Nat Med. 2007;13(9):1029–1031. doi: 10.1038/nm1635. [DOI] [PMC free article] [PubMed] [Google Scholar]
- 34.Koffie RM, Hashimoto T, Tai HC, et al. Apolipoprotein E4 effects in Alzheimer’s disease are mediated by synaptotoxic oligomeric amyloid-β. Brain. 2012;135(pt 7):2155–2168. doi: 10.1093/brain/aws127. [DOI] [PMC free article] [PubMed] [Google Scholar]
- 35.Mamo JC, Jian L, James AP, Flicker L, Esselmann H, Wiltfang J. Plasma lipoprotein β -amyloid in subjects with Alzheimer’s disease or mild cognitive impairment. Ann Clin Biochem. 2008;45(pt 4):395–403. doi: 10.1258/acb.2008.007214. [DOI] [PubMed] [Google Scholar]
- 36.Takechi R, Galloway S, Pallebage-Gamarallage MM, Lam V, Mamo JC. Dietary fats, cerebrovasculature integrity and Alzheimer’s disease risk. Prog Lipid Res. 2010;49(2):159–170. doi: 10.1016/j.plipres.2009.10.004. [DOI] [PubMed] [Google Scholar]
- 37.Takechi R, Galloway S, Pallebage-Gamarallage MM, Mamo JC. Chylomicron amyloid-β in the aetiology of Alzheimer’s disease. Atheroscler Suppl. 2008;9(2):19–25. doi: 10.1016/j.atherosclerosissup.2008.05.010. [DOI] [PubMed] [Google Scholar]
- 38.Biessels GJ, Staekenborg S, Brunner E, Brayne C, Scheltens P. Risk of dementia in diabetes mellitus: a systematic review. Lancet Neurol. 2006;5(1):64–74. doi: 10.1016/S1474-4422(05)70284-2. [DOI] [PubMed] [Google Scholar]
- 39.Ott A, Stolk RP, van Harskamp F, Pols HA, Hofman A, Breteler MM. Diabetes mellitus and the risk of dementia: the Rotterdam Study. Neurology. 1999;53(9):1937–1942. doi: 10.1212/wnl.53.9.1937. [DOI] [PubMed] [Google Scholar]
- 40.S Roriz-Filho J, Sa-Roriz TM, Rosset I, et al. (Pre)diabetes, brain aging, and cognition. Biochim Biophys Acta. 2009;1792(5):432–443. doi: 10.1016/j.bbadis.2008.12.003. [DOI] [PubMed] [Google Scholar]
- 41.Schwartz MW, Figlewicz DF, Kahn SE, Baskin DG, Greenwood MR, Porte D., Jr Insulin binding to brain capillaries is reduced in genetically obese, hyperinsulinemic Zucker rats. Peptides. 1990;11(3):467–472. doi: 10.1016/0196-9781(90)90044-6. [DOI] [PubMed] [Google Scholar]
- 42.Wallum BJ, Taborsky GJ, Jr, Porte D, Jr, et al. Cerebrospinal fluid insulin levels increase during intravenous insulin infusions in man. J Clin Endocrinol Metab. 1987;64(1):190–194. doi: 10.1210/jcem-64-1-190. [DOI] [PubMed] [Google Scholar]
- 43.Cholerton B, Baker LD, Craft S. Insulin resistance and pathological brain ageing. Diabet Med. 2011;28(12):1463–1475. doi: 10.1111/j.1464-5491.2011.03464.x. [DOI] [PubMed] [Google Scholar]
- 44.Ho L, Qin W, Pompl PN, et al. Diet-induced insulin resistance promotes amyloidosis in a transgenic mouse model of Alzheimer’s disease. FASEB J. 2004;18(7):902–904. doi: 10.1096/fj.03-0978fje. [DOI] [PubMed] [Google Scholar]
- 45.Frolich L, Blum-Degen D, Bernstein HG, et al. Brain insulin and insulin receptors in aging and sporadic Alzheimer’s disease. J Neural Transm. 1998;105(4-5):423–438. doi: 10.1007/s007020050068. [DOI] [PubMed] [Google Scholar]
- 46.Rivera EJ, Goldin A, Fulmer N, Tavares R, Wands JR, de la Monte SM. Insulin and insulin-like growth factor expression and function deteriorate with progression of Alzheimer’s disease: link to brain reductions in acetylcholine. J Alzheimers Dis. 2005;8(3):247–268. doi: 10.3233/jad-2005-8304. [DOI] [PubMed] [Google Scholar]
- 47.Talbot K, Wang HY, Kazi H, et al. Demonstrated brain insulin resistance in Alzheimer’s disease patients is associated with IGF-1 resistance, IRS-1 dysregulation, and cognitive decline. J Clin Invest. 2012;122(4):1316–1338. doi: 10.1172/JCI59903. [DOI] [PMC free article] [PubMed] [Google Scholar]
- 48.Townsend M, Mehta T, Selkoe DJ. Soluble Aβ inhibits specific signal transduction cascades common to the insulin receptor pathway. J Biol Chem. 2007;282(46):33305–33312. doi: 10.1074/jbc.M610390200. [DOI] [PubMed] [Google Scholar]
- 49.Zhao WQ, De Felice FG, Fernandez S, et al. Amyloid β oligomers induce impairment of neuronal insulin receptors. FASEB J. 2008;22(1):246–260. doi: 10.1096/fj.06-7703com. [DOI] [PubMed] [Google Scholar]
- 50.Demuro A, Mina E, Kayed R, Milton SC, Parker I, Glabe CG. Calcium dysregulation and membrane disruption as a ubiquitous neurotoxic mechanism of soluble amyloid oligomers. J Biol Chem. 2005;280(17):17294–17300. doi: 10.1074/jbc.M500997200. [DOI] [PubMed] [Google Scholar]
- 51.Zhao W, Chen H, Xu H, et al. Brain insulin receptors and spatial memory: correlated changes in gene expression, tyrosine phosphorylation, and signaling molecules in the hippocampus of water maze trained rats. J Biol Chem. 1999;274(49):34893–34902. doi: 10.1074/jbc.274.49.34893. [DOI] [PubMed] [Google Scholar]
- 52.Bomfim TR, Forny-Germano L, Sathler LB, et al. An anti-diabetes agent protects the mouse brain from defective insulin signaling caused by Alzheimer’s disease–associated Aβ oligomers. J Clin Invest. 2012;122(4):1339–1353. doi: 10.1172/JCI57256. [DOI] [PMC free article] [PubMed] [Google Scholar]
- 53.Mahley RW, Huang Y, Weisgraber KH. Detrimental effects of apolipoprotein E4: potential therapeutic targets in Alzheimer’s disease. Curr Alzheimer Res. 2007;4(5):537–540. doi: 10.2174/156720507783018334. [DOI] [PubMed] [Google Scholar]
- 54.de la Monte SM. Therapeutic targets of brain insulin resistance in sporadic Alzheimer’s disease. Front Biosci (Elite Ed) 2012;4:1582–1605. doi: 10.2741/482. [DOI] [PMC free article] [PubMed] [Google Scholar]
- 55.Cramer PE, Cirrito JR, Wesson DW, et al. ApoE-directed therapeutics rapidly clear β-amyloid and reverse deficits in AD mouse models. Science. 2012;335(6075):1503–1506. doi: 10.1126/science.1217697. [DOI] [PMC free article] [PubMed] [Google Scholar]
- 56.Bell RD, Sagare AP, Friedman AE, et al. Transport pathways for clearance of human Alzheimer’s amyloid β-peptide and apolipoproteins E and J in the mouse central nervous system. J Cereb Blood Flow Metab. 2007;27(5):909–918. doi: 10.1038/sj.jcbfm.9600419. [DOI] [PMC free article] [PubMed] [Google Scholar]
- 57.Hauser PS, Narayanaswami V, Ryan RO. Apolipoprotein E: from lipid transport to neurobiology. Prog Lipid Res. 2011;50(1):62–74. doi: 10.1016/j.plipres.2010.09.001. [DOI] [PMC free article] [PubMed] [Google Scholar]
- 58.Jiang Q, Lee CY, Mandrekar S, et al. ApoE promotes the proteolytic degradation of Aβ. Neuron. 2008;58(5):681–693. doi: 10.1016/j.neuron.2008.04.010. [DOI] [PMC free article] [PubMed] [Google Scholar]
- 59.Castellano JM, Kim J, Stewart FR, et al. Human apoE isoforms differentially regulate brain amyloid-β peptide clearance. Sci Transl Med. 2011;3(89):89ra57. doi: 10.1126/scitranslmed.3002156. doi:10.1126/scitranslmed.3002156. [DOI] [PMC free article] [PubMed] [Google Scholar]
- 60.Deane R, Sagare A, Hamm K, et al. ApoE isoform-specific disruption of amyloid β peptide clearance from mouse brain. J Clin Invest. 2008;118(12):4002–4013. doi: 10.1172/JCI36663. [DOI] [PMC free article] [PubMed] [Google Scholar]
- 61.Riddell DR, Zhou H, Atchison K, et al. Impact of apolipoprotein E (ApoE) polymorphism on brain ApoE levels. J Neurosci. 2008;28(45):11445–11453. doi: 10.1523/JNEUROSCI.1972-08.2008. [DOI] [PMC free article] [PubMed] [Google Scholar]
- 62.Wahrle SE, Jiang H, Parsadanian M, et al. Deletion of Abca1 increases Aβ deposition in the PDAPP transgenic mouse model of Alzheimer disease. J Biol Chem. 2005;280(52):43236–43242. doi: 10.1074/jbc.M508780200. [DOI] [PubMed] [Google Scholar]
- 63.Koldamova R, Staufenbiel M, Lefterov I. Lack of ABCA1 considerably decreases brain ApoE level and increases amyloid deposition in APP23 mice. J Biol Chem. 2005;280(52):43224–43235. doi: 10.1074/jbc.M504513200. [DOI] [PubMed] [Google Scholar]
- 64.Hirsch-Reinshagen V, Maia LF, Burgess BL, et al. The absence of ABCA1 decreases soluble ApoE levels but does not diminish amyloid deposition in two murine models of Alzheimer disease. J Biol Chem. 2005;280(52):43243–43256. doi: 10.1074/jbc.M508781200. [DOI] [PubMed] [Google Scholar]
- 65.Arold S, Sullivan P, Bilousova T, et al. Apolipoprotein E level and cholesterol are associated with reduced synaptic amyloid β in Alzheimer’s disease and apoE TR mouse cortex. Acta Neuropathol. 2012;123(1):39–52. doi: 10.1007/s00401-011-0892-1. [DOI] [PMC free article] [PubMed] [Google Scholar]
- 66.Fagan AM, Younkin LH, Morris JC, et al. Differences in the Aβ40/Aβ42 ratio associated with cerebrospinal fluid lipoproteins as a function of apolipoprotein E genotype. Ann Neurol. 2000;48(2):201–210. [PubMed] [Google Scholar]
- 67.Hesse C, Larsson H, Fredman P, et al. Measurement of apolipoprotein E (apoE) in cerebrospinal fluid. Neurochem Res. 2000;25(4):511–517. doi: 10.1023/a:1007516210548. [DOI] [PubMed] [Google Scholar]
Associated Data
This section collects any data citations, data availability statements, or supplementary materials included in this article.