Abstract
Radioresistance of EBV-associated nasopharyngeal carcinoma (NPC) is associated with poor prognosis for patients with this form of cancer. Here, we found that NPC patients had increased serum levels of leukemia inhibitory factor (LIF) and that higher LIF levels correlated with local tumor recurrence. Furthermore, in vitro studies with NPC cells and in vivo xenograft mouse studies demonstrated that LIF critically contributes to NPC tumor growth and radioresistance. Using these model systems, we found that LIF treatment activated the mTORC1/p70S6K signaling pathway, enhanced tumor growth, inhibited DNA damage responses, and enhanced radioresistance. Treatment with either soluble LIF receptor (sLIFR), a LIF antagonist, or the mTOR inhibitor rapamycin reversed LIF-mediated effects, resulting in growth arrest and increased sensitivity to γ irradiation. Immunohistochemical (IHC) analyses of human NPC biopsies revealed that LIF and LIFR were overexpressed in tumor cells and that LIF expression correlated with the presence of the activated p-p70S6K. Finally, we found that the EBV-encoded protein latent membrane protein 1 (LMP1) enhances LIF production. Together, our findings indicate that LIF promotes NPC tumorigenesis and suggest that serum LIF levels may predict local recurrence and radiosensitivity in NPC patients.
Introduction
Nasopharyngeal carcinoma (NPC) is prominent in a number of Southeast Asian regions, including southern China, Hong Kong, and Taiwan, where the annual incidence rate is approximately 25-fold higher than that in the Western world (1). NPC is closely associated with EBV infection and is characterized by intensive infiltration of lymphocytes, macrophages, and T cells in tumor tissues, suggesting that both viral and cellular factors are important for the development and progression of NPC (2–4). Radiation therapy is the major therapeutic modality used to treat NPC, and most NPC patients can be cured if the disease is diagnosed and treated at an early stage. However, about 20% of NPC patients develop local recurrence after radiotherapy (5), and radioresistance is a major cause of treatment failure in many cases.
DNA double-strand breaks (DSBs) are the most critical event in ionizing radiation–induced (IR-induced) cell death. The p53-mediated pathway is considered to be important for IR-induced apoptosis, wherein the ataxia-telangiectasia mutated (ATM) kinase links DNA damage to the activation of p53 (6–8). ATM functions as a central transducer, triggering a cascade of DNA damage responses (DDRs) to stimulate apoptosis or DNA repair (9). Activated ATM phosphorylates checkpoint proteins (e.g., p53, CDC25C, Chk1, Chk2, and BRCA1) during all phases of the cell cycle (10). It also phosphorylates H2AX at Ser139 (γH2AX) (11). In response to DNA damage, γH2AX colocalizes with many DDR proteins at nuclear foci surrounding DSB sites; thus, γH2AX foci have recently been used as markers of DNA damage and repair (12).
Various studies have used EBV serology to monitor NPC progression (13), and multiple lines of evidence indicate that increased posttreatment levels of EBV DNA are significantly associated with tumor recurrence (13–16). The expression levels of the EBV-encoded latent membrane protein 1 (LMP1) have also been correlated with tumor progression (17, 18). However, there is some debate as to whether EBV serology or the levels of EBV DNA or LMP1 can be used to predict tumor radiosensitivity. Thus, it would clearly be beneficial to identify reliable predictive and noninvasive biomarkers for radioresistance among NPC patients.
Leukemia inhibitory factor (LIF) is a member of the IL-6–type cytokine family, which includes IL-6, IL-11, oncostatin M, ciliary neutrophic factor, cardiotrophin-1, and cardiotrophin-like cytokine. LIF mediates critical signaling pathways that regulate proliferation and survival, including the JAK/STAT3, PI3K, and ERK1/2 signaling pathways (19, 20). Among them, only LIF-mediated STAT3 signaling has been defined in detail. Recently, dysregulation of LIF and/or the LIF receptor (LIFR) has been reported in several human malignancies, including glioblastoma (21), thyroid cancer (22), rhabdomyosarcoma (23), pancreatic carcinoma (24, 25), and breast cancer (26). However, the precise role of LIF in tumorigenesis remains largely unexplored.
In this study, we simultaneously detected 20 cytokines and growth factors in serum samples from NPC patients. We found that LIF was higher in serum samples from NPC patients who developed local recurrence after treatment compared with that of NPC patients with complete tumor remission. Notably, higher LIF levels were markedly correlated with poorer local recurrence-free survival. Higher LIF levels were also detected in NPC tumors compared with adjacent normal nasopharyngeal tissues. We also found that LIF treatment activated mTORC1/p70S6K signaling and suppressed DDRs in NPC cells, thus enhancing tumor growth and radioresistance phenotypes, respectively. In contrast, treatment of NPC cells and a mouse model of NPC with soluble LIFR (sLIFR, an antagonist of LIF) or rapamycin (an mTOR inhibitor) markedly decreased LIF-mediated effects, resulting in growth arrest and an increased sensitivity to γ irradiation both in vitro and in vivo. Immunohistochemical (IHC) analyses of human biopsies further confirmed the correlations of LIF and mTORC1/p70S6K signaling in NPC. These findings suggest that serum LIF might be useful as a predictor for individual radiosensitivity and local recurrence. Furthermore, modulation of LIF-mediated signaling could be an attractive treatment strategy for sensitizing radioresistant NPC tumors.
Results
Elevated serum LIF in NPC patients is correlated with poorer prognosis.
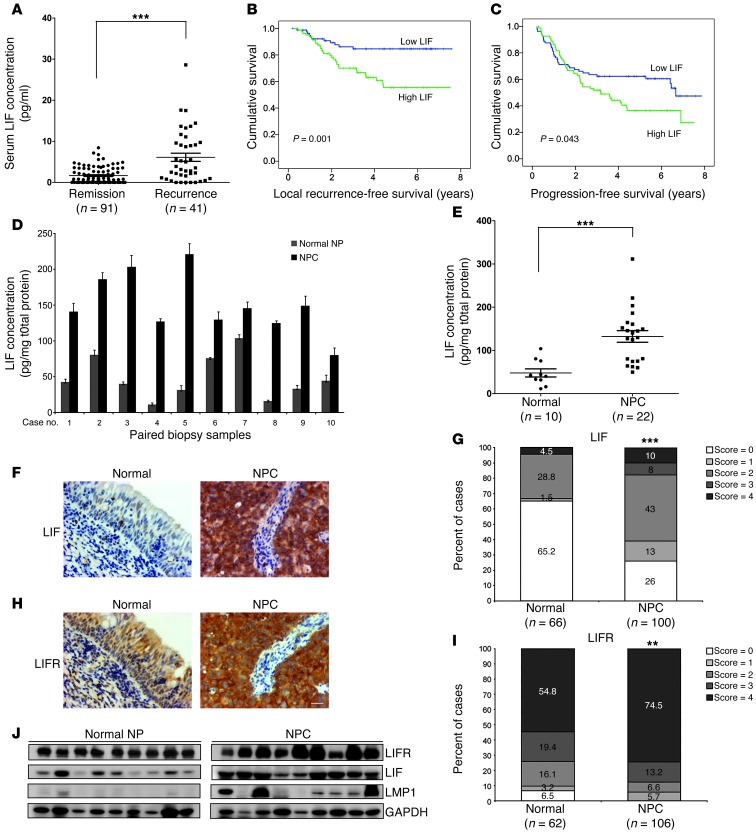
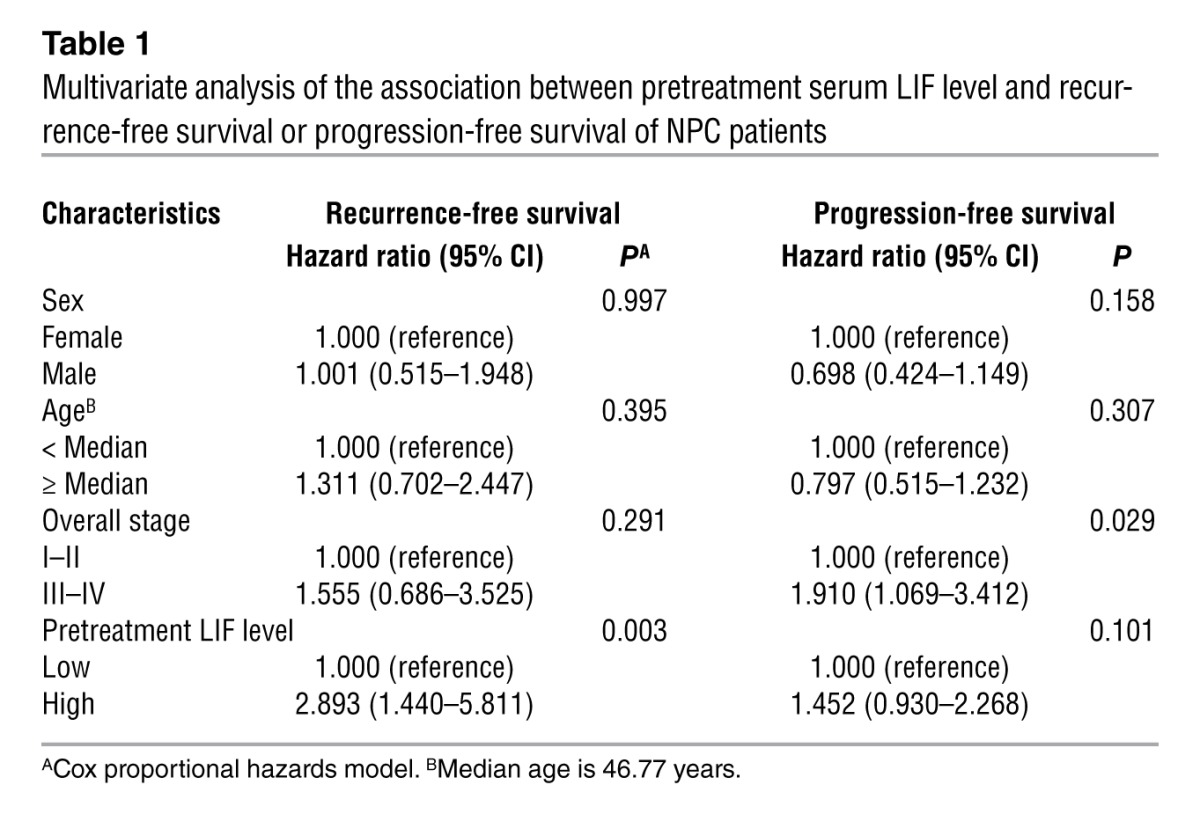
In an attempt to identify useful NPC-specific cytokines, we utilized bead-based multiplex cytokine assays to evaluate the levels of 20 cytokines in serum samples from 71 NPC patients and 28 healthy individuals. We found that the serum levels of LIF, C-X-C motif chemokine 9 (CXCL9, MIG), IL-10, IL-6, and SCF were significantly higher in the 22 NPC patients diagnosed with local recurrence compared with normal donors (P < 0.05; Supplemental Table 1; supplemental material available online with this article; doi: 10.1172/JCI63428DS1). LIF, which showed the highest significance in this regard (P < 0.0001), was selected for a further verification study involving an additional 90 NPC samples. Importantly, the LIF levels remained much higher in NPC patients who developed local recurrence compared with those with complete tumor remission (P < 0.0001) (Figure 1A). The cutoff value of serum LIF that could be used to differentiate between patients with complete tumor remission and those with local recurrence was determined by receiver-operating characteristic (ROC) analysis (P < 0.0001; area under the ROC curve, 0.74; cutoff value, 4.96 pg/ml) (Supplemental Figure 1). Survival analyses showed that NPC patients with higher levels of LIF had significantly poorer recurrence-free survival (P = 0.001) (Figure 1B) and progression-free survival (P = 0.043) (Figure 1C) versus patients with lower LIF levels. In contrast, no significant correlation was found between LIF levels and metastasis-free survival (P = 0.511) (Supplemental Figure 2A) or overall survival (P = 0.443) (Supplemental Figure 2B). A comparative analysis of pretreatment serum LIF levels and clinicopathologic factors in the NPC patients failed to show any significant association of serum LIF levels with sex, age, or pathologic classification (Supplemental Table 2). A multivariate Cox regression analysis indicated that a higher level of LIF (LIF > 4.96 pg/ml) was an independent prognostic factor for recurrence-free survival (P = 0.003, hazard ratio = 2.893, 95% CI = 1.440–5.811) (Table 1). Collectively, these data indicate that serum LIF is an independent prognostic predictor of recurrence-free survival.
Figure 1. LIF levels in clinical samples from NPC patients and LIF and LIFR expression levels in NPC biopsy sections.
(A) Detection of serum LIF levels in NPC patients with complete remission or recurrence. Significantly higher LIF levels were detected in NPC patients that developed recurrence. ***P < 0.0001, Mann-Whitney test. (B and C) Kaplan–Meier survival curves of NPC patients based on serum LIF levels. (B) Local recurrence-free survival. (C) Progression-free survival. (D) LIF concentration in paired biopsy samples (n = 10). LIF levels were detected using magnetic bead–based cytokine assay. (E) Analysis of LIF protein levels in adjacent normal nasopharyngeal tissues and NPC biopsies. ***P < 0.0001, Mann-Whitney test. (F–I) IHC analyses of LIF and LIFR expression in paraffin-embedded consecutive NPC tissue sections. Representative images of LIF expression (F) and LIFR expression (H) in NPC tumors. Statistical analysis of LIF expression (G) and LIFR expression (I) in NPC tumor tissues and adjacent normal epithelium. **P < 0.01; ***P < 0.0001, χ2 test. Scale bar: 50 μm. (J) Western blotting analysis of LIFR, LIF, and LMP1 in NPC biopsy samples. Normal NP, adjacent normal tissues. GAPDH was used as a loading control.
Table 1.
Multivariate analysis of the association between pretreatment serum LIF level and recurrence-free survival or progression-free survival of NPC patients
LIF levels are higher in the microenvironment of NPC.
Type III NPC is characterized by EBV infection and high lymphocytes infiltration (13), and LIF expression can be induced by inflammatory type factors such as NF-κB, TNF-α, and IL-1 (27). To investigate whether the LIF level is higher in NPC tumor microenvironment, we detected and compared the LIF concentrations in paired biopsy samples (adjacent normal NP vs. NPC) obtained from the same individual. Importantly, we found that LIF levels were significantly higher (P < 0.0001) in tumor samples compared with normal counterparts (Figure 1, D and E). Moreover, the LIF concentrations detected in biopsy samples were 10-fold higher than in serum samples, implying that LIF produced in tumor microenvironments likely contributes to the elevated serum LIF in NPC patients.
LIF and LIFR are overexpressed in NPC.
As the signaling downstream of LIF is mediated by an interaction with LIFR, we examined the expression levels of LIF and LIFR in NPC biopsy tissues. Our IHC analyses showed that the expression levels of LIF and LIFR were significantly higher in NPC tumor cells compared with the adjacent basal epithelium (LIF, P < 0.0001; LIFR, P < 0.01) (Figure 1, F–I). Strong LIF immunoreactivity was observed in infiltrated macrophages (CD68-positive cells; Supplemental Figure 3A), indicating that macrophages are involved in the production of LIF in the tumor microenvironment. In contrast, normal basal cells and NPC tumor cells did not show any significant difference in the expression of gp130 (a common receptor shared by members of the IL-6 cytokine family) which showed medium-to-strong immunoreactivity on average (Supplemental Figure 3B). Western blotting analysis also demonstrated a higher protein expression of LIF and LIFR in NPC biopsies compared with the adjacent normal nasopharyngeal tissues (Figure 1J). Together, these results demonstrated that LIF and LIFR are overexpressed in NPC tumors.
LIF enhances NPC tumor growth both in vitro and in vivo.
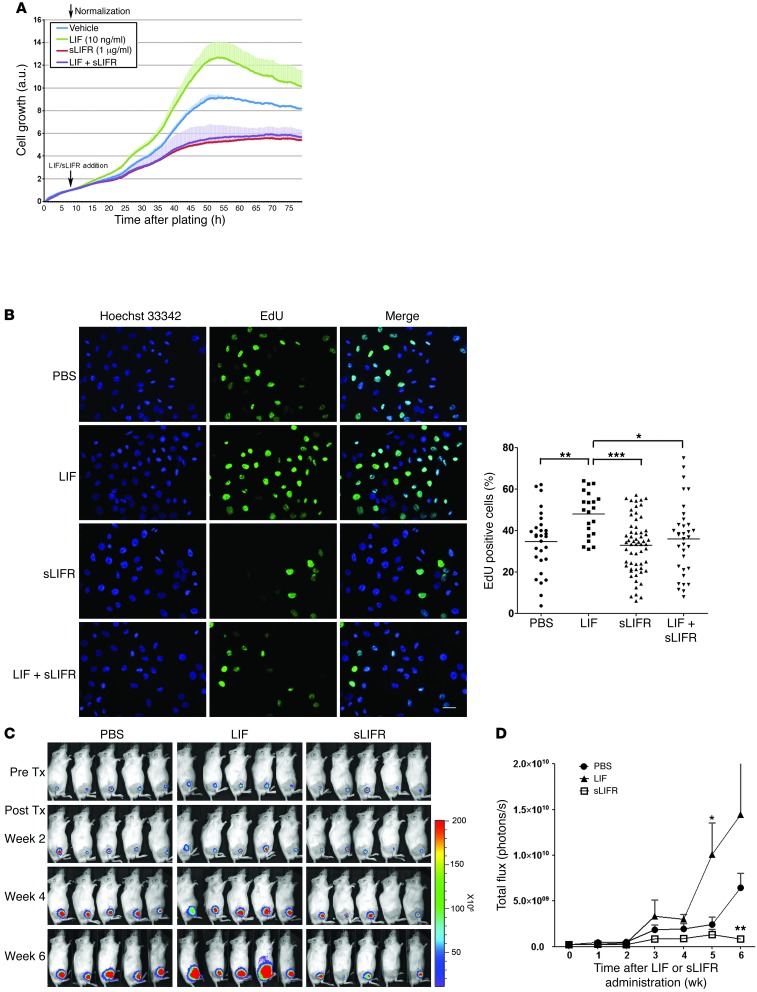
To further assess the impact of LIF on NPC cells, we first determined the biologically effective dose range of LIF on 2 NPC cell lines (TW06 and CNE1 cells). The NPC cell lines were treated with various doses of human recombinant LIF (0.5 ng/ml, 3 ng/ml, 10 ng/ml, 50 ng/ml, 0.5 μg/ml, and 1 μg/ml), and cell growth was determined using a real-time cell analyzer. Our results showed that LIF treatment enhanced NPC cell proliferation with half-maximal effective concentrations (EC50) of 10.4 ng/ml in TW06 cells (Supplemental Figure 4A) and 2.84 ng/ml in CNE1 cells (Supplemental Figure 4B). These values fell within the previously reported range (23, 28, 29). To further assess the role of LIF in NPC cell growth, we blocked the interaction between secreted LIF and its receptor with sLIFR (30, 31) and measured cell growth using a real-time analyzer. Administration of sLIFR substantially suppressed the growth of TW06 cells, while costimulation with LIF did not affect this sLIFR-mediated growth suppression (Figure 2A). The observed LIF-mediated enhancement of cell proliferation in TW06 cells was confirmed by EdU incorporation assays (Figure 2B). Quantification of the results revealed that DNA synthesis was increased by LIF stimulation, and this enhancement was blocked by sLIFR (Figure 2B). It is worth noting that LIF at 10 ng/ml did not affect sLIFR-mediated growth suppression (Figure 2, A and B). To assess whether LIF could affect the growth of NPC xenograft tumors, we inoculated TW06_Luc2 cells (Supplemental Figure 5) subcutaneously into the legs of NOD/SCID mice and used an in vivo imaging system (IVIS) to monitor tumor growth in mice treated with and without LIF, sLIFR, or PBS. As shown in Figure 2C, at 4 weeks after treatment, LIF-treated tumors exhibited increased tumor growth compared with PBS-treated controls. In contrast, sLIFR-treated tumors showed growth arrest through the end of the experimental period (week 6). Quantification of total photon fluxes from regions of interest (ROIs) showed that LIF enhanced tumor growth and sLIFR treatment led to significantly less growth (Figure 2D). Similar results were observed in CNE1 xenografts (Supplemental Figure 6). These results collectively indicate that LIF enhances NPC tumor growth both in vitro and in vivo.
Figure 2. Assessment of LIF-stimulated cell proliferation in NPC cells.
(A) Real-time cell proliferation assays of TW06 cells treated with LIF, sLIFR, or PBS (control). sLIFR (1 μg/ml) was added to the growth medium of TW06 cells 2 hours prior to LIF treatment. Black arrows indicate the time at which LIF and sLIFR were added. Values are presented as means and SD of triplicate experiments. (B) Analysis of EdU incorporation in CNE1 cells treated with PBS, LIF, sLIFR, or sLIFR plus LIF for 24 hours, followed by EdU labeling for 3 hours. EdU+ cells were quantified using ImageJ software. Overall P < 0.001, 1-way ANOVA; *P < 0.05; **P < 0.01; ***P < 0.001, Bonferroni’s multiple comparison test. Scale bar: 50 μm. (C) Bioluminescent images of NPC tumor xenografts treated with PBS, LIF, or sLIFR. Images were first detected on the seventh day after implantation of TW06_Luc2 cells. Drug administration was started on the eighth day after implantation and continued twice per week for 6 weeks. (D) Quantification of the total photon fluxes from the tumors shown in C. *P < 0.05; **P < 0.01, paired t test, compared with PBS-treated group. Values are presented as means and SEM (n = 5 mice per group).
LIF activates p70S6K signaling.
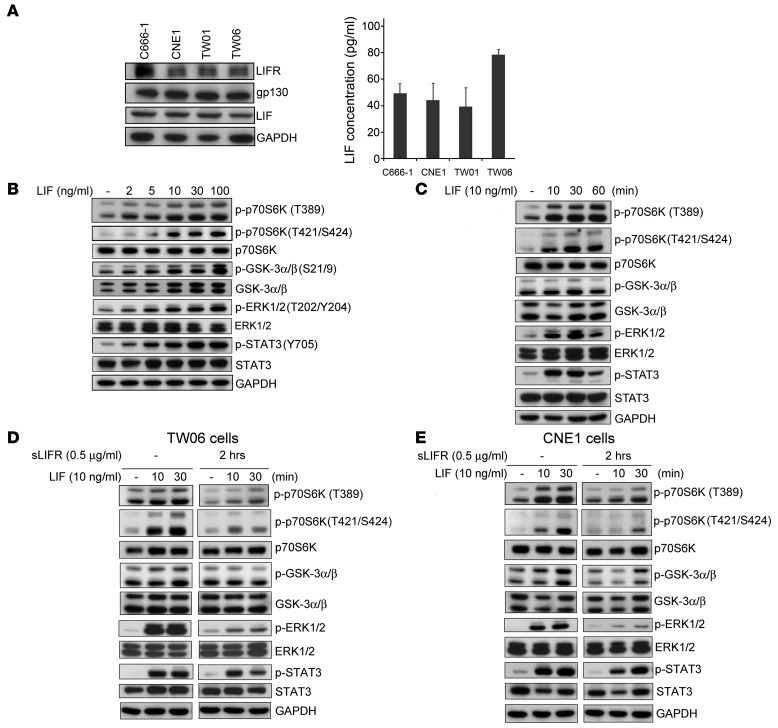
As LIF acts through the LIFR/gp130 complex to exert its biological effects in cells, we used Western blotting to test whether these receptors were expressed along with LIF in NPC cells. As shown in Figure 3A, LIFR, gp130, and LIF were all expressed in the 4 tested NPC cell lines (C666-1, CNE1, TW01, and TW06) (32–35). To evaluate whether NPC cells can secrete LIF into the culture medium, we used a sensitive bead-based cytokine assay to quantify the amount of LIF in cell-free culture supernatants. The levels of LIF in the NPC cell supernatants ranged from approximately 40 pg/ml to 80 pg/ml (Figure 3A). Since LIF was reported to activate the STAT3, PI3K, and MEK signaling pathways in mouse embryonic stem cells (19), we then tested to determine whether LIF can activate these pathways in NPC cells. By simultaneously detecting the phosphorylation levels of 13 signaling molecules in LIF-stimulated CNE1 cells, we found that LIF activated multiple molecules involved in p70S6K signaling (Supplemental Figure 7) along with known targets of LIF (e.g., STAT3, MEK1, and p38 MAPK). Previous reports have shown that phosphorylation of p70S6K T389 and T421/S424 is induced in response to growth factors or other stimuli (36–40). To clarify the LIF-mediated phosphorylation of p70S6K in NPC, we examined the phosphorylation state of p70S6K T389 and T421/S424 in NPC cell lines in response to LIF. Western blotting confirmed that the phosphorylation levels of T389 and T421/S424 of p70S6K and its downstream molecules (GSK-3α/β Ser21/9 and EKR1/2 Thr202/Tyr204) were dose dependently enhanced by LIF (Figure 3B). Following the addition of LIF, the activation of p70S6K peaked at 30 minutes and lasted to 60 minutes after treatment (Figure 3C). Activation of STAT3 Tyr705, a known downstream molecule of LIF, was used as a positive control for LIF-mediated activation (Figure 3, B and C). Importantly, the LIF-mediated activation of p70S6K signaling was attenuated by pretreatment of both TW06 and CNE1 cells with sLIFR prior to LIF stimulation (Figure 3, D and E). sLIFR-mediated suppression could be overcome by treating cells with higher concentrations of LIF (up to 100 ng/ml) (Supplemental Figure 8). Taken together, these results suggest that LIF activates p70S6K and its downstream molecules, GSK-3α/β and EKR1/2, in NPC cells.
Figure 3. LIF activates the p70S6K-signaling pathway.
(A) Protein expression of LIFR, gp130, and LIF in 4 NPC-derived cell lines: C666-1, CNE1, TW01, and TW06. Right panel showed levels of secreted LIF in the 4 NPC cell lines. Cell-free culture supernatants were collected at 36 hours after plating, and LIF was measured by bead-based assays (Bio-Rad). (B–E) Western blotting analyses of signaling protein and its phosphorylated form using site-specific antibodies. GAPDH was used as a loading control. (B) LIF dose dependently activates p70S6K and its downstream targets in CNE1 cells. Protein lysates were harvested 10 minutes after LIF treatment. (C) Time-course analysis of p70S6K signaling molecules in LIF-treated CNE cells. (D and E) Pretreatment with sLIFR (1 μg/ml) 2 hours prior to LIF treatment prevents LIF-induced activation of p70S6K signaling in both TW06 cells (D) and CNE1 cells (E).
The mTOR protein is an upstream regulator of the LIF-induced activation of p70S6K.
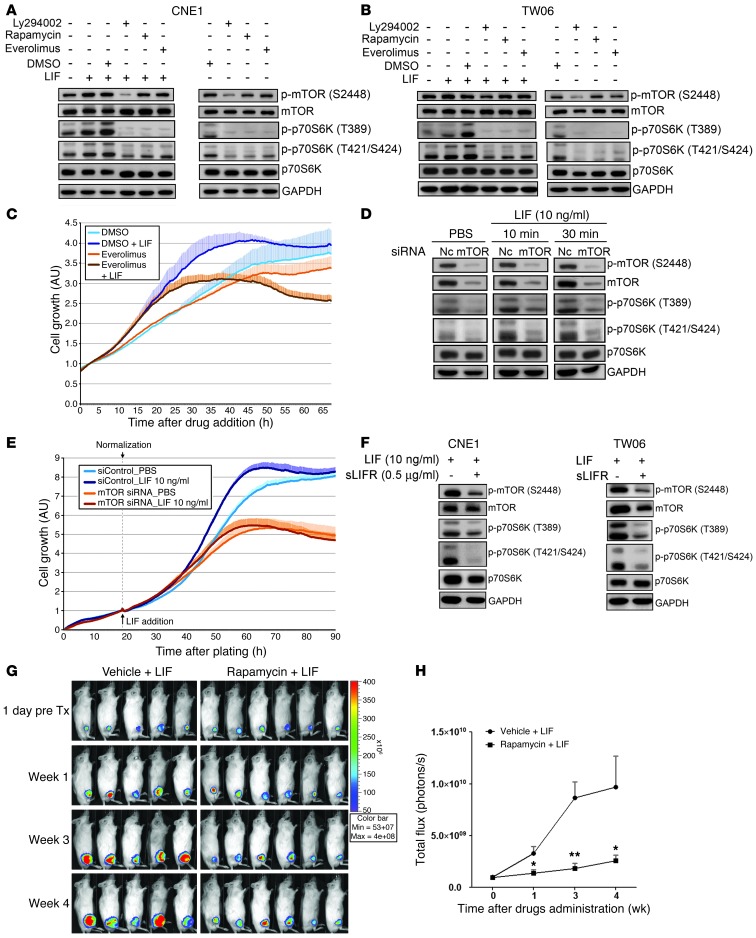
The mTOR protein is a well-known key regulator of p70S6K, whereas PI3K is a critical upstream kinase for mTOR (41, 42). mTORC1 phosphorylates T389 in the linker region of p70S6K (43, 44); in turn, p70S6K phosphorylates mTOR Ser2448 via a feedback loop upon activation (45). To investigate whether the LIF-mediated activation of p70S6K occurred via mTOR, we blocked the function of mTOR by treating cells with rapamycin or everolimus (2 mTOR inhibitors) or a PI3K inhibitor (Ly294002) prior to LIF stimulation. Western blotting showed that LIF treatment concomitantly activated both p70S6K T389 and T421/S424 and mTOR S2448, and pretreatment with rapamycin, everolimus, or Ly294002 attenuated the LIF-mediated activations of p70S6K and mTOR in both CNE1 cells (Figure 4A) and TW06 cells (Figure 4B). To further delineate the role of mTOR in LIF-mediated cell growth, we examined proliferation in CNE1 cells treated with LIF alone or in combination with an mTOR inhibitor. Our results showed that everolimus treatment suppressed LIF-induced enhancement of cell proliferation (Figure 4C). Furthermore, siRNA-mediated silencing of mTOR reduced the LIF-induced activation of p70S6K and mTOR (Figure 4D) and significantly suppressed the LIF-induced proliferation of CNE1 cells (Figure 4E). Finally, sLIFR pretreatment suppressed LIF-induced activation of p70S6K and mTOR in both CNE1 and TW06 cells (Figure 4F). To investigate whether suppression of p70S6K could reduce LIF-mediated tumor growth in a mouse model, we treated mice bearing NPC xenografts with rapamycin (inhibitor) or vehicle by intraperitoneal injection (3 mg/kg, once a day, 5 days/week × 3 weeks) in combination with LIF treatment. Our results showed that administration of rapamycin indeed could reduce LIF-mediated tumor growth (Figure 4, G and H). Together, these results suggest that LIF treatment triggers p70S6K signaling downstream of mTOR, leading to increased NPC cell growth.
Figure 4. LIF-induced activation of p70S6K is mediated through mTOR.
(A and B) Inhibitors of mTOR suppressed the LIF-induced phosphorylation of p70S6K. CNE1 cells (A) and TW06 cells (B) were pretreated with inhibitors for 40 minutes, and then stimulated with LIF (10 ng/ml). Ten minutes later, the cells were harvested and protein lysates were obtained. (C) Real-time monitoring of cell viability. CNE1 cells were pretreated with everolimus for 40 minutes and then stimulated with LIF (10 ng/ml) for the duration of the experiment. Values are expressed as the mean and SD of triplicate experiments. (D) siRNA-mediated depletion of mTOR in CNE1 cells inhibits the LIF-induced activation of p70S6K. Cells were stimulated with LIF at 24 hours after siRNA transfection. NC, negative control siRNA. (E) Silencing of mTOR by siRNA suppresses the effects of LIF on CNE1 cell proliferation. Cells were replated into E-plate at 24 hours after siRNA transfection. Values of cell growth were normalized with respect to the time of LIF addition. Data are presented as means and SD of triplicate experiments. (F) Pretreatment with sLIFR 2 hours prior to LIF treatment decreases LIF-induced phosphorylation of mTOR in both CNE1 cells and TW06 cells. GAPDH was used as the loading control for Western blotting. (G) Inhibition of p70S6K by rapamycin suppresses LIF-mediated tumor growth in mice (n = 5 for LIF treatment only, an n = 6 for rapamycin plus LIF treatment). Rapamycin was given by intraperitoneal injection (3 mg/kg, once a day, 5 days/week × 3 weeks). (H) Quantification of the total photon fluxes of tumors shown in G. *P < 0.05; **P < 0.01, paired t test.
Levels of LIF, phosphorylated p70S6K, and phosphorylated mTOR are correlated in human NPC biopsies and NPC xenografts.
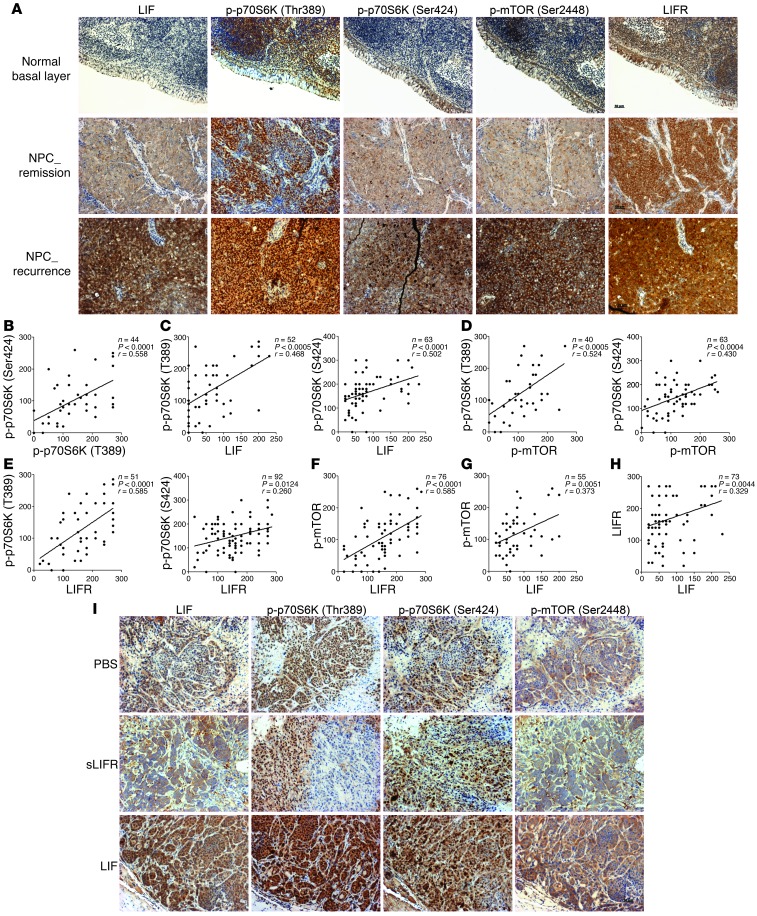
Since our experimental data suggested that LIF enhances NPC cell growth by activating p70S6K signaling, we next determined whether the expression levels of LIF, p-p70S6K (T389 and T421/S424), p-mTOR (S2448), and LIFR were correlated in human NPC biopsies. Our IHC analyses showed that the immunoreactivities of p-p70S6K and p-mTOR were higher in NPC tumors compared with the normal basal epithelium and often even stronger in NPC cases diagnosed with local recurrence after radiotherapy (Figure 5A). Correlation analyses revealed that there were close correlations between p70S6K (T389) and p70S6K (T421/S424) (P < 0.0001, r = 0.558), LIF and p-p70S6K (T389) (P < 0.0005, r = 0.468), LIF and p-p70S6K (T421/S424) (P < 0.0001, r = 0.502), LIF and p-mTOR (P = 0.0051, r = 0.373), p-mTOR and p-p70S6K (T389) (P = 0.0005, r = 0.524), p-mTOR and p-p70S6K (T421/S424) (P = 0.0004, r = 0.430), LIFR and p-p70S6K (T389) (P < 0.0001, r = 0.585), LIFR and p-mTOR (P < 0.0001, r = 0.585), and LIF and LIFR (P = 0.004, r = 0.329), and a moderate correlation between LIFR and p-p70S6K (T421/S424) (P = 0.012, r = 0.260) (Figure 5, B–H). Moreover, the immunoreactivities of p-p70S6K and p-mTOR were enhanced in LIF-treated NPC xenografts and decreased in sLIFR-treated xenografts compared with PBS-treated controls (Figure 5I). Together, these results indicate that LIF expression appears to be associated with the activations of p70S7K and mTOR, and these misregulations might contribute to tumor progression.
Figure 5. Correlation analyses of LIF, p-p70S6K, p-mTOR, and LIFR expression in human nasopharyngeal biopsies and NPC xenografts.
(A) Representative IHC images of LIF, p-p70S6K, p-mTOR, and LIFR in NPC tumors. Scale bar: 50 μm. (B–H) Correlation analyses based on IHC scores (Spearman’s correlation test). The correlations shown include those between p-p70S6K (T389) and p-p70S6K (T421/S424) (B), LIF and p-p70S6K (C), p-mTOR and p-p70S6K (D), LIFR and p-p70S6K (E), LIFR and p-mTOR (F), LIF and p-mTOR (G), and LIF and LIFR (H). (I) IHC analysis of p-p70S6K and p-mTOR in CNE1 xenografts treated with LIF, sLIFR, or PBS. Scale bar: 50 μm.
LIF enhances resistance to IR.
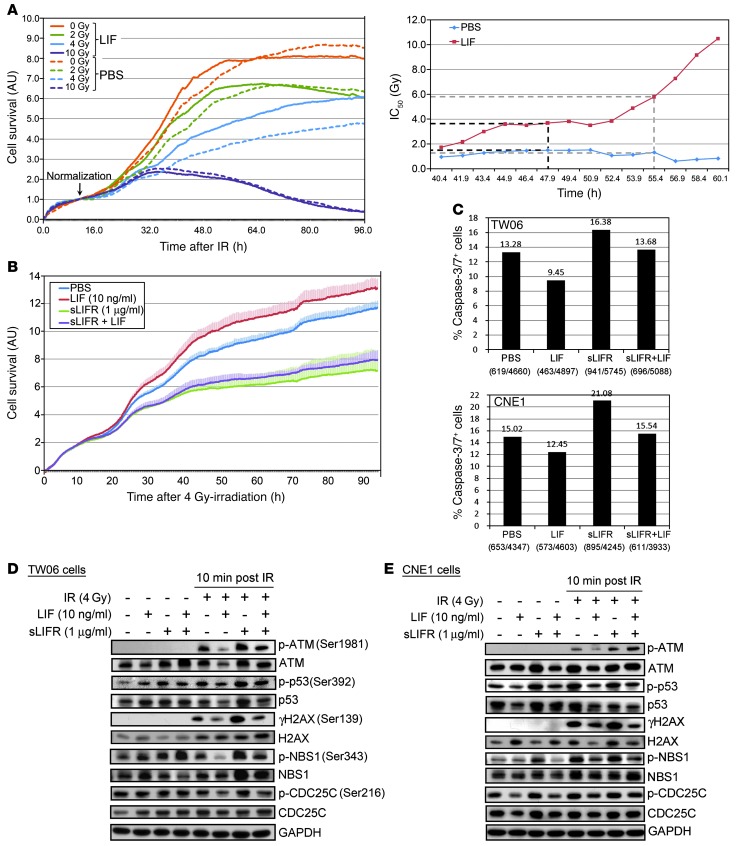
As radioresistance is often associated with treatment failure in NPC (1, 46), we investigated whether elevated LIF levels were associated with radioresistance. First, we treated CNE1 cells with human LIF or vehicle (PBS) and then exposed them to various doses (0, 2, 4, and 10 Gy) of IR. Cell survival was determined using an xCelligence real-time cell analyzer. As shown in Figure 6A, IR induced dose-dependent cytotoxicity, but LIF-stimulated cells showed better survival than PBS-treated cells. IR-induced toxicity was quantified by calculating the half-maximal inhibitory dose (IC50) after irradiation (Figure 6A). The IC50 values for the vehicle control and LIF-treated cells were 1.5 Gy and 3.7 Gy, respectively, at 48 hours after irradiation, and 1.3 Gy and 5.8 Gy, respectively, after 55 hours. Similar results were obtained with TW06 cells (Supplemental Figure 9). Moreover, the cell survival following exposure to IR was dramatically decreased in cells treated with sLIFR (Figure 6B). LIF treatment inhibited IR-induced apoptosis, as evidenced by reduced levels of active caspase 3 and caspase 7 in LIF-treated TW06 and CNE1 cells compared with untreated controls (Figure 6C). In contrast, sLIFR treatment enhanced apoptotic events, whereas costimulation with LIF caused a reduction of this apoptosis (Figure 6C).
Figure 6. LIF treatment increases survival of NPC cells exposed to IR.
(A) Plot of the radiation dose responses obtained from real-time monitoring of the effects of IR. Survival of CNE1 cells treated with LIF or vehicle prior to IR were continuously monitored every 10 minutes for 96 hours. The time-dependent IC50 was determined from approximately 40–60 hours after irradiation using the RTCA software (Roche). (B) Treatment with sLIFR suppresses the LIF-mediated increase in survival after 4-Gy irradiation. (C) IR-induced apoptotic assays. IR-induced apoptosis was determined by detecting active caspase 3 and caspase 7 in TW06 cells and CNE1 cells 96 hours after 4-Gy irradiation. The percentage of cells positive for active caspase 3/7 was calculated by dividing the number of caspase 3/7–positive objects by the total number of nuclei visualized with Hoechst 33342 DNA dye (blue). (D and E) LIF modulates the phosphorylation levels of DNA damage-responsive molecules in TW06 cells (D) and CNE1 cells (E) subjected to 4-Gy irradiation. Protein lysates were harvested at 10 minutes after irradiation. GAPDH was used as the loading control.
IR-induced cell death results in DNA DSBs, which triggers the activation and recruitment of DDR molecules to the DSB sites (47). To determine whether LIF modulates DDRs, we analyzed the activations of ATM (Ser1981), tumor protein p53 (p53 Ser392), histone H2AX (γH2AX Ser139), Nijmegen breakage syndrome protein 1 (NBS1 Ser343), and cell division cycle 25 homolog C (CDC25C Ser216) in IR-treated NPC cells. Interestingly, at 10 minutes after 4-Gy irradiation, the phosphorylation levels of these DDR proteins were decreased in LIF-treated cells and increased in sLIFR-treated cells (Figure 6, D and E). The LIF-mediated decreased phosphorylation of DDR proteins lasted up to 2 hours after irradiation (Supplemental Figure 10). The LIF-induced reduction of p53 activation could therefore conceivably be linked to the inhibition of irradiation-induced apoptosis. Collectively, these findings suggest that LIF-mediated radioresistance may result from the suppression of apoptosis and the inhibition of DDR signaling.
LIF enhances radioresistance of NPC xenografts in immunodeficient mice.
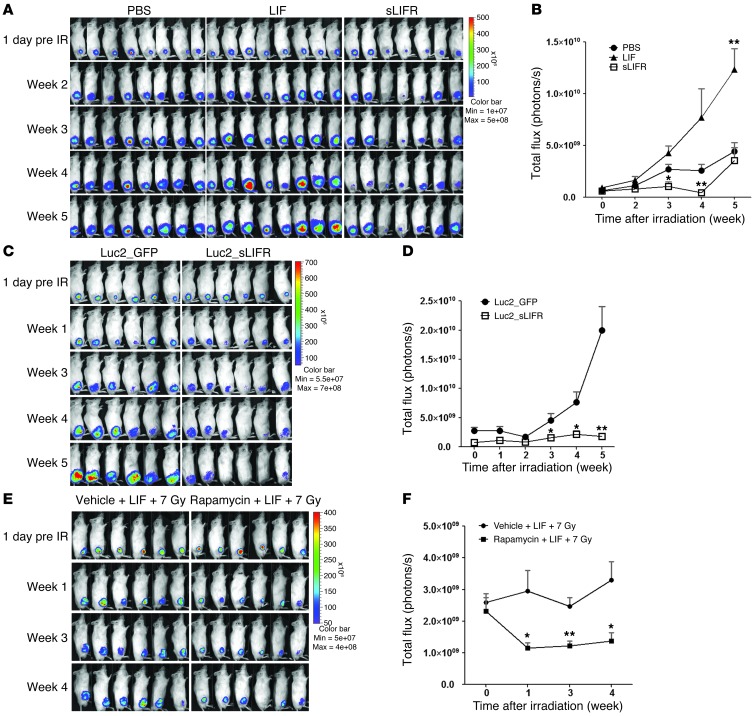
To further investigate whether LIF confers radioresistance in vivo, we subjected TW06_Luc2 xenografts to a single dose of 7 Gy when the tumor volumes reached approximately 60 to 100 mm3 (day 12). The tumors were intratumorally injected with PBS, LIF, or sLIFR prior to irradiation and thereafter (LIF: 150–200 ng/20 μl PBS, twice/week × 4 weeks; sLIFR: 1–2 μg/20 μl PBS, twice/week × 4 weeks). Tumor progression was monitored by IVIS once a week. As shown in Figure 7A, the LIF-treated tumors were significantly resistant to IR. Irradiation initially caused a growth arrest in LIF- and PBS-treated xenografts, but the tumors persisted and grew rapidly in week 3 after IR (Figure 7B). In contrast, sLIFR treatment effectively suppressed tumor growth after IR compared with the PBS-treated xenografts, and abundant necrotic tumor tissues were found inside the sLIFR-treated xenografts (data not shown). To further investigate the role of LIF in the radioresistance of NPC xenografts, we established a CNE1_Luc2_sLIFR cell line stably expressing sLIFR (Supplemental Figure 11), subcutaneously inoculated these cells into the legs of NOD/SCID mice, and assessed tumor responses to IR. Consistent with the effects of exogenous sLIFR treatment, stable expression of sLIFR appeared to sensitize tumors to IR, as compared with the effects seen in CNE1_Luc2_GFP xenografts (Figure 7C). After irradiation, the tumor growth of Luc2_GFP xenografts accelerated in week 3, whereas Luc2_sLIFR xenografts showed regression to the end of the experimental period (Figure 7D). To further assess the impact of mTOR/p70S6K on LIF-mediated radioresistance, we treated mice with rapamycin and monitored tumor progression by IVIS. Our results revealed that suppression of p70S6K sensitized LIF-treated tumors to IR (P < 0.01 at week 3) (Figure 7, E and F). Collectively, our findings indicate that the presence of LIF in the tumor microenvironment promotes resistance to IR.
Figure 7. LIF enhances the radioresistance of NPC xenografts.
(A) TW06_Luc2 xenografts were subjected to a single dose of 7 Gy, and tumor growth was monitored using IVIS. The tumors were intratumorally injected with PBS, LIF, or sLIFR prior to irradiation and thereafter (LIF: 150–200 ng/20 μl PBS, twice/week × 4 weeks; sLIFR: 1–2 μg/20 μl PBS, twice/week × 4 weeks). (B) Quantification of the total photon fluxes of tumors shown in A. *P < 0.05, paired t test, compared with the PBS-treated group. (C) CNE1_Luc2_GFP cells and CNE1_Luc2_sLIFR cells, which stably expressed GFP and sLIFR, respectively, were subcutaneously inoculated into legs of NOD/SCID mice and tumor responses to 7-Gy irradiation were assessed by IVIS. (D) Quantification of the total photon fluxes of tumors shown in C (*P < 0.05; **P < 0.01; paired t test). (E) Administration of rapamycin reduces LIF-mediated radioresistance. Rapamycin was given by intraperitoneal injection (3 mg/kg, once a day, 5 days/week × 3 weeks). n = 6 for each group. (F) Quantification of the total photon fluxes of tumors shown in E. *P < 0.05; **P < 0.01; paired t test.
EBV-encoded LMP1 enhances LIF production.
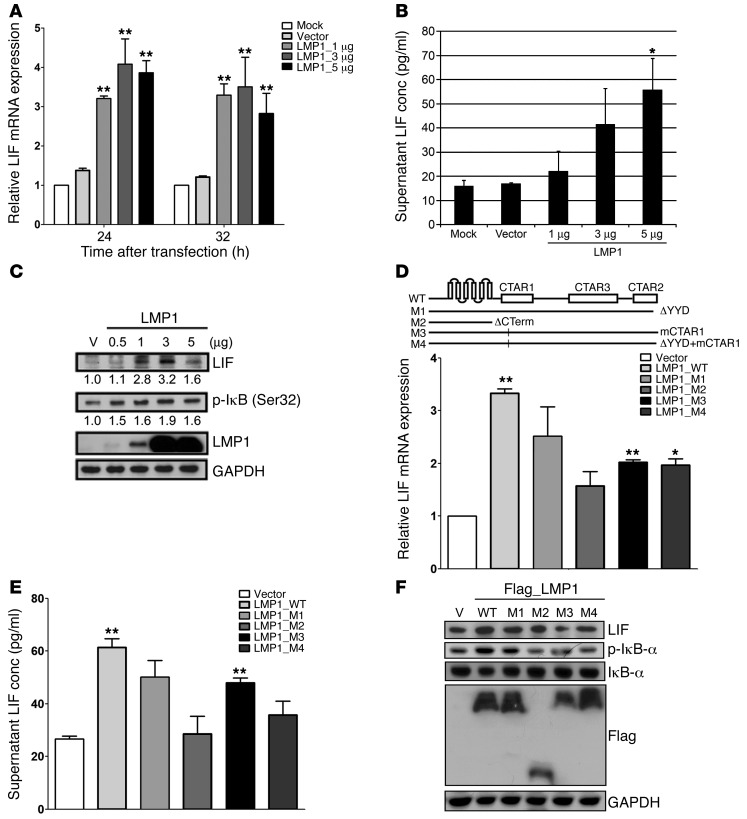
LMP1 is the most important EBV-encoded oncoprotein in NPC. To determine whether LMP1 could induce LIF expression, we transiently transfected plasmids expressing wild-type LMP1 into TW06 cells and assessed LIF expression. The mRNA expression of LIF was significantly upregulated by LMP1, showing 2.5- and 3-fold increases at 24 and 32 hours after transfection, respectively (Figure 8A). Likewise, a bead-based cytokine assay (Bio-Rad) showed that the amount of LIF secreted into the medium of TW06 cells was dose dependently increased by LMP1 expression (Figure 8B). Since the activation of NF-κB is tightly controlled by the inhibitor of NF-κB (IκB), we used Western blotting analysis to assess correlations between intracellular LIF expression and the phosphorylation level of IκB (Ser32). As shown in Figure 8C, the levels of LIF and p-IκB were elevated in LMP1-expressing cells. LMP1 mediates NF-κB activation mainly through its C terminus–activating regions, CTAR1 and CTAR2. To further investigate whether the C terminus of LMP1 was involved in regulating LIF expression, we ectopically expressed wild-type or relevant LMP1 mutants in TW06 cells and then assessed the expression of LIF. As shown in Figure 8D, wild-type LMP1 expression resulted in the highest mRNA expression of LIF. In contrast, mutations in CTAR2 (M1) or CTAR1 (M3) or both (M4) decreased LIF expression by approximately 25% to 39% compared with that induced by wild-type LMP1, and deletion of the LMP1 C terminus (M2) reduced LIF expression by 53% (Figure 8D). LIF expression in the supernatants from cultured cells expressing either wild-type or mutant LMP1 matched the expression pattern of LIF mRNA (Figure 8E). The Western blotting results revealed that the CTAR1 and CTAR2 domains of LMP1 both contributed to the expression of LIF and activation of IκB (Figure 8F). These findings suggested a possible regulatory mechanism, wherein LMP1 CTAR domains might regulate the expression of LIF via NF-κB.
Figure 8. EBV-encoded LMP1 activates LIF expression.
(A) Assessment of LMP1-induced upregulation of LIF mRNA in TW06 cells. Cells were transfected with various doses of LMP1-expressing or control vectors. (B) Quantification of secreted LIF in cell-free culture supernatants collected at 24 hours after transfection in TW06 cells. (C) Western blotting analysis of LIF and p-IκB in TW06 cells transfected with increasing doses of LMP1. Protein lysates were harvested at 24 hours after transfection. GAPDH was used as the loading control. (D–F) Mutations or deletion in the CTAR domains of LMP1 affect expression of LIF. Total RNA, culture supernatants, and protein lysates were harvested at 24 hours after transfection in TW06 cells. Relative LIF mRNA expression (D), secreted LIF (E), and LIF expression in protein lysates (F) were shown. mRNA expression was normalized to that of COL4A6 (Supplemental Table 3), which showed unchanged expression levels across NPC microarray experiments (GSE14262). GAPDH was used as the loading control of proteins. *P < 0.05; **P < 0.01, paired t test.
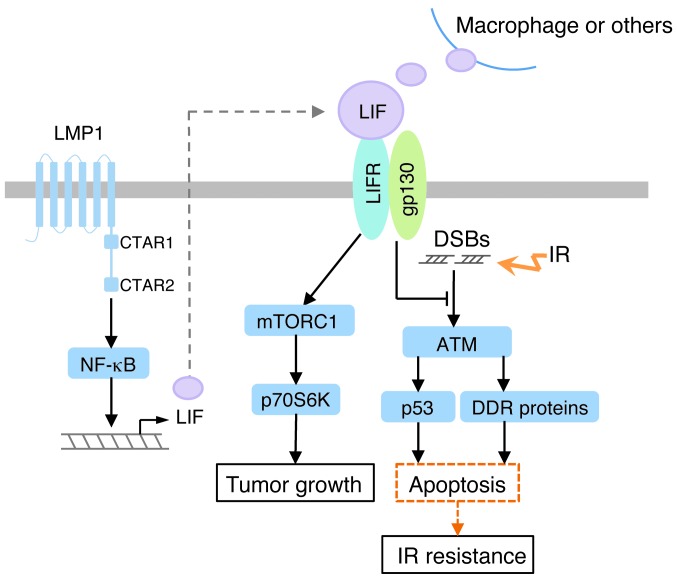
Based on our findings, we propose a model for LIF-mediated signaling and enhancement of NPC tumorigenesis (Figure 9). In this model, LIF activates mTORC1/p70S6K signaling to promote tumor growth while concurrently inhibiting the apoptosis mediated by p53 and DDR proteins in response to IR.
Figure 9. The proposed model for LIF-mediated signaling and the biological effects of LIF in NPC.
LIF activates mTORC1/p70S6K signaling via LIFR, leading to increased tumor growth. LIF also enhances cell survival following IR treatment, at least partly by inhibiting IR-induced apoptosis and DDRs. In NPC cells, EBV-encoded LMP1 can induce LIF expression through NF-κB activation.
Discussion
The present study uncovered new roles of LIF in cancer. Our results demonstrate that (a) elevated serum LIF levels predict poorer local recurrence-free survival of NPC patients; (b) LIF activates mTOR1-p70S6K signaling to promote NPC tumor growth; (c) LIF modulates DDRs and enhances radioresistance; (d) LIF and LIFR are overexpressed in the tumor cells of NPC biopsies, and the expression levels of LIF, activated p70S6K and mTOR are markedly correlated; (e) administration of the LIF antagonist, sLIFR, or the mTOR inhibitor, rapamycin, markedly reduces cell growth and survival following IR; and (f) EBV-encoded LMP1 might be involved in regulating LIF expression.
Our IHC data revealed that both LIF and LIFR were overexpressed in NPC tumor cells. Controversy exists over the roles of LIF and LIFR in human cancers. LIF functions as a growth factor in pancreatic carcinoma (48), choriocarcinoma (49), breast cancer (50), and prostate cancer (51) and as a growth inhibitory factor in cervical carcinoma (52) and medullary thyroid cancer (53), whereas LIFR has been implicated as a tumor suppressor in breast cancer (54) and hepatocellular carcinoma (55). A recent report indicates that LIFR functions as a potential metastasis suppressor in human breast cancer cells through activation of Hippo/YAP pathway (26). The Hippo/YAP signaling pathway has a dual role, stimulating cell growth but also promoting apoptosis (56). YAP functions as a tumor suppressor in breast cancer (57). However, YAP has also been implicated as an oncogene in many tumor malignancies (56, 58). Tumaneng et al. further demonstrated that the Hippo/YAP pathway is an upstream regulator of mTOR in the regulation of cell size and growth (59). Interestingly, LIF was found to activate the YAP/TEAD2 pathway and regulate self renewal of mouse ES cells (60). It is interesting to investigate whether LIF-mediated activation of mTOR-p70S6K and prosurvival functions in NPC cells links to the Hippo/YAP pathway.
NPC appears to be able to circumvent local immune surveillance by supporting the expression of a few EBV proteins that counteract the immune system. Notably, the EBV-encoded LMP1 can activate the NF-κB and STAT3 signaling pathways, thereby modulating the immune response in cancer cells (61, 62). Our data showed that EBV infection and ectopic expression of LMP1 in NPC cells could both induce LIF expression. Importantly, LIF has been implicated in human mesenchymal stem cell–mediated immunosuppression (63). It is reasonable to speculate that EBV or LMP1 directs the expression of LIF to help EBV itself escape immune surveillance.
Approximately 50% of all cancer patients receive radiotherapy (64, 65). It is worth noting that about 20% of NPC patients develop local recurrence after radiotherapy and the relapsed NPC is usually more advanced (5). In many types of tumor, recurrence has been linked to the acquired radioresistance (66). The surviving tumor cells become adaptive to IR during fractionated radiotherapy and repopulate within a treatment time. IR-induced production of proinflammatory cytokines such as IL-1β, IL-6, TNF-α, COX-2, and IL-8 contributes to the acquired radioresistance by activating survival pathways, including the EGFR pathway, the STAT3 pathway, and the PI3K/AKT pathway (65, 67). We report that LIF can activate prosurvival signaling, including mTOR-p70S6k and STAT3 in NPC cells. It will be intriguing to determine whether the fractionated radiotherapy induces LIF production, which in turn contributes to radioadaptive response.
The inflammatory cytokines play a pivotal role in modulating tumor responses to irradiation (67), yet few serum cytokines have been validated as reliable markers in predicting radiosensitivity. In this study, we report that higher serum LIF levels predicted poorer local recurrence-free survival of NPC patients. Consistent with this finding, we found that higher levels of LIF rendered NPC cells resistant to IR both in vitro and in vivo. Considering that a relatively large number of samples were tested in this study, our findings suggest that LIF could potentially be used to simply and efficiently predict individual radiosensitivity from blood samples. In the future, the sensitivity and specificity of LIF for predicting NPC radiosensitivity should be verified using independent sets of NPC samples, samples from patients with other cancers or noncancer diseases, and samples from healthy individuals. Due to the heterogeneous nature of cancer, additional studies should also assess the use of panels that combine LIF with other biomarkers. Finally, the other candidate cytokines identified being differentially expressed in our multiplex cytokine assay (e.g., CXCL9, IL-10, IL-6, and SCF) should be subjected to further testing for their possible involvements in NPC radioresistance.
Taken together, the results of this study suggest that there is a pivotal link between LIF and mTOR-p70S6K signaling in NPC progression and provide insights into the role of LIF in cancer biology. Furthermore, our findings indicate that LIF might be a valuable biomarker for predicting tumor radiosensitivity and suggest that inhibiting the interactions between LIF and downstream targets, such as with a LIF antagonist, could be an attractive approach for sensitizing the radioresistant NPC tumor cells.
Methods
Additional information can be found in Supplemental Methods.
Clinical samples.
A total of 161 pretreatment NPC serum samples and 28 serum samples obtained from healthy donors (controls) were used in this study; the enrolled cases included 37 patients with distant metastases, 41 with local recurrence, and 91 with complete remission. Eight of the NPC cases developed local recurrence and distal metastasis simultaneously after treatment. All patients completed radiotherapy. The radiation doses were 6840–7600 cGy/7–8 weeks. Any recurrence located at the primary site (including brain invasion) was considered to be a local recurrence. The time until local recurrence of NPC was used as the outcome measurement. Local recurrence-free survival was calculated as the time from the initiation of primary radiotherapy to the date of pathologic diagnosis or clinical evidence of local failure. Retropharyngeal lymph node or neck lymph node metastasis was considered to be a regional recurrence. Any relapse other than local or regional recurrence was considered to be a distant metastasis. Any metastasis that occurred within 2 months after the starting date of radiotherapy was excluded. The majority of the NPC patients experienced distant metastasis within 2 years after the completion of primary radiotherapy. Progression-free survival was defined as the disease remaining stable after the start date of radiotherapy. All individuals were followed for more than 3 years after treatment (median follow-up time, 3.6 years). Biopsy samples were collected from 106 of the NPC patients and subjected to IHC analysis. All NPC tumors were histologically confirmed by pathologists.
IHC.
IHC staining of tissue sections was performed as previously described (68), using rabbit anti-human LIF (1:100), rabbit anti–phospho-mTOR (S2448) (1:100) (all from Epitomics), rabbit anti-human phospho-p70S6K (Ser424) (1:150) (LSBio), mouse anti-human phospho-p70S6K (Thr389) (1:100) (Cell Signaling), rabbit anti-human LIFR (1:400), and rabbit anti-human gp130 (1:100) (Santa Cruz Biotechnology Inc.) as the primary antibodies. Human glioblastoma multiforme tissue sections were used as positive controls for LIF and LIFR expressions (21), and human breast cancer tissue sections were used as positive controls for phospho-mTOR and phospho-p70S6K expressions (refs. 69, 70, and Supplemental Figure 12). The primary antibody was omitted from negative controls. Staining of the basal layer of normal epithelium within nasopharyngeal biopsy samples served as a normal control. IHC expression was scored on a 0-to-4 scale according to the staining intensity and extent, as follows: 0, negative or weak staining in 10% or more of cells; 1, weak staining in 11%–30% of cells; 2, weak staining in more than 30% of cells or moderate staining in less than 30% of cells; 3, moderate staining in 30%–60% of cells; and 4, moderate or strong staining in more than 60% of cells. The IHC results were independently reviewed by 2 pathologists.
Real-time monitoring of cellular responses using the xCelligence system.
Cell impedance was continuously monitored using an xCelligence real-time analyzer (Roche Applied Science). Prior to cell seeding, the background impedance of each E-plate was determined using plates loaded with 60 μl of culture medium per well. NPC cells (6 × 10³ cells in 100 μl/well) were plated and allowed to grow overnight at 37°C prior to experiments. Cell impedance was recorded every 10 minutes for 3 to 4 days. All experiments were performed in triplicate. The cell index values were normalized with respect to the time points, as indicated. Concentration-response curves were generated for the different time points, and the IC50 and EC50 were determined for the incubation period.
Generation of bioluminescent NPC cell lines.
CNE1 and TW06 cells were infected with ready-to-use lentiviruses containing a firefly luciferase 2 (luc2) reporter gene and a puromycin resistant gene (Lenti-fire; In Vivo Imaging Solutions) in the presence of 6 μg/ml of polybrene (Sigma-Aldrich), followed by screening with puromycin (5 μg/ml) (Invitrogen). The selected clones (CNE1_Luc2 and TW06_Luc2) were analyzed for their luciferase activity by in vitro monitoring of bioluminescence (GloMax 20/20 Single Tube Luminometer; Promega). Isolated clones were maintained in complete medium supplemented with 3 μg/ml of puromycin.
Animal experiments.
NOD/SCID mice were obtained from BioLASCO (Taiwan). TW06_Luc2 or CNE1_Luc2 cells (1 × 10⁶/100 μl DMEM) were subcutaneously implanted into the thighs of 7-week-old male NOD/SCID mice. When the tumor volume reached about 50 mm3, 5 to 6 mice were randomly assigned to each of 3 experimental groups (PBS, LIF, and sLIFR). PBS, human LIF (150–200 ng/20 μl PBS, twice/week × 4 weeks), and sLIFR (1–2 μg/20 μl PBS, twice/week × 4 weeks) were administered via intratumoral injection. Rapamycin (LC Labs) was dissolved in absolute ethanol to create a concentration of 50 mg/ml and diluted in 5% Tween 80, 5% polyethylene glycol 400, NaCl 0.9%, before injection. Mice were treated with either vehicle (DMSO in 5% Tween 80, 5% polyethylene glycol 400, 0.9% NaCl) or 3 mg/kg rapamycin by intraperitoneal injection once a day for 5 consecutive days with 2 days of rest for a period of 3 weeks. Tumor progression was monitored once a week by IVIS. Briefly, mice were anesthetized with isoflurane gas and injected intraperitoneally (150 mg/kg) with D-luciferin solution (Promega), and bioluminescent images were measured using an IVIS Spectrum (Xenogen IVIS 100; Caliper). Bioluminescent signals were quantified from ROIs using the Living Image software (Xenogen). Mice were maintained under specific pathogen–free conditions at the Laboratory Animal Center of Chang Gung University.
Statistics.
Statistical analyses were performed using SPSS 16.0 (SPSS) or GraphPad Prism 5 (GraphPad Software). The significance of Kaplan–Meier survival analyses was determined using log-rank tests. The 0, 1 criterion was used to select the cutoff value of serum LIF from the ROC curve to discriminate among patients with or without local recurrence. Factors related to prognosis were analyzed using multivariate regression with the Cox proportional hazards regression model. IHC analyses of LIF and LIFR immunoreactivity in human NPC biopsies were assessed using the χ2 test. Spearman’s rank correlation coefficient was used to evaluate the correlation between IHC results (staining intensity × percentage). All statistical tests were 2-sided.
Study approval.
This study was approved by the Institutional Review Board of Chang Gung Memorial Hospital, Taiwan (IRB number, 98-2552B). Written informed consent was obtained from all participants prior to inclusion in the study. All animal experiments were conducted according to the accepted principles of laboratory animal care and approved by the Institutional Animal Care and Use Committee of Chang Gung University (IACUC approval no. CGU11-120).
Supplementary Material
Acknowledgments
This work was supported by grants from the Ministry of Education, Taiwan (to Chang Gung University) and Chang Gung Memorial Hospital (grant numbers CMRPG390651, CMRPD190131, and CMPRG3C0791).
Footnotes
Conflict of interest: The authors have declared that no conflict of interest exists.
Citation for this article: J Clin Invest. 2013;123(12):5269–5283. doi:10.1172/JCI63428.
See the related Commentary beginning on page 4999.
References
- 1.Lo KW, To KF, Huang DP. Focus on nasopharyngeal carcinoma. Cancer Cell. 2004;5(5):423–428. doi: 10.1016/S1535-6108(04)00119-9. [DOI] [PubMed] [Google Scholar]
- 2.Thompson MP, Kurzrock R. Epstein-Barr virus and cancer. Clin Cancer Res. 2004;10(3):803–821. doi: 10.1158/1078-0432.CCR-0670-3. [DOI] [PubMed] [Google Scholar]
- 3.Young LS, Rickinson AB. Epstein-Barr virus: 40 years on. Nat Rev Cancer. 2004;4(10):757–768. doi: 10.1038/nrc1452. [DOI] [PubMed] [Google Scholar]
- 4.Raab-Traub N. Epstein-Barr virus in the pathogenesis of NPC. Semin Cancer Biol. 2002;12(6):431–441. doi: 10.1016/S1044579X0200086X. [DOI] [PubMed] [Google Scholar]
- 5.Suarez C, Rodrigo JP, Rinaldo A, Langendijk JA, Shaha AR, Ferlito A. Current treatment options for recurrent nasopharyngeal cancer. Eur Arch Otorhinolaryngol. 2010;267(12):1811–1824. doi: 10.1007/s00405-010-1385-x. [DOI] [PMC free article] [PubMed] [Google Scholar]
- 6.Canman CE, et al. Activation of the ATM kinase by ionizing radiation and phosphorylation of p53. Science. 1998;281(5383):1677–1679. doi: 10.1126/science.281.5383.1677. [DOI] [PubMed] [Google Scholar]
- 7.Squatrito M, Brennan CW, Helmy K, Huse JT, Petrini JH, Holland EC. Loss of ATM/Chk2/p53 pathway components accelerates tumor development and contributes to radiation resistance in gliomas. Cancer Cell. 2010;18(6):619–629. doi: 10.1016/j.ccr.2010.10.034. [DOI] [PMC free article] [PubMed] [Google Scholar]
- 8.Westphal CH, Rowan S, Schmaltz C, Elson A, Fisher DE, Leder P. atm and p53 cooperate in apoptosis and suppression of tumorigenesis, but not in resistance to acute radiation toxicity. Nat Genet. 1997;16(4):397–401. doi: 10.1038/ng0897-397. [DOI] [PubMed] [Google Scholar]
- 9.Lavin MF, Kozlov S. ATM activation and DNA damage response. Cell Cycle. 2007;6:931–942. doi: 10.4161/cc.6.8.4180. [DOI] [PubMed] [Google Scholar]
- 10.Khanna KK, Lavin MF, Jackson SP, Mulhern TD. ATM, a central controller of cellular responses to DNA damage. Cell Death Differ. 2001;8(11):1052–1065. doi: 10.1038/sj.cdd.4400874. [DOI] [PubMed] [Google Scholar]
- 11.Kastan MB, Lim DS. The many substrates and functions of ATM. Nat Rev Mol Cell Biol. 2000;1(3):179–186. doi: 10.1038/35043058. [DOI] [PubMed] [Google Scholar]
- 12.Ivashkevich A, Redon CE, Nakamura AJ, Martin RF, Martin OA. Use of the gamma-H2AX assay to monitor DNA damage and repair in translational cancer research. Cancer Lett. 2012;327(1–2):123–133. doi: 10.1016/j.canlet.2011.12.025. [DOI] [PMC free article] [PubMed] [Google Scholar]
- 13.Wei WI, Sham JS. Nasopharyngeal carcinoma. Lancet. 2005;365(9476):2041–2054. doi: 10.1016/S0140-6736(05)66698-6. [DOI] [PubMed] [Google Scholar]
- 14.Ma BB, et al. The prognostic significance of tumor vascular invasion and its association with plasma Epstein-Barr virus DNA, tumor volume and metabolic activity in locoregionally advanced nasopharyngeal carcinoma. Oral Oncol. 2008;44(11):1067–1072. doi: 10.1016/j.oraloncology.2008.02.001. [DOI] [PubMed] [Google Scholar]
- 15.Le QT, et al. A comparison study of different PCR assays in measuring circulating plasma epstein-barr virus DNA levels in patients with nasopharyngeal carcinoma. Clin Cancer Res. 2005;11(16):5700–5707. doi: 10.1158/1078-0432.CCR-05-0648. [DOI] [PubMed] [Google Scholar]
- 16.Lin JC, et al. Quantification of plasma Epstein-Barr virus DNA in patients with advanced nasopharyngeal carcinoma. N Engl J Med. 2004;350(24):2461–2470. doi: 10.1056/NEJMoa032260. [DOI] [PubMed] [Google Scholar]
- 17.Li G, et al. MicroRNA-10b induced by Epstein-Barr virus-encoded latent membrane protein-1 promotes the metastasis of human nasopharyngeal carcinoma cells. Cancer Lett. 2010;299(1):29–36. doi: 10.1016/j.canlet.2010.07.021. [DOI] [PubMed] [Google Scholar]
- 18.Morris MA, Dawson CW, Young LS. Role of the Epstein-Barr virus-encoded latent membrane protein-1, LMP1, in the pathogenesis of nasopharyngeal carcinoma. Future Oncol. 2009;5(6):811–825. doi: 10.2217/fon.09.53. [DOI] [PubMed] [Google Scholar]
- 19.Burdon T, Smith A, Savatier P. Signalling, cell cycle and pluripotency in embryonic stem cells. Trends Cell Biol. 2002;12(9):432–438. doi: 10.1016/S0962-8924(02)02352-8. [DOI] [PubMed] [Google Scholar]
- 20.Pera MF, Tam PP. Extrinsic regulation of pluripotent stem cells. Nature. 2010;465(7299):713–720. doi: 10.1038/nature09228. [DOI] [PubMed] [Google Scholar]
- 21.Penuelas S, et al. TGF-beta increases glioma-initiating cell self-renewal through the induction of LIF in human glioblastoma. Cancer Cell. 2009;15(4):315–327. doi: 10.1016/j.ccr.2009.02.011. [DOI] [PubMed] [Google Scholar]
- 22.Lumachi F, Basso SM, Orlando R. Cytokines, thyroid diseases and thyroid cancer. Cytokine. 2010;50(3):229–233. doi: 10.1016/j.cyto.2010.03.005. [DOI] [PubMed] [Google Scholar]
- 23.Wysoczynski M, et al. Leukemia inhibitory factor: a newly identified metastatic factor in rhabdomyosarcomas. Cancer Res. 2007;67(5):2131–2140. doi: 10.1158/0008-5472.CAN-06-1021. [DOI] [PubMed] [Google Scholar]
- 24.Kamohara H, Takahashi M, Ishiko T, Ogawa M, Baba H. Induction of interleukin-8 (CXCL-8) by tumor necrosis factor-alpha and leukemia inhibitory factor in pancreatic carcinoma cells: Impact of CXCL-8 as an autocrine growth factor. Int J Oncol. 2007;31(3):627–632. [PubMed] [Google Scholar]
- 25.Kamohara H, Ogawa M, Ishiko T, Sakamoto K, Baba H. Leukemia inhibitory factor functions as a growth factor in pancreas carcinoma cells: Involvement of regulation of LIF and its receptor expression. Int J Oncol. 2007;30(4):977–983. [PubMed] [Google Scholar]
- 26.Chen D, et al. LIFR is a breast cancer metastasis suppressor upstream of the Hippo-YAP pathway and a prognostic marker. Nat Med. 2012;18(10):1511–1517. doi: 10.1038/nm.2940. [DOI] [PMC free article] [PubMed] [Google Scholar]
- 27.Auernhammer CJ, Melmed S. Leukemia-inhibitory factor-neuroimmune modulator of endocrine function. Endocr Rev. 2000;21(3):313–345. doi: 10.1210/er.21.3.313. [DOI] [PubMed] [Google Scholar]
- 28.Oshima K, Teo DT, Senn P, Starlinger V, Heller S. LIF promotes neurogenesis and maintains neural precursors in cell populations derived from spiral ganglion stem cells. BMC Dev Biol. 2007;7:112. doi: 10.1186/1471-213X-7-112. [DOI] [PMC free article] [PubMed] [Google Scholar]
- 29.Palmqvist P, Persson E, Conaway HH, Lerner UH. IL-6, leukemia inhibitory factor, and oncostatin M stimulate bone resorption and regulate the expression of receptor activator of NF-κB ligand, osteoprotegerin, and receptor activator of NF-κB in mouse calvariae. J Immunol. 2002;169(6):3353–3362. doi: 10.4049/jimmunol.169.6.3353. [DOI] [PubMed] [Google Scholar]
- 30.Zhang J-G, et al. Identification and characterization of two distinct truncated forms of gp130 and a soluble form of leukemia inhibitory factor receptor α-chain in normal human urine and plasma. J Biol Chem. 1998;273(17):10798–10805. doi: 10.1074/jbc.273.17.10798. [DOI] [PubMed] [Google Scholar]
- 31.Jostock T, et al. Soluble gp130 is the natural inhibitor of soluble interleukin-6 receptor transsignaling responses. Eur J Biochem. 2001;268(1):160–167. doi: 10.1046/j.1432-1327.2001.01867.x. [DOI] [PubMed] [Google Scholar]
- 32.Zhang S, Wu Y, Zeng Y, Zech L, Klein G. Cytogenetic studies on an epithelioid cell line derived from nasopharyngeal carcinoma. Hereditas. 1982;97(1):23–28. doi: 10.1111/j.1601-5223.1982.tb00706.x. [DOI] [PubMed] [Google Scholar]
- 33.Lin CT, et al. Establishment and characterization of two nasopharyngeal carcinoma cell lines. Lab Invest. 1990;62(6):713–724. [PubMed] [Google Scholar]
- 34.Lin CT, et al. Characterization of seven newly established nasopharyngeal carcinoma cell lines. Lab Invest. 1993;68(6):716–727. [PubMed] [Google Scholar]
- 35.Cheung ST, et al. Nasopharyngeal carcinoma cell line (C666-1) consistently harbouring Epstein-Barr virus. Int J Cancer. 1999;83(1):121–126. doi: 10.1002/(SICI)1097-0215(19990924)83:1<121::AID-IJC21>3.0.CO;2-F. [DOI] [PubMed] [Google Scholar]
- 36.Kam Y, Exton JH. Role of phospholipase D1 in the regulation of mTOR activity by lysophosphatidic acid. FASEB J. 2004;18(2):311–319. doi: 10.1096/fj.03-0731com. [DOI] [PubMed] [Google Scholar]
- 37.Zhang Y, Dong Z, Nomura M, Zhong S, Chen N, Bode AM. Signal transduction pathways involved in phosphorylation and activation of p70S6K following exposure to UVA irradiation. J Biol Chem. 2001;276(24):20913–20923. doi: 10.1074/jbc.M009047200. [DOI] [PubMed] [Google Scholar]
- 38.Huang C, et al. Ultraviolet-induced phosphorylation of p70(S6K) at Thr(389) and Thr(421)/Ser(424) involves hydrogen peroxide and mammalian target of rapamycin but not Akt and atypical protein kinase C. Cancer Res. 2002;62(20):5689–5697. [PubMed] [Google Scholar]
- 39.Salmond RJ, Emery J, Okkenhaug K, Zamoyska R. MAPK, phosphatidylinositol 3-kinase, and mammalian target of rapamycin pathways converge at the level of ribosomal protein S6 phosphorylation to control metabolic signaling in CD8 T cells. J Immunol. 2009;183(11):7388–7397. doi: 10.4049/jimmunol.0902294. [DOI] [PubMed] [Google Scholar]
- 40.An WL, et al. Up-regulation of phosphorylated/activated p70 S6 kinase and its relationship to neurofibrillary pathology in Alzheimer’s disease. Am J Pathol. 2003;163(2):591–607. doi: 10.1016/S0002-9440(10)63687-5. [DOI] [PMC free article] [PubMed] [Google Scholar]
- 41.Ma XM, Blenis J. Molecular mechanisms of mTOR-mediated translational control. Nat Rev Mol Cell Biol. 2009;10(5):307–318. doi: 10.1038/nrm2672. [DOI] [PubMed] [Google Scholar]
- 42.Liu P, Cheng H, Roberts TM, Zhao JJ. Targeting the phosphoinositide 3-kinase pathway in cancer. Nat Rev Drug Discov. 2009;8(8):627–644. doi: 10.1038/nrd2926. [DOI] [PMC free article] [PubMed] [Google Scholar]
- 43.Dennis PB, Pullen N, Kozma SC, Thomas G. The principal rapamycin-sensitive p70(s6k) phosphorylation sites, T-229 and T-389, are differentially regulated by rapamycin-insensitive kinase kinases. Mol Cell Biol. 1996;16(11):6242–6251. doi: 10.1128/mcb.16.11.6242. [DOI] [PMC free article] [PubMed] [Google Scholar]
- 44.Pearson RB, et al. The principal target of rapamycin-induced p70s6k inactivation is a novel phosphorylation site within a conserved hydrophobic domain. EMBO J. 1995;14(21):5279–5287. doi: 10.1002/j.1460-2075.1995.tb00212.x. [DOI] [PMC free article] [PubMed] [Google Scholar]
- 45.Fenton TR, Gout IT. Functions and regulation of the 70kDa ribosomal S6 kinases. Int J Biochem Cell Biol. 2011;43(1):47–59. doi: 10.1016/j.biocel.2010.09.018. [DOI] [PubMed] [Google Scholar]
- 46.Chang JT, et al. Differentially expressed genes in radioresistant nasopharyngeal cancer cells: gp96 and GDF15. Mol Cancer Ther. 2007;6(8):2271–2279. doi: 10.1158/1535-7163.MCT-06-0801. [DOI] [PubMed] [Google Scholar]
- 47.Lavin MF. Ataxia-telangiectasia: from a rare disorder to a paradigm for cell signalling and cancer. Nat Rev Mol Cell Biol. 2008;9(10):759–769. doi: 10.1038/nrm2514. [DOI] [PubMed] [Google Scholar]
- 48.Kamohara H, Ogawa M, Ishiko T, Sakamoto K, Baba H. Leukemia inhibitory factor functions as a growth factor in pancreas carcinoma cells: involvement of regulation of LIF and its receptor expression. Int J Oncol. 2007;30(4):977–983. [PubMed] [Google Scholar]
- 49.Fitzgerald JS, et al. Leukemia inhibitory factor triggers activation of signal transducer and activator of transcription 3, proliferation, invasiveness, and altered protease expression in choriocarcinoma cells. Int J Biochem Cell Biol. 2005;37(11):2284–2296. doi: 10.1016/j.biocel.2005.02.025. [DOI] [PubMed] [Google Scholar]
- 50.Estrov Z, et al. Leukemia inhibitory factor binds to human breast cancer cells and stimulates their proliferation. J Interferon Cytokine Res. 1995;15(10):905–913. doi: 10.1089/jir.1995.15.905. [DOI] [PubMed] [Google Scholar]
- 51.Kellokumpu-Lehtinen P, Talpaz M, Harris D, Van Q, Kurzrock R, Estrov Z. Leukemia-inhibitory factor stimulates breast, kidney and prostate cancer cell proliferation by paracrine and autocrine pathways. Int J Cancer. 1996;66(4):515–519. doi: 10.1002/(SICI)1097-0215(19960516)66:4<515::AID-IJC15>3.0.CO;2-6. [DOI] [PubMed] [Google Scholar]
- 52.Bay JM, Patterson BK, Teng NN. Leukemia inhibitory factor downregulates human papillomavirus-16 oncogene expression and inhibits the proliferation of cervical carcinoma cells. Infect Dis Obstet Gynecol. 2011;2011:463081. doi: 10.1155/2011/463081. [DOI] [PMC free article] [PubMed] [Google Scholar]
- 53.Arthan D, Hong SK, Park JI. Leukemia inhibitory factor can mediate Ras/Raf/MEK/ERK-induced growth inhibitory signaling in medullary thyroid cancer cells. Cancer Lett. 2010;297(1):31–41. doi: 10.1016/j.canlet.2010.04.021. [DOI] [PubMed] [Google Scholar]
- 54.Iorns E, et al. Whole genome in vivo RNAi screening identifies the leukemia inhibitory factor receptor as a novel breast tumor suppressor. Breast Cancer Res Treat. 2012;135(1):79–91. doi: 10.1007/s10549-012-2068-7. [DOI] [PubMed] [Google Scholar]
- 55.Okamura Y, et al. Leukemia inhibitory factor receptor (LIFR) is detected as a novel suppressor gene of hepatocellular carcinoma using double-combination array. Cancer Lett. 2010;289(2):170–177. doi: 10.1016/j.canlet.2009.08.013. [DOI] [PubMed] [Google Scholar]
- 56.Pan D. The hippo signaling pathway in development and cancer. Dev Cell. 2010;19(4):491–505. doi: 10.1016/j.devcel.2010.09.011. [DOI] [PMC free article] [PubMed] [Google Scholar]
- 57.Yuan M, et al. Yes-associated protein (YAP) functions as a tumor suppressor in breast. Cell Death Differ. 2008;15(11):1752–1759. doi: 10.1038/cdd.2008.108. [DOI] [PubMed] [Google Scholar]
- 58.Zeng Q, Hong W. The emerging role of the hippo pathway in cell contact inhibition, organ size control, and cancer development in mammals. Cancer Cell. 2008;13(3):188–192. doi: 10.1016/j.ccr.2008.02.011. [DOI] [PubMed] [Google Scholar]
- 59.Tumaneng K, et al. YAP mediates crosstalk between the Hippo and PI(3)K-TOR pathways by suppressing PTEN via miR-29. Nat Cell Biol. 2012;14(12):1322–1329. doi: 10.1038/ncb2615. [DOI] [PMC free article] [PubMed] [Google Scholar]
- 60.Tamm C, Böwer N, Annerén C. Regulation of mouse embryonic stem cell self-renewal by a Yes–YAP–TEAD2 signaling pathway downstream of LIF. J Cell Sci. 2011;124(Pt 7):1136–1144. doi: 10.1242/jcs.075796. [DOI] [PubMed] [Google Scholar]
- 61.Middeldorp JM, Pegtel DM. Multiple roles of LMP1 in Epstein-Barr virus induced immune escape. Semin Cancer Biol. 2008;18(6):388–396. doi: 10.1016/j.semcancer.2008.10.004. [DOI] [PubMed] [Google Scholar]
- 62.Pai S, Khanna R. Role of LMP1 in immune control of EBV infection. Semin Cancer Biol. 2001;11(6):455–460. doi: 10.1006/scbi.2001.0412. [DOI] [PubMed] [Google Scholar]
- 63.Nasef A, et al. Leukemia inhibitory factor: Role in human mesenchymal stem cells mediated immunosuppression. Cell Immunol. 2008;253(1–2):16–22. doi: 10.1016/j.cellimm.2008.06.002. [DOI] [PubMed] [Google Scholar]
- 64.Delaney G, Jacob S, Featherstone C, Barton M. The role of radiotherapy in cancer treatment: estimating optimal utilization from a review of evidence-based clinical guidelines. Cancer. 2005;104(6):1129–1137. doi: 10.1002/cncr.21324. [DOI] [PubMed] [Google Scholar]
- 65.Bentzen SM. Preventing or reducing late side effects of radiation therapy: radiobiology meets molecular pathology. Nat Rev Cancer. 2006;6(9):702–713. doi: 10.1038/nrc1950. [DOI] [PubMed] [Google Scholar]
- 66.Kim JJ, Tannock IF. Repopulation of cancer cells during therapy: an important cause of treatment failure. Nat Rev Cancer. 2005;5(7):516–525. doi: 10.1038/nrc1650. [DOI] [PubMed] [Google Scholar]
- 67.Deorukhkar A, Krishnan S. Targeting inflammatory pathways for tumor radiosensitization. Biochem Pharmacol. 2010;80(12):1904–1914. doi: 10.1016/j.bcp.2010.06.039. [DOI] [PMC free article] [PubMed] [Google Scholar]
- 68.Chen CC, Chen LC, Liang Y, Tsang NM, Chang YS. Epstein-Barr virus latent membrane protein 1 induces the chemotherapeutic target, thymidine phosphorylase, via NF-κB and p38 MAPK pathways. Cell Signal. 2010;22(7):1132–1142. doi: 10.1016/j.cellsig.2010.03.008. [DOI] [PubMed] [Google Scholar]
- 69.Bakarakos P, et al. Immunohistochemical study of PTEN and phosphorylated mTOR proteins in familial and sporadic invasive breast carcinomas. Histopathology. 2010;56(7):876–882. doi: 10.1111/j.1365-2559.2010.03570.x. [DOI] [PubMed] [Google Scholar]
- 70.Heinonen H, et al. Deciphering downstream gene targets of PI3K/mTOR/p70S6K pathway in breast cancer. BMC Genomics. 2008;9:348. doi: 10.1186/1471-2164-9-348. [DOI] [PMC free article] [PubMed] [Google Scholar]
Associated Data
This section collects any data citations, data availability statements, or supplementary materials included in this article.


