Abstract
Polymeric composite microspheres consisting of a poly(D,L-lactic-co-glycolic acid) (PLGA) core surrounded by a poly(D,L-lactic acid) (PDLLA) shell layer were successfully fabricated by coaxial electrohydrodynamic atomization (CEHDA) process. Process conditions, including nozzle voltage and polymer solution flow rates, as well as solution parameters, such as polymer concentrations, were investigated to ensure the formation of composite microspheres with a doxorubicin-loaded PLGA core surrounded by a relatively drug-free PDLLA shell layer. Various microsphere formulations were fabricated and characterized in terms of their drug distribution, encapsulation efficiency and in vitro release. Numerical simulation of CEHDA process was performed based on a computational fluid dynamics (CFD) model in Fluent by employing the process conditions and fluid properties used in the experiments. The simulation results were compared with the experimental work to illustrate the capability of the CFD model to predict the production of consistent compound droplets, and hence, the expected core-shell structured microspheres.
Keywords: Coaxial electrohydrodynamic atomization, core-shell structured microspheres, polymers, mathematical modeling, simulation, multiphase flow
1. Introduction
The electrohydrodynamic atomization (EHDA) technology has gained considerable attention in several fields (Bock et al., 2012; Chakraborty et al., 2009; Fenn et al., 1989; Yoon et al., 2011). Much attention has concentrated on the operation of electrospray process in the Taylor cone-jet mode, which can produce uniform micro- or nano-sized particles (Chen et al., 1995; Hu et al., 2012; Rosell-Llompart and Fernández de la Mora, 1994). A typical EHDA setup consists of a metallic nozzle connected to a high-voltage power supply and a grounded collector placed beneath the nozzle. There are three main stages in the EHDA process. The first stage involves acceleration of liquid and formation of liquid cone-jet. This phenomenon is a result of the balance of various forces, including surface tension, gravity, electrical stresses in the liquid cone, and inertial and viscous stresses. The second stage involves jet breakup into droplets due to interfacial instability. The third stage involves development of spray after droplet production. Electrical interaction between highly charged droplets with different sizes, and thus different inertia, causes a size segregation effect. Small droplets, also called satellite droplets, are located at the edge of the spray, while the larger droplets, also called main droplets, are located in the spray centre (Gañán-Calvo et al., 1994). The highly charged droplets will become unstable with evaporation past the Rayleigh limit. In such a case, droplet fission can occur which may change the produced size distribution.
The EHDA technique has been widely employed in the encapsulation of therapeutic agents in biodegradable polymeric particles for controlled and sustained drug release applications (Naraharisetti et al., 2007; Xie et al., 2006). It is a powerful and advantageous technique allowing uniform drug distribution within the particles, high loading capacity and minimal drug loss (Bock et al., 2012; Chakraborty et al., 2009) as compared to conventional particulate formation methods (Jain, 2000). Moreover, the technique can be scaled up easily by employing an array of electrospray atomizers to increase the production rate (Bocanegra et al., 2005; Regele et al., 2002; Rulison and Flagan, 1993). Since Loscertales’s pioneering use of coaxial EHDA (CEHDA) (Loscertales et al., 2002), the coating of solid particles, liquid or gas phase with a solid shell in the form of micro- or nano-capsules can be accomplished (Chen et al., 2008; Enayati et al., 2011; Hwang et al., 2008; Lee et al., 2010; Pareta and Edirisinghe, 2006; Wu et al., 2009; Xie et al., 2008; Zhang et al., 2011). This technique of producing core-shell structured particles as drug carriers offer several advantages, including low initial burst release, tunable and near uniform drug release rate, and their suitability to deliver a broad class of biomolecules (Chakraborty et al., 2009). Such composite microspheres can also encapsulate multiple agents, allow their releases in different stages and be useful in tissue engineering (Choi et al., 2010) or cancer therapy (Nie et al., 2010a, 2010b) applications. Recently, the EHDA technique has been extended to a triaxial nozzle system which is capable of producing multilayered polymeric particles (Ahmad et al., 2008; Kim and Kim, 2010, 2011; Lee et al., 2011).
A few studies on the CEHDA process and the scaling law have been reported. However, our knowledge on the stability of coaxial micro-jet in an electric field is still quite limited. López-Herrera et al. (2003) presented the driving liquid concept and showed the current scaling law of compound-jet electrospraying was in good agreement with that of single-jet electrospraying (Gañán-Calvo et al., 1997). Chen et al. (2005) experimentally examined the effect of viscosity and flow rates on various coaxial electrospraying modes. They proposed a simple physical model in which the electrical forces acting on the thin liquid film near the Taylor cone surface drove the inner liquid by viscosity. Mei and Chen (2007) proposed a set of criteria for producing core-shell structured particles based on ratio of charge relaxation lengths of inner and outer jets as well as ratio of inertial breakup lengths of inner and outer jets.
A number of computational fluid dynamics (CFD) based numerical simulations on the formation of Taylor cone-jet from a single nozzle system have been reported. Yan et al. (2003) presented a two-dimensional axi-symmetric model of the electrostatically driven meniscus for ethylene glycol and 1-octanol. The model was able to compute the shape of the liquid cone and the resulting jet, the velocity and electric fields, and the surface charge density at the liquid surface. The simulation results compared well with the experimental observations of the cone shape and jet formation. Similarly, Lastow and Balachandran (2006) proposed a two-dimensional axi-symmetric model for atomization of heptane and ethanol in an electric field. The operating window of heptane was observed to be consistent with published data. Although droplet breakup was not modeled, the droplet size was obtained from the jet diameter. The droplet size of ethanol compared well with the experimental results. By considering an interface tracking method, the CFD model could well be developed for a CEHDA process to simulate cone-jet formation and droplet breakup, and this has not yet been reported in the literature.
The present study aims to bridge the experimental work on the fabrication of core-shell structured microspheres from CEHDA and the simulation work on the generation of compound droplets from the same process. For the experimental work, composite microspheres with a doxorubicin-loaded poly(D,L-lactic-co-glycolic acid) (PLGA) core surrounded by a poly(D,L-lactic acid) (PDLLA) shell layer were fabricated by CEHDA process. Doxorubicin was the hydrophilic fluorescent model drug used for encapsulation. The effect of process conditions (nozzle voltage and polymer solution flow rates) and solution parameters (polymer concentrations) on the production of composite microspheres were investigated, and the microspheres were characterized in terms of their drug distribution, encapsulation efficiency and in vitro release. For the simulation work, the formation of liquid cone-jet and the generation of compound droplets were examined by employing the process conditions and fluid properties in a CFD model in Fluent. The Navier-Stokes equation, including the electrical stresses and the surface tension force, is applied. The volume of fluid (VOF) technique is employed to track the interface of the core and shell fluids as well as the liquid and gas. Finally, the simulation results are compared with the experimental work to illustrate the capability of the CFD model to predict the production of consistent compound droplets and estimate particle size together with its corresponding core diameter and shell thickness of the expected core-shell structured microspheres.
2. Experiments
2.1. Preparation of core-shell structured microspheres
Composite core-shell structured microspheres consisting of a PLGA core (50:50 copolymer; inherent viscosity (i.v.) = 0.61 dl/g in hexafluoroisopropanol; Lactel Absorbable Polymers; Pelham, AL) surrounded by a PDLLA shell (i.v. = 0.37 or 0.70 dl/g in chloroform; Lactel Absorbable Polymers; Pelham, AL) were produced by the CEHDA technique (Fig. 1). PLGA and PDLLA were individually dissolved in dichloromethane (DCM) to prepare polymer concentrations that ranged from 5 to 20% (w/v). The polymer solutions were delivered using syringe pumps (KD Scientific, Inc.; Holliston, MA) into a coaxial nozzle (Popper and Sons, Inc.; Lake Success, NY) to produce a compound jet of core PLGA and annular PDLLA. To create an electric field, the nozzle was connected to a high-voltage generator (Glassman High Voltage, Inc.; High Bridge, NJ). The collector plate (aluminum foil) was grounded and maintained at 15 cm from the nozzle tip. The nozzle voltage was varied in order to achieve a stable Taylor cone-jet mode and produce a cloud of highly charged droplets. The Taylor cone-jet mode was captured using a FASTCAM MC2.1 high-speed video camera (Photron Ltd.; Tokyo, Japan) with a 105 mm F/2.8D AF Micro Nikkor Lens (Nikon Corp.; Tokyo, Japan) at a resolution of 512 × 512 pixels and a frame rate of 2000 fps. During the process, the solvent would evaporate from the droplets, and the microspheres were deposited on the aluminum foil. The samples were then freeze-dried and stored at −20°C under desiccant. To load microspheres with drug, the core phase polymer solution was prepared by emulsifying doxorubicin solution (hydrochloride salt; Boryung, Inc.; Seoul, Korea) in PLGA/DCM solution at 2.5% (w/w) drug to polymer ratio. The amount of water used was maintained at 1:10 (v/v) water to DCM ratio.
Fig. 1.
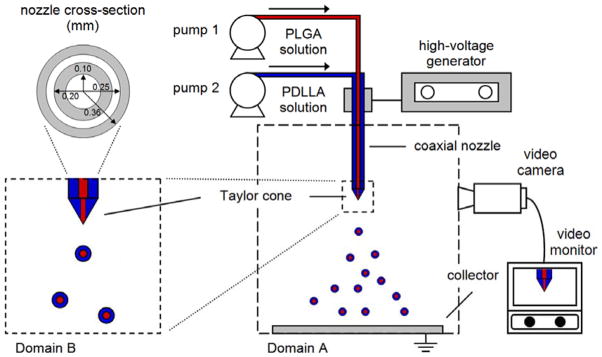
CEHDA process for producing uniform composite core-shell structured microspheres. Domain A consists of the coaxial nozzle and the collector, and is used to calculate the electric field. Domain B consists of the region near the nozzle tip and is used to simulate the CEHDA process. The coaxial nozzle consists of core and shell capillaries with inner and outer diameters as indicated above, and the dimensions are given in millimeters.
2.2. Microscopy
The surface morphology was examined using a Leica DM IL LED inverted microscope (Leica Microsystems GmbH; Wetzlar, Germany) and a JEOL JSM-6060LV scanning electron microscope (SEM) (JEOL Ltd.; Tokyo, Japan). For optical imaging, the particles were collected on a microscope slide, and images were taken using Leica Application Suite software. For SEM imaging, the particles were collected on a SEM sample holder with carbon tape and sputter-coated with platinum. Images were taken, and the mean particle size was determined using ImageJ software. The intraparticle distribution of doxorubicin was examined using a Fluoview FV1000 laser scanning confocal microscope (Olympus Corp.; Tokyo, Japan) equipped with diode laser tuned to 473 nm. Briefly, the drug-loaded microspheres were collected on a glass cover slip and visualized using a 60x water immersion objective lens with 1.00 numerical aperture under the following calibrations: 4.0 μs/pixel sampling speed, line Kalman integration, laser at 720 V and transmissivity of 10%. The fluorescence emission was collected at 490 to 540 nm. The focus was adjusted to observe the drug distribution at the centerline of the microspheres, and images were taken using Olympus Fluoview software.
2.3. Drug loading
The drug loading was evaluated by adding ~50 mg of microspheres in 1 ml of dimethyl sulfoxide (DMSO). After the microspheres were dissolved, the doxorubicin concentration was measured by analyzing its absorbance (λabs = 480 nm) in triplicate in a 96-well plate in an Infinite M200 Pro spectrophotometer (Tecan Group Ltd.; Männedorf, Switzerland).
2.4. In vitro drug release
The drug release was performed by suspending ~150 mg of microspheres in 5 ml of phosphate-buffered saline (PBS, pH 7.4) in centrifuge tubes and incubating them in a water bath (37°C, 120 rpm). At selected time points, the samples were centrifuged at 10,000 rpm for 10 min before 1 ml of supernatant was collected and 1 ml of fresh PBS was replaced. The doxorubicin concentration was measured by analyzing its fluorescence (λex = 480 nm, λem = 590 nm) in the spectrophotometer.
2.5. Viscosity measurement
The flow behavior of polymer solution was measured by using a Haake Rheostress 600 rheometer (Thermo Electron Corp.; Newington, NH) with rotary parallel plates (60 mm diameter and 0.5 mm gap distance) at shear rates ranging from 50 to 100 s−1 at room temperature. The viscosity of each sample was calculated from the average of three repeated measurements.
3. Numerical simulation
3.1. Mathematical formulation
3.1.1. Fluid flow
The mass conservation and Navier-Stokes equations are solved to simulate the fluid flow. Three fluid phases are considered: the liquid core phase, the liquid shell phase and the gas phase (air). Here, the liquid is assumed to be DCM, but is distinguished as core and shell phases. To model the flow dynamics in the presence of the electric field, the multiphase flow is coupled with the applied electric potential field and electrical charging on the liquid-gas interface. Assuming the fluids are incompressible, the mass conservation equation can be simplified as follows.
| (1) |
where u is the velocity of the fluid.
The Navier-Stokes equation includes the electrical stresses from the electric field (FES), the surface tension force on the liquid-gas interface (FST) and the gravitational force, and the resulting equation can be written as follows.
| (2) |
where ρ is the density of the fluid, p is the pressure of the fluid, μ is the viscosity of the fluid, and g is the gravitational acceleration. The subscript g refers to gas phase.
The electrical stresses can be computed from the divergence of the Maxwell stress tensor (σM) as follows.
| (3) |
where qv is the volume charge density at the liquid-gas interface, E is the electric field, and ε is the electrical permittivity of the fluid. The subscript T refers to temperature.
The first term is the coulombic force, which is the result of interaction of electrical charges at the liquid-gas interface with the electric field and is acting in the direction of the electric field. The second and third terms are the dielectric and electrostrictive forces, respectively. The dielectric force acts in the normal direction of the interface due to the ∇ε term. The electrostrictive force is associated with changes in fluid density and is neglected due to incompressibility of the fluid.
The surface tension force acting on the liquid-gas interface is formulated using a continuum surface force model (Brackbill et al., 1992), where the surface curvature is computed from local gradients in the surface normal at the interface. The surface normal (n) is defined as the gradient of αi, the volume fraction of the ith phase.
| (4) |
The surface curvature (κ) is defined in terms of the divergence of the unit surface normal (n̂).
| (5) |
The surface tension can be written in terms of the pressure jump across the surface. By expressing the force at the surface as a volume force using the divergence theorem, the surface tension force has the following form.
| (6) |
where γij is the surface tension coefficient between fluid phases i and j.
The above expression allows for a smooth superposition of forces near cells where more than two phases are present. If only two phases are present in a computational cell, then κi = −κj and ∇αi = −∇αj, and Eq. 6 can be simplified as follows.
| (7) |
where ρ is the volume-averaged density.
3.1.2. Electric field
The governing equation defining electric potential (ϕ) in terms of charge density is Poisson’s equation given as follows.
| (8) |
The electric field is defined as follows.
| (9) |
Here, qv has a finite value due to the localization of the electrical charges at the liquid-gas interface. Moreover, ε varies as it crosses the liquid-gas interface. Thus, the electric field will vary both in strength and magnitude as it crosses the interface.
3.1.3. Volume charge density
It is a challenging task to estimate the volume charge density at the liquid-gas interface. For the initial calculation of the electric field, no liquid phase is considered, and charge density is set to zero. After the electric field is computed, the volume charge density at the liquid-gas interface can be estimated using a leaky dielectric model based on Gauss’s Law as follows.
| (10) |
The interfacial volume charge density and its distribution are influenced by the charge relaxation time (τE) which is defined as the ratio of the electrical permittivity over the electrical conductivity (K).
| (11) |
The flow physics of EHDA is dominated by viscous flow and surface tension time scales. At the nozzle tip, the viscous force dominates Taylor cone formation, while the surface tension force governs jet formation and droplet breakup. By considering L to be the length scale for liquid flow, then the viscous flow and surface tension time scales can be approximated by the following two equations.
| (12) |
| (13) |
Typically, the leaky dielectric model (Melcher and Taylor, 1969; Saville, 1997) applies when the charge relaxation time is small as compared to the viscous flow and surface tension time scales described in this problem (Hua et al., 2008; Lim et al., 2011). For a highly conducting fluid, the electric charges may localize at the liquid-gas interface instantly as compared to the time scales of fluid motion or droplet breakup. However, for a weakly conducting fluid, it may act like a perfect insulator, and there is no available electric charge flowing through the material.
The relevant physical properties of DCM are given by ε = 8.73, K = 2.75 × 10⁻⁸ S/m, ρ = 1360 kg/m3, μ = 4.3 × 10⁻⁴ Pa s, and γ = 0.0254 N/m. By approximating L to be the nozzle or droplet diameter (~100 μm), the time scales are given by τE ~ 0.00281 s, τV ~ 0.0316 s, and τγ ~ 0.000231 s. In this case, the charge relaxation time scale is smaller than the viscous flow time scale, but larger than the surface tension time scale. This implies that the induced charges cannot be distributed at the liquid-gas interface instantaneously, particularly when the effect of surface tension force is taking place. Moreover, in our previous work (Lim et al., 2011), we reported that dichloromethane has a relatively low electrical conductivity, and the charge relaxation time scale associated with this fluid has been shown to be much larger than the past work (Gañán-Calvo et al., 1997; Lastow and Balachandran, 2006) where leaky dielectric model is used. Therefore, the traditional leaky dielectric model may not be entirely appropriate in this problem. The actual volume charge density should be a value less than the one predicted by Gauss’s Law. Here, a modified leaky dielectric model is proposed in this study.
| (14) |
where λ is a value ranges from 0 to 1. The value of λ that gives the best fit of the Taylor cone-jet profile observed experimentally is selected to compute the volume charge density via a trial-and-error method. The value of λ used in this simulation work is 1/7.
3.1.4. Tracking evolution of interface
The VOF model is employed for tracking the evolution of the liquid-liquid and liquid-gas interfaces due to its capabilities of dealing with free surfaces interactions. The interface is tracked by the solution of a continuity equation for the volume fraction of one (or more) of the phases (ith phase) as shown below.
| (15) |
The volume fraction equation will not be solved for the primary phase. Instead, the primary phase volume fraction will be computed based on the following constraint.
| (16) |
In each computational cell, all of the volume fractions add up to one. All variables and properties are shared by the phases and represent volume-averaged values, as long as the volume fractions at each position have been calculated. Therefore, the variables and properties in any given cell are representative of either of the phases, or a mixture of them, depending upon the volume fraction values. Here, the gas phase (air) is represented by the primary phase whereas the liquid core and shell phases (DCM) are represented by two secondary phases.
3.2. Geometry and boundary conditions
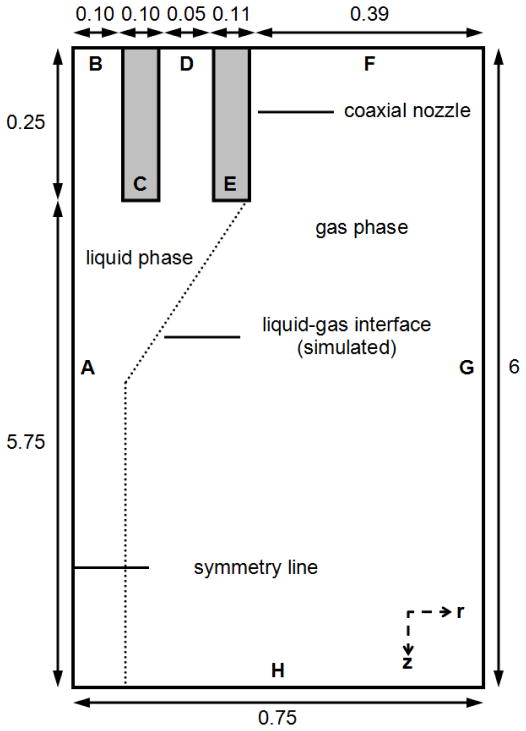
A large domain comprising a coaxial nozzle and collector in the actual experimental setup is used to calculate the electric field (Fig. 1, Domain A). The two-dimensional axi-symmetric electric field can be solved without considering the presence of liquid flow at the nozzle tip. After determining the electric potential distribution, the electric potential values are extracted and imposed as the boundary conditions of the smaller domain that is confined to the region near the nozzle tip, and the CFD calculations are performed based on a two-dimensional axi-symmetric model (Fig. 2). This procedure is done since it is computationally expensive to simulate flow dynamics on the large domain, and the domain of interest for the flow dynamics is much smaller as compared to that for the electric field calculation. Moreover, the electric field is only influenced by the liquid flow locally and is almost unaffected by the presence of the liquid far away from the nozzle. The electrostatic and hydrodynamic boundary conditions of the CFD domain in Fig. 2 are listed in Table 1. The initial liquid geometry consists of a coaxial hemispherical core-shell droplet at the nozzle tip.
Fig. 2.
Size of Domain B used to simulate the CEHDA process. A: symmetry line; B: core inlet; C: wall of core channel; D: shell inlet; E: wall of shell channel; F: top; G: right; H: bottom; r: r-axis; z: z-axis. The dimensions are given in millimeters.
Table 1.
The electrostatic and hydrodynamic boundary conditions of Domain B.
| Boundary | Electrostatic | Hydrodynamic |
|---|---|---|
| A | ϕr = 0 | ur = 0 |
| B | ϕ = Vnozzle | uz = Qcore/Acore |
| C | ϕ = Vnozzle | u = 0 |
| D | ϕ = Vnozzle | uz = Qshell/Ashell |
| E | ϕ = Vnozzle | u = 0 |
| F | ϕz = 0 | P = 0 |
| G | ϕ = Vright | P = 0 |
| H | ϕ = Vbottom | P = 0 |
The boundaries are labeled in Fig. 2. ϕ: voltage; u: velocity of fluid; p: pressure of fluid; Vnozzle: nozzle voltage; Vright: voltage profile determined from Domain A; Vbottom: bottom voltage determined from Domain A; Qcore: volumetric flow rate of core phase; Qshell: volumetric flow rate of shell phase; Acore: cross-sectional area of core channel; Ashell: cross-sectional area of shell channel. The subscripts r and z represent the r- and z-components, respectively.
3.3. Numerical procedure
Transient simulation of the CEHDA process was performed using Fluent 14.0 software (ANSYS, Inc.; Canonsburg, PA) via High Performance Computing, National University of Singapore. The liquid phase is assumed to be DCM. For comparison with the experimental results, the polymer solutions are assumed to have similar physical properties of the pure solvent. This assumption may be valid if the polymer solutions considered are dilute. The liquid phase follows the physical properties of DCM: density ρ = 1360 kg/m3, viscosity μ = 4.3 × 10⁻⁴ Pa s, relative electrical permittivity ε = 8.73, and surface tension γ = 0.0254 N/m. The gas phase follows the physical properties of air: density ρg = 1.25 kg/m3, viscosity μg = 1.8 × 10⁻⁵ Pa s, and relative electrical permittivity εg = 1. The gravitational acceleration is 9.81 m/s2, while the electrical permittivity of vacuum is 8.85 × 10⁻¹² F/m. The CFD domain (Domain B) is discretized into 10 μm square elements, and the time step used is 2 × 10⁻⁷ s. The fluid pressure and velocity are updated by solving the continuity and momentum equations using the Coupled scheme. The QUICK differencing scheme is used for solving the momentum equations, whereas the PRESTO scheme is adopted for the pressure correction equation. The QUICK scheme computes a higher-order value of the convected variable and is based on a weighted average of second-order upwind and central interpolations of the variable (Leonard and Mokhtari, 1990). The PRESTO uses the discrete continuity balance for a “staggered” control volume about the face to compute the “staggered” (i.e., face) pressure. This procedure is similar in spirit to the staggered-grid schemes used with structured meshes (Patankar, 1980). The Geometric Reconstruction scheme is used to represent the interface between fluids using a piecewise-linear approach. It assumes that the interface between two fluids has a linear slope within each cell and uses this linear shape for calculation of the advection of fluid through the cell faces.
The simulation procedure is described as follows.
The electric field for Domain A is determined by solving the Poisson’s equation based on a two-dimensional axi-symmetric model. No liquid is present at the nozzle outlet.
The electric potential values from Domain A are extracted and imposed as the boundary conditions of Domain B. The Poisson’s equation is solved for Domain B based on a two-dimensional axi-symmetric model with the boundary electric potential values, and the presence of liquid at the nozzle outlet and interfacial volume charge density.
The electrical stresses and surface tension force are calculated, and the continuity and momentum equations are solved to obtain the new pressure and velocity fields.
The liquid-liquid and liquid-gas interfaces are advected to a new location. Based on the new interface location, the fluid physical properties such as density, viscosity and electrical permittivity are redistributed throughout Domain B. At this point, the interfacial volume charge density is also imposed at the liquid-gas interface.
The stability of the Taylor cone-jet is verified by determining whether the cone angle and the jet diameter reach their steady values with increasing simulation times. If it is unstable, steps b to d are repeated based on a new value of interfacial volume charge density.
3.4. Droplet size
From the simulation results, the droplet size is estimated by determining the equivalent spherical diameter. At various simulation times, the flights of various droplets produced from the CEHDA process are monitored. The images of several droplets and their corresponding core phases are captured and analyzed using the image processing commands in Matlab software, and their volumes are calculated through numerical integration by revolving the half-area about the symmetric axis. The size of the droplet and its corresponding core phase may be determined through the volume of a sphere formula.
4. Results and discussion
4.1. Experimental study of CEHDA process
4.1.1. Core-shell structured microspheres
Fig. 1 shows the CEHDA process for producing uniform composite core-shell structured microspheres. The nozzle consists of two coaxially aligned capillaries in which PLGA core and PDLLA shell solutions were pumped. A polymer jet, consisting of core PLGA and annular PDLLA, was produced. Upon jet breakup by the electric field into droplets, the solvent evaporated rapidly to form core-shell structured microspheres. Here, we first examine the formation of composite microspheres based on varying core and shell polymer concentrations, shell flow rates, and nozzle voltages. Here, the inherent viscosities of PLGA and PDLLA used were 0.61 and 0.37 dl/g, respectively.
4.1.1.1. Effect of core and shell polymer concentrations
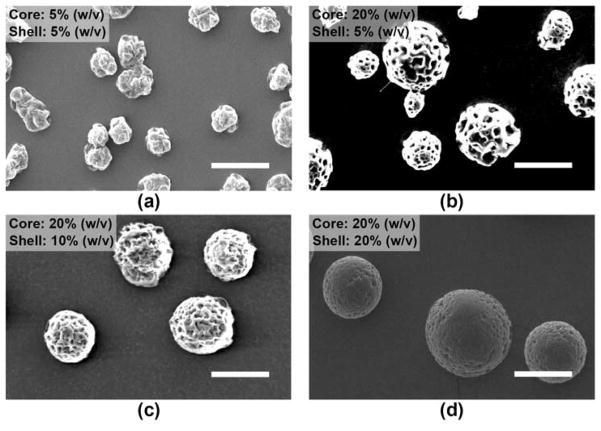
In the first series of experiments, the core polymer concentration was varied from 5 to 20% (w/v) (Fig. 3a and 3b). Here, the nozzle voltage (4.5 kV), the shell polymer concentration (5% (w/v)), and the core and shell flow rates (0.5 and 2.5 ml/h) were maintained. By increasing the PLGA core phase concentration from 5 to 20% (w/v), microspheres were more spherical with rough and porous surfaces. Next, the shell polymer concentration was varied from 10 to 20% (w/v) (Fig. 3c and 3d). Here, the nozzle voltage (4.5 kV), the core polymer concentration (20% (w/v)), and the core and shell flow rates (1.0 and 5.0 ml/h) were maintained. By increasing the PDLLA shell phase concentration from 10 to 20% (w/v), microspheres had smoother surfaces with lesser and smaller pores.
Fig. 3.
SEM of electrosprayed composite microspheres prepared using different core and shell polymer concentrations. The nozzle voltage (4.5 kV), the core/shell flow rates ((a) to (b): 0.5/2.5 ml/h; (c) to (d): 1.0/5.0 ml/h) and the nozzle-to-collector distance (15 cm) were maintained. Scale bar = 25 μm.
Polymer concentration is a key factor in influencing the structure and morphology of the microspheres. Spherical and smooth microspheres could not be achieved when the polymer solution is below a critical concentration. A high polymer concentration provides rapid phase inversion and yields a tight structure due to chain entanglement. Overall, the structure and morphology of the composite microspheres are mainly controlled by the core and shell polymer concentrations, respectively.
4.1.1.2. Effect of shell flow rate
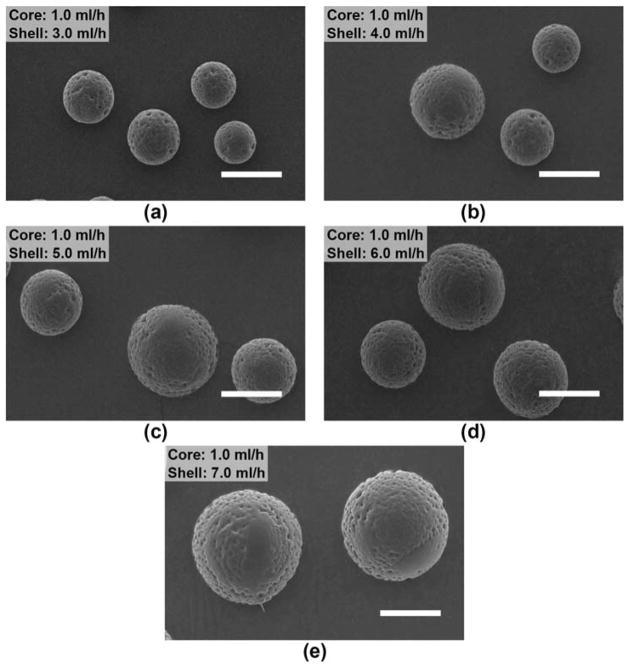
Fig. 4 shows the electrosprayed microspheres when the shell flow rate was varied from 3.0 to 7.0 ml/h. Here, the nozzle voltage (4.5 kV), the core and shell polymer concentrations (20% (w/v)), and the core flow rate (1.0 ml/h) were maintained. The shell flow rate is selected to be higher than the core flow rate in order to ensure that there is sufficient PDLLA shell phase solution to encapsulate the PLGA core phase solution. For various flow rates, there was a stable formation of the Taylor cone, and uniform microspheres were obtained. Besides, the particle size increased almost linearly from ~20 to 40 μm with increasing shell flow rate (Fig. 5a). Since the core flow rate was kept constant, the core diameter of the composite microspheres should remain the same, while the shell thickness presumably increased with increasing shell flow rate.
Fig. 4.
SEM of electrosprayed composite microspheres prepared based on a constant core flow rate (1.0 ml/h), but different shell flow rates. The nozzle voltage (4.5 kV), the core and shell polymer concentrations (20% (w/v)), and the nozzle-to-collector distance (15 cm) were maintained. Scale bar = 25 μm.
Fig. 5.
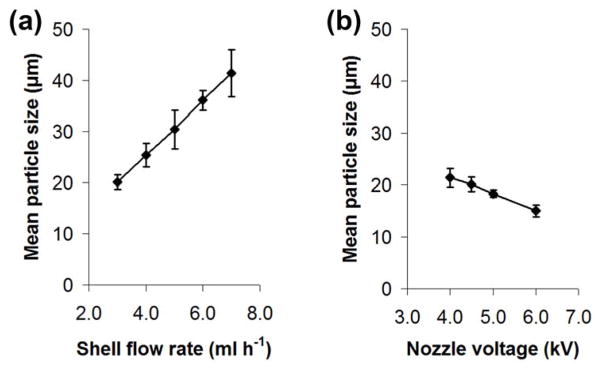
The effect of (a) shell flow rate and (b) nozzle voltage on the mean particle size. For (a), the nozzle voltage (4.5 kV), the core polymer solution (20% (w/v) at 1.0 ml/h), the shell polymer solution (20% (w/v)) and the nozzle-to-collector distance (15 cm) were maintained. For (b), the core polymer solution (20% (w/v) at 1.0 ml/h), the shell polymer solution (20% (w/v) at 3.0 ml/h) and the nozzle-to-collector distance (15 cm) were maintained. Data represent mean ± standard deviation, n = 10.
4.1.1.3. Effect of nozzle voltage
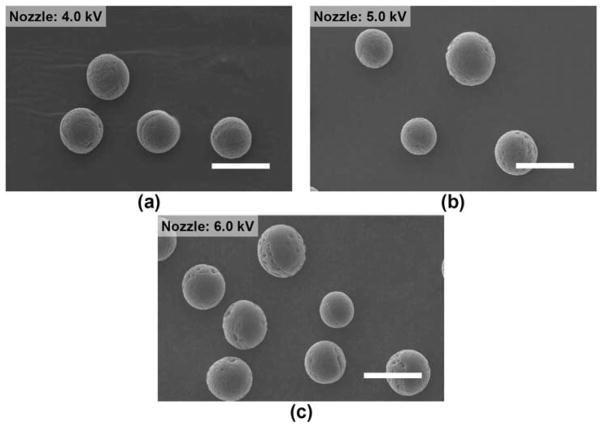
Fig. 6 shows the electrosprayed microspheres when the nozzle voltage was varied from 4.0 to 6.0 kV. Here, the core and shell polymer concentrations (20% (w/v)), and the core and shell flow rates (1.0 and 3.0 ml/h) were maintained. For various nozzle voltages, the polymer jet was stable, and the monodispersity of the microspheres was maintained. The particle size decreased slightly with increasing nozzle voltage, although it was not significantly different (Fig. 5b). Above 6.0 kV, the polymer jet became unstable.
Fig. 6.
SEM of electrosprayed composite microspheres prepared using different nozzle voltages. The core and shell polymer concentrations (20% (w/v)), the core/shell flow rates (1.0/3.0 ml/h), and the nozzle-to-collector distance (15 cm) were maintained. Scale bar = 25 μm.
4.1.2. Fabrication of drug-loaded core-shell structured microspheres
Based on the optimized solution parameters and process conditions, three formulations of doxorubicin-loaded core-shell structured microspheres were fabricated (Table 2). Formulations A and B differ in the molecular weight of the PDLLA shell layer. In particular, formulation B had a higher shell molecular weight (0.70 dl/g) than formulation A (0.37 dl/g). Formulations A and C differ in the concentration of the PDLLA shell phase solution used. In particular, a higher shell polymer concentration was used to produce formulation C (20% (w/v)) than formulation A (10% (w/v)). For all the three formulations, the nozzle voltage varied between 5.0 and 5.6 kV, while the core and shell flow rates were maintained at 1.0 and 3.5 ml/h, respectively.
Table 2.
Mean particle size and encapsulation efficiency of doxorubicin-loaded core-shell structured microspheres. The nozzle voltage ranged from 5.0 to 5.6 kV, the core and shell flow rates were 1.0 and 3.5 ml/h, respectively, and the nozzle-to-collector distance was 15 cm. Data represent mean ± standard deviation.
| Formulation | PLGA core phase | PDLLA shell phase | Nozzle voltage (kV) | Core flow rate (ml/h) | Shell flow rate (ml/h) | Particle sizea (μm) | E.E.b (%) | ||
|---|---|---|---|---|---|---|---|---|---|
| Con. (% (w/v)) | I.V. (dl/g) | Con. (% (w/v)) | I.V. (dl/g) | ||||||
| A | 20 | 0.61 | 10 | 0.37 | 5.5 | 1.0 | 3.5 | 28.1 ± 5.2 | 71.1 ± 1.9 |
| B | 20 | 0.61 | 10 | 0.70 | 5.6 | 1.0 | 3.5 | 31.5 ± 5.4 | 91.4 ± 1.5 |
| C | 20 | 0.61 | 20 | 0.37 | 5.0 | 1.0 | 3.5 | 31.3 ± 4.5 | 87.1 ± 0.9 |
Average particle size was based on at least 20 microspheres.
Average E.E. was based on three samples of microspheres.
4.1.2.1. Surface morphology and drug distribution
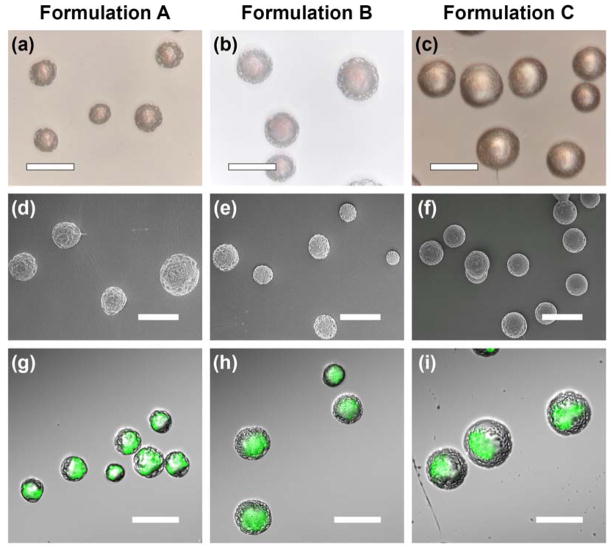
Fig. 7a to 7c and 7d to 7f show the optical and scanning electron micrographs of various formulations of doxorubicin-loaded core-shell structured microspheres, respectively. The microspheres had a particle size of ~30 μm (Table 2). Formulation C showed a smooth surface morphology, while formulations A and B showed a slightly porous outer layer. The variation in the surface morphology among the microspheres may be attributed to the different PDLLA concentrations used to form the shell layer. From the confocal micrographs in Fig. 7g to 7i, doxorubicin was encapsulated in the PLGA core region surrounded by a relatively drug-free PDLLA shell layer, thus indicating the formation of core-shell structured microspheres.
Fig. 7.
Transmitted light, scanning electron and confocal micrographs depicting doxorubicin-loaded core-shell structured microspheres. The green color shows the distribution of doxorubicin. Scale bar = 50 μm.
4.1.2.2. Encapsulation efficiency
An encapsulation efficiency as high as 90% could be obtained from core-shell structured microspheres (Table 2). The encapsulation efficiency increased with increasing molecular weight and polymer concentration of the PDLLA shell phase. By using a higher shell molecular weight, the encapsulation efficiency improved from ~71% (formulation A) to ~91% (formulation B). Moreover, by using a higher shell polymer concentration, the encapsulation efficiency improved from ~71% (formulation A) to ~87% (formulation C).
4.1.2.3. Release of doxorubicin
The drug release profiles for all the three formulations were found to be similar (Fig. 8). In particular, they exhibited small initial burst release of drug (~2 to 6%), followed by a period of minimal drug release for ~19 days. After the lag phase, the drug continued to release at a zero-order rate (~41 to 51%) from day 19 to 43. From day 43 onwards, the drug was released at a slower but zero-order rate (~36 to 42%) until near complete release at day 152. Formulation C exhibited the smallest initial burst (~2%) as compared to formulations A or B (~6%). Interestingly, the lag phase period and the subsequent drug release rate were independent of the molecular weight of the shell layer.
Fig. 8.
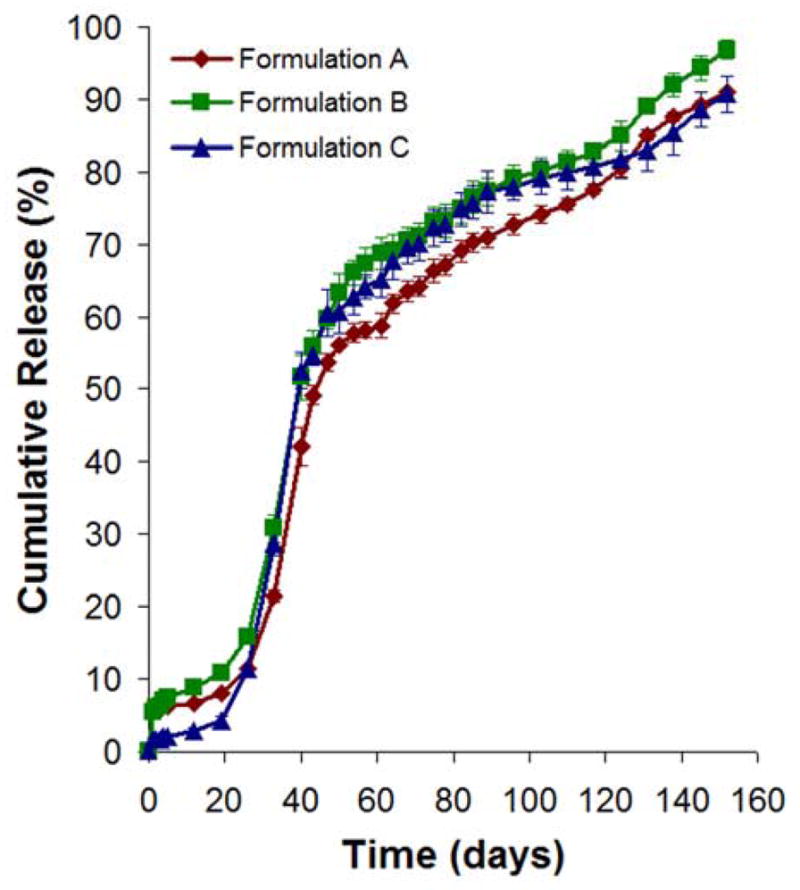
In vitro release of doxorubicin from core-shell structured microspheres. Data represent mean ± standard deviation, n = 3.
The outer layer morphology of the microspheres could contribute to slightly different degrees of initial burst release of drug. Since both formulations A and B had a porous outer layer as compared to formulation C (Fig. 7), the solid drug may either be loosely associated on the external surface or embedded in the porous shell layer. Thus, the drug could potentially escape from the porous surface layer, resulting in a higher burst release of drug.
During the lag phase from day 0 to 19, the PDLLA shell layer could serve as an effective barrier preventing the premature release of doxorubicin into the aqueous medium. At this point, water penetration and degradation of the shell layer would occur, facilitating the creation of water-filled pores though the layer. After the lag phase from day 19 to 43, the drug-loaded PLGA core would be exposed to water dissolution, and the degradation of the PLGA core could account for the drug release after the lag phase period. Here, the drug was released at a zero-order rate. From day 43 onwards, significant agglomeration of microspheres was observed, and this could lead to the release of the drug at a slower but zero-order rate.
Despite having the shell layer with different molecular weights, the lag phase period and the subsequent drug release rate were not significantly affected. It is postulated that the water penetration through the PDLLA shell layer of different molecular weights could be occurring at the same rate, resulting in the exposure of the drug-loaded PLGA core to water dissolution. Moreover, the degradation rate of PLGA core could dominate the subsequent drug release rate after the lag phase. Thus, these factors could explain the similar lag phase period and the subsequent drug release rate for various microsphere formulations.
4.2. Computation study of CEHDA process
4.2.1. Electrical field
Based on the experimental work described in the previous section, composite core-shell structured microspheres with a drug-loaded PLGA core surrounded by a drug-free PDLLA shell layer were produced successfully from the CEHDA process. Here, the experimental parameters of the CEHDA process, including the nozzle voltage (5.0, 5.5 and 5.6 kV), the core and shell flow rates (1.0 and 3.5 ml/h), and the nozzle-to-collector distance (15 cm), and the fluid properties of DCM and air, such as density, viscosity, electrical permittivity and surface tension, are employed in the CFD model. The core and shell fluids considered here are DCM. The cone-jet formation and droplet breakup process are simulated. Before validating the model with the experimental findings, the electric field near the nozzle tip is investigated since the electric field strength and charge density play critical roles in the CEHDA process.
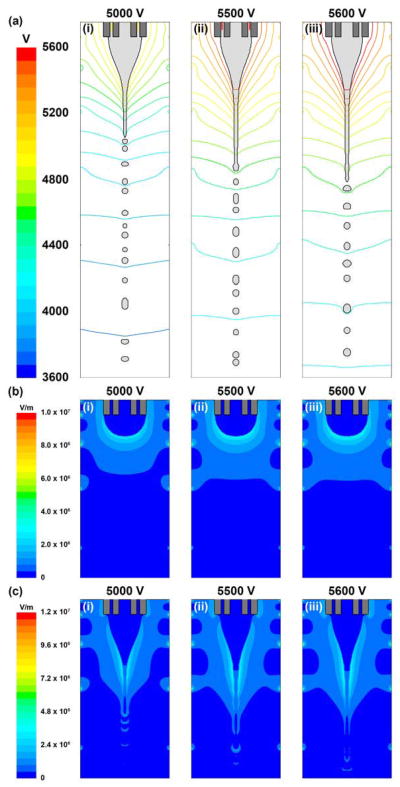
The electric field is first computed by solving the Poisson’s equation for the entire domain, which consists of the nozzle and collector (Fig. 1, Domain A). From the developed field, the electric potential values are imposed on the right and bottom boundaries of the CFD domain (Fig. 2), and the Poisson’s equation is solved again. The electric potential and electric field strength profiles based on nozzle voltages of 5.0, 5.5 and 5.6 kV are shown in Fig. 9. From the contour lines, the electric field is observed to be non-uniform with the equipotential lines packing densely near the nozzle tip but spacing sparsely far away from the nozzle (Fig. 9a). During the cone-jet formation and droplet breakup process, the equipotential lines are distorted by the low conductivity fluid due to the electrical permittivity difference between DCM and air, and the localization of electric charges at the liquid-gas interface. When the nozzle voltage increases from 5.0 to 5.6 kV, the potential difference over the domain is higher, thus experiencing a slight increase in electric field strength (Fig. 9b and 9c). The distributions of electric charges at the liquid-gas interface under various nozzle voltages are shown in Fig. 10. The volume charge density ranges from 2.68 to 2.72 C/m3, and most of the charges are accumulated at the cone apex, which are consistent with literature results (Lastow and Balachandran, 2006). By substituting the calculated electric field strength and estimated volume charge density values into the Maxwell stresses, the electrical forces acting on the liquid surface could be obtained, and the droplet breakup process could be monitored.
Fig. 9.
(a(i)), (a(ii)) and (a(iii)) are the electric potential profiles represented by equipotential lines in the CFD domain containing the cone-jet and droplet breakup based on nozzle voltages of 5.0, 5.5 and 5.6 kV, respectively. (b(i)) to (b(iii)) and (c(i)) to (c(iii)) are the electric field strength profiles before and after cone-jet formation based on nozzle voltages of 5.0 to 5.6 kV, respectively. In all cases, the core/shell flow rates (1.0/3.5 ml/h) and the nozzle-to-collector distance (15 cm) are maintained.
Fig. 10.
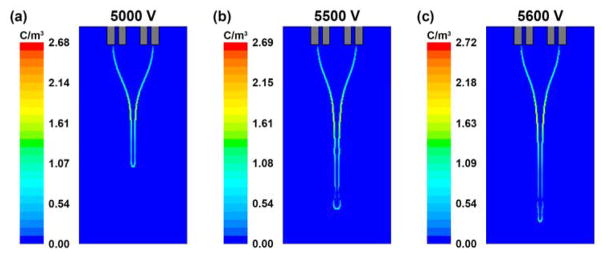
(a), (b) and (c) are the volume charge density profiles at the liquid-gas interface during cone-jet formation based on nozzle voltages of 5.0, 5.5 and 5.6 kV, respectively. In all cases, the core/shell flow rates (1.0/3.5 ml/h) and the nozzle-to-collector distance (15 cm) are maintained.
4.2.2. Taylor cone-jet formation and droplet breakup process
Similar to a single nozzle system (Lim et al., 2011), the simulation for a coaxial nozzle system could portray the features of cone-jet formation and droplet breakup process reasonably well (Fig. 11aii and 11bii). The initial liquid geometry is a hemispherical droplet comprising of core and shell fluids at the nozzle tip. When there is an electric field, the liquid is accelerated towards the collector while a cone shape is developed. A jet is gradually formed at the cone apex before it breaks up into relatively monodisperse micron-sized droplets as a result of interfacial instability.
Fig. 11.
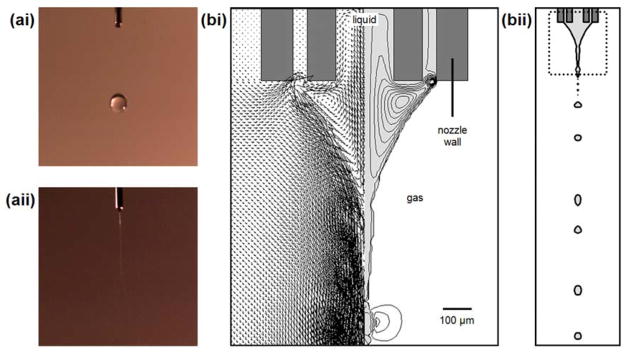
(ai) and (aii) are the droplet formation and the stable cone-jet mode observed experimentally when the nozzle voltages were fixed at 0 and 4.5 kV, respectively. For the experiments, the core/shell flow rates (1.0/3.5 ml/h) and the nozzle-to-collector distance (15 cm) were maintained. (bi) Velocity field is plotted on the left of the liquid cone. Streamline is plotted on the right of the liquid cone. Scale bar = 100 μm. (bii) The location of the plotted region in the CFD domain. For the simulation, the nozzle voltage (5.6 kV), the core/shell flow rates (1.0/3.5 ml/h) and the nozzle-to-collector distance (15 cm) are maintained.
Fig. 11bi demonstrates the development of the velocity field within the liquid cone. As compared to the single nozzle system (Lim et al., 2011), the velocity field for a coaxial nozzle system shows the presence of two toroid-shaped vortexes due to fluids flowing out from core and shell channels of the nozzle. The smaller vortex is located near the outlet of the shell channel whereas the larger vortex is located below the cone surface. It is observed that there is significant liquid circulation, but only the liquid located very near to the liquid surface is pulled towards jet formation. Since the electric charges are localized at the liquid surface, their interaction with the electric field causes liquid to flow parallel along the interface. At the center of the jet, there is no liquid circulation, and the velocity vector is unidirectional.
If the core and shell fluids are marked as different phases, then the effect of velocity field on the distributions of core and shell fluids could be tracked. The distributions of core and shell fluids inside the Taylor cone, and the subsequent formation of compound droplets during stable cone-jet mode at different time points under various nozzle voltages are presented in Fig. 12. At the center of the liquid jet, reverse flow of the shell fluid into the core channel is observed. The core fluid is scattered to flow along the inner wall of the core channel before dispersing into the Taylor cone as a result of liquid circulation. If the core fluid is found near the cone surface, the core fluid would be accelerated towards the cone apex and combined with the shell fluid to form compound droplets. For a nozzle voltage of 5.0 kV, a small amount of core fluid is found circulating within the vortex (Fig. 12a). In contrast, for nozzle voltages of 5.5 and 5.6 kV, the core fluid no longer stays within the vortex (Fig. 12b and 12c). For all the three cases, the core fluid is pulled towards jet formation, and there is consistent formation of compound droplets.
Fig. 12.
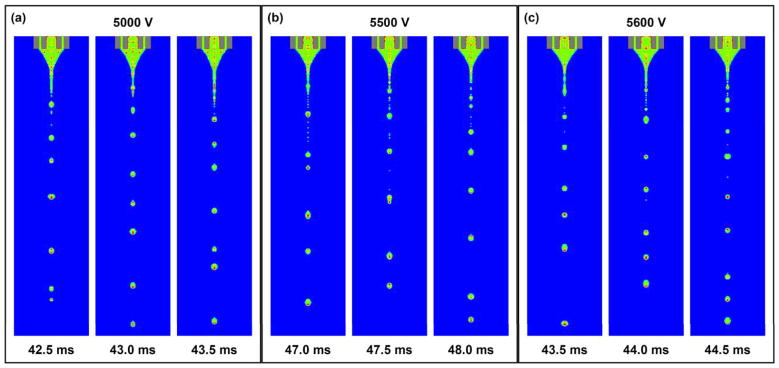
Distributions of core and shell fluids inside the Taylor cone and subsequent formation of compound droplets during stable cone-jet mode at different time points under various nozzle voltages. The time interval is 0.5 ms. The red, green and blue colors represent the core, shell and air phases, respectively. In all cases, the core/shell flow rates (1.0/3.5 ml/h) and the nozzle-to-collector distance (15 cm) are maintained.
Fig. 13 shows the representative compound droplets that are produced during stable cone-jet mode at different time points under various nozzle voltages. For all the three cases, consistent compound droplets are produced, with each droplet showing the distributions of the core and shell fluids. Since electric field plays a dominant role in driving the core fluid towards jet formation, we expect that a nozzle voltage above a critical value may be necessary in producing the desired compound droplets.
Fig. 13.
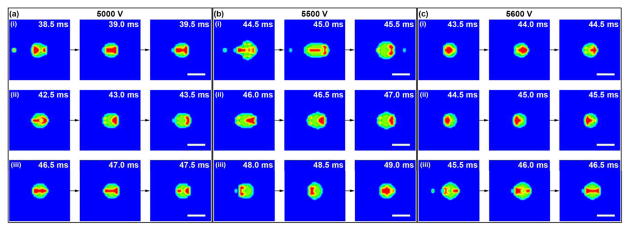
Representative compound droplets that are produced during stable cone-jet mode at different time points under various nozzle voltages. The time interval is 0.5 ms. The red, green and blue colors represent the core, shell and air phases, respectively. In all cases, the core/shell flow rates (1.0/3.5 ml/h) and the nozzle-to-collector distance (15 cm) are maintained. Scale bar = 100 μm.
4.2.3. Prediction of particle size, core diameter and shell thickness
Suppose the core fluid of the compound droplet will form the core phase of the final particle, the droplet size (equivalent spherical diameter, ddroplet) and its corresponding core fluid diameter (dcore,droplet) and shell fluid thickness (τshell,droplet) can be measured directly from the compound droplets simulated. If the core and shell fluids are the respective PLGA and PDLLA solutions instead of DCM, and assuming complete solvent evaporation has taken place, the particle size is closely related to the concentration of polymer solution used in each phase and is proportional to the size of droplet obtained from jet breakup. Thus, from the measurements of the compound droplets, we could predict the particle size (dparticle), PLGA core diameter (dcore,particle) and PDLLA shell thickness (τshell,particle) of the composite microspheres.
For the composite microspheres obtained experimentally, the shell thickness (tshell) can be calculated from the measured overall particle diameter and known flow rates of the polymer solutions. For the case of blank core-shell structured microspheres, the ratio of core diameter (Dcore) to overall particle diameter (Dparticle) is related to the volume fraction of PLGA in the microsphere as follows.
| (17) |
where νPLGA and νPDLLA are the flow rates of PLGA and PDLLA respectively (cm3 of polymer/h), xPLGA and xPDLLA are the volume fractions of PLGA and PDLLA in the core and shell solutions respectively, Fcore and Fshell are the flow rates of core and shell solutions respectively (cm3 of polymer solution/h), CPLGA and CPDLLA are the concentrations of PLGA and PDLLA in DCM respectively (g of polymer/cm3 of DCM), and ρPLGA and ρPDLLA are the densities of PLGA and PDLLA respectively (g/cm3).
For the case of drug-loaded core-shell structured microspheres with the creation of water-in-oil emulsion in the core phase, Eq. 17 is modified to include the pore volume originally occupied by the water phase that contributed to the total volume of the microsphere as follows.
| (18) |
where νwater,core is the flow rate of water in the core phase (cm3 of water/h), xwater,core is the volume fraction of water in the core solution, and Vwater,core is the volume ratio of water to DCM used to create the emulsion in the core solution.
Then, the shell thickness (tshell) can be calculated as follows.
| (19) |
For the compound droplets obtained from the simulation results, the particle size (dparticle) can be predicted from the droplet size (ddroplet) by considering the volume fraction of polymers in the droplet. In addition, by taking into account the water phase from the emulsion that could contribute to the pore volume in the core phase, the total volume fraction of PLGA, PDLLA and water (xPLGA+PDLLA+water) is calculated as follows.
| (20) |
where νPLGA, νPDLLA and νwater,core are the flow rates of PLGA, PDLLA and water respectively (cm3/h), xPLGA, xPDLLA and xwater,core are the volume fractions of PLGA, PDLLA and water in the respective solutions respectively, Fcore and Fshell are the flow rates of core and shell solutions respectively (cm3 of polymer solution/h), CPLGA and CPDLLA are the concentrations of PLGA and PDLLA in DCM respectively (g of polymer/cm3 of DCM), ρPLGA and ρPDLLA are the densities of PLGA and PDLLA respectively (g/cm3), and Vwater,core is the volume ratio of water to DCM used to create the emulsion in the core solution.
Then, the particle size is related to the droplet size as follows.
| (21) |
Since the total volume fraction of PLGA and water (xPLGA+water) in the core solution is
| (22) |
Then, the PLGA core diameter (dcore,particle) is related to the core fluid diameter (dcore,droplet) as follows.
| (23) |
Finally, the shell fluid thickness (τshell,droplet) and the PDLLA shell thickness (τshell,particle) can be calculated as follows.
| (24) |
| (25) |
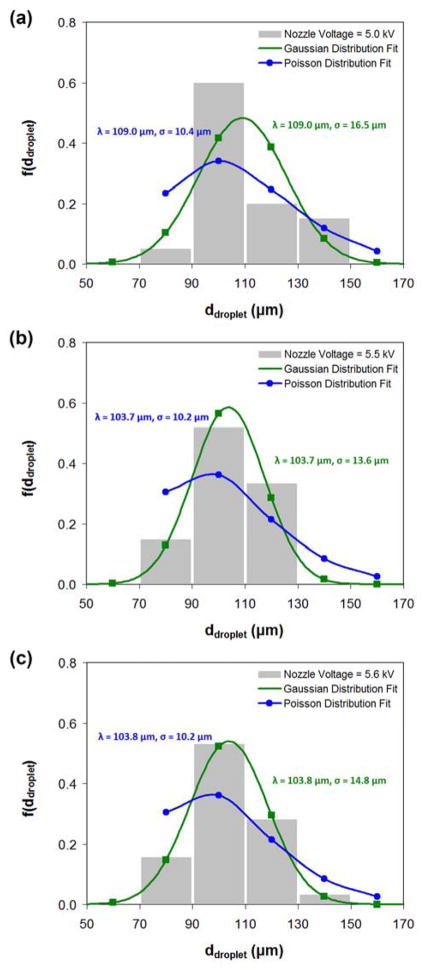
Fig. 14 shows the size distributions of the simulated droplets that are produced under various nozzle voltages. The size distribution is plotted in the form of a probability density function. The droplet sizes are fitted with Gaussian and Poisson distributions, and the goodness of fit is evaluated using the chi-squared statistic test at a 5% significance level. Overall, the droplet sizes produced from nozzle voltages of 5.0, 5.5 and 5.6 kV seem to follow a Gaussian distribution fairly well (p = 0.154 at nozzle voltage of 5.0 kV; p = 0.628 at nozzle voltage of 5.5 kV; p = 0.962 at nozzle voltage of 5.6 kV).
Fig. 14.
(a), (b) and (c) are the droplet size distributions produced from stable cone-jet mode under nozzle voltages of 5.0, 5.5 and 5.6 kV, respectively. The droplet sizes are fitted with Gaussian and Poisson distributions, and the goodness of fit is evaluated using the chi-squared statistic test at a 5% significance level. The mean and standard deviation for the fitted distribution is indicated above. For (a), the p values for the Gaussian and Poisson distribution fits are 0.154 and 0.027, respectively. For (b), the p values for the Gaussian and Poisson distribution fits are 0.628 and 0.016, respectively. For (c), the p values for the Gaussian and Poisson distribution fits are 0.962 and 0.037, respectively. In all cases, the core/shell flow rates (1.0/3.5 ml/h) and the nozzle-to-collector distance (15 cm) are maintained.
Table 3 shows the comparison of experimental and simulation results on the particle size together with its PLGA core diameter and PDLLA shell thickness of the core-shell structured microspheres. The experimental results show that formulations A to C were ~30 μm, core diameter was ~22 μm and shell thickness was ~4 μm. The simulation results show that the droplet size is ~105 μm for formulations A and B, and ~111 μm for formulation C. By considering the core and shell polymer concentrations used to produce these microspheres, the particle size, core diameter and shell thickness can be estimated. The predicted particle size is ~49 μm for formulations A and B, and ~59 μm for formulation C. The core diameter is ~32 μm for all the three formulations. As such, the shell thickness for formulation C (~13 μm) is larger than that for formulation A or B (~8 μm). Based on the process conditions considered, the particle size, core diameter and shell thickness predicted from the simulated compound droplets compare well with those obtained experimentally, although the predicted sizes overestimate the sizes of the microspheres that were obtained experimentally.
Table 3.
Comparison of experimental and simulation results on the particle size, PLGA core diameter and PDLLA shell thickness of the composite microspheres. Data represent mean ± standard deviation.
| Formulation | Nozzle voltage (kV) | Experimental results | Simulation results | |||||||
|---|---|---|---|---|---|---|---|---|---|---|
| Particle sizea Dparticle (μm) | PLGA core diameterb Dcore (μm) | PDLLA shell thicknessc tshell (μm) | Droplet sized ddroplet (μm) | Core fluid diameterd dcore,droplet (μm) | Shell fluid thicknessd,e τshell,droplet (μm) | Particle sized,f dparticle (μm) | PLGA core diameterd,g dcore,particle (μm) | PDLLA shell thicknessd,h τshell,particle (μm) | ||
| A | 5.5 | 28.1 ± 5.2 | 21.7 | 3.2 | 106.2 ± 13.1 | 54.7 ± 8.3 | 25.7 ± 5.2 | 49.3 ± 6.1 | 32.4 ± 4.9 | 8.5 ± 2.5 |
| B | 5.6 | 31.5 ± 5.4 | 24.3 | 3.6 | 104.3 ± 13.1 | 53.3 ± 8.7 | 25.5 ± 5.0 | 48.4 ± 6.1 | 31.5 ± 5.2 | 8.4 ± 2.4 |
| C | 5.0 | 31.3 ± 4.5 | 21.3 | 5.0 | 110.8 ± 13.7 | 55.2 ± 10.4 | 27.8 ± 4.4 | 58.5 ± 7.2 | 32.7 ± 6.1 | 12.9 ± 2.3 |
The observed deviation between simulation and experimental results may be attributed to the usage of physical properties of DCM for the liquid phase in the CFD model. Polymer solutions may have slightly different fluid properties as compared to the pure solvent properties, and the assumption based on pure solvent properties may only be valid for dilute polymer solutions (Fig. S1 and Table S1, Supplementary Data). The viscosity of polymer solution, for instance, increases with the polymer concentration, and this may influence the cone-jet formation and droplet breakup process.
5. Conclusions
Monodisperse composite core-shell structured microspheres with well defined spherical structure and smooth morphology were fabricated by CEHDA based on the optimized process conditions and solution parameters. Doxorubicin was successfully encapsulated in the PLGA core surrounded by a relatively drug-free PDLLA shell layer. High encapsulation efficiency of the drug was achieved, while the release profiles typically exhibited two stages of constant drug release rates after a short duration of lag phase. Numerical simulation of CEHDA process using a CFD model indicates that the velocity field developed inside the Taylor cone has a considerable impact on the distributions of core and shell fluids. In order to produce the desired compound droplets, a nozzle voltage above a critical value may be necessary in driving the core fluid away from the toroid-shaped vortex and towards jet formation. Based on the process conditions considered, the particle size, core diameter and shell thickness predicted from the simulated compound droplets compare well with those obtained experimentally, although the predicted sizes overestimate the sizes of the microspheres that were obtained experimentally.
Supplementary Material
Highlights.
Composite core-shell structured microspheres were produced by coaxial electrohydrodynamic atomization (CEHDA) process.
Numerical simulation of CEHDA process was performed by using a computational fluid dynamics (CFD) model in Fluent.
CFD model could predict the production of consistent compound droplets, and hence, the expected core-shell structured microspheres.
Acknowledgments
The authors acknowledge the funding support from the National Medical Research Council (NMRC, Singapore) and National Institutes of Health (NIH, USA) under the grant numbers NMRC EDG11may084 and 1R01EB005181, respectively. Qingxing Xu acknowledges the scholarship support from Agency for Science, Technology and Research (A*STAR, Singapore) for NUS-UIUC Joint Ph.D. Program.
Notation
- Acore
cross-sectional area of core channel
- Ashell
cross-sectional area of shell channel
- CPDLLA
concentration of PDLLA
- CPLGA
concentration of PLGA
- dcore,droplet
core fluid diameter from simulation results
- dcore,particle
PLGA core diameter from simulation results
- ddroplet
droplet size from simulation results
- dparticle
particle size from simulation results
- Dcore
PLGA core diameter from experimental results
- Dparticle
particle size from experimental results
- E
electric field
- Fcore
flow rate of core solution
- Fshell
flow rate of shell solution
- FES
electrical stress
- FST
surface tension force
- g
gravitational acceleration
- K
electrical conductivity
- L
length scale for fluid flow
- n
surface normal
- p
pressure of fluid
- qv
volume charge density
- Qcore
volumetric flow rate of core phase
- Qshell
volumetric flow rate of shell phase
- r
r-axis
- t
time
- tshell
PDLLA shell thickness from experimental results
- u
velocity of fluid
- νwater,core
flow rate of water in core phase
- νPDLLA
flow rate of PDLLA
- νPLGA
flow rate of PLGA
- Vbottom
bottom voltage
- Vnozzle
nozzle voltage
- Vright
voltage profile
- Vwater,core
volume ratio of water to DCM in core solution
- xwatercore
volume fraction of water in core solution
- xPDLLA
volume fraction of PDLLA
- xPLGA
volume fraction of PLGA
- z
z-axis
Greek letters
- αi
volume fraction of ith phase
- γ
surface tension
- ε
electrical permittivity of fluid
- κ
surface curvature
- λ
constant
- λabs
absorbance wavelength
- λem
emission wavelength
- λex
excitation wavelength
- μ
viscosity of fluid
- ρ
density of fluid
- ρPDLLA
density of PDLLA
- ρPLGA
density of PLGA
- σM
Maxwell stress tensor
- τE
charge relaxation time scale
- τV
viscous flow time scale
- τγ
surface tension time scale
- τshell,droplet
shell fluid thickness from simulation results
- τshell,particle
PDLLA shell thickness from simulation results
- ϕ
electric potential
Abbreviations
- CEHDA
coaxial electrohydrodynamic atomization
- CFD
computational fluid dynamics
- DCM
dichloromethane
- DMSO
dimethyl sulfoxide
- E.E
encapsulation efficiency
- EHDA
electrohydrodynamic atomization
- i.v
inherent viscosity
- ID
inner diameter
- OD
outer diameter
- PBS
phosphate-buffered saline
- PDLLA
poly(D,L-lactic acid)
- PLGA
poly(D,L-lactic-co-glycolic acid)
- SEM
scanning electron microscope
Footnotes
Publisher's Disclaimer: This is a PDF file of an unedited manuscript that has been accepted for publication. As a service to our customers we are providing this early version of the manuscript. The manuscript will undergo copyediting, typesetting, and review of the resulting proof before it is published in its final citable form. Please note that during the production process errors may be discovered which could affect the content, and all legal disclaimers that apply to the journal pertain.
References
- Ahmad Z, Zhang HB, Farook U, Edirisinghe M, Stride E, Colombo P. Generation of multilayered structures for biomedical applications using a novel tri-needle coaxial device and electrohydrodynamic flow. Journal of the Royal Society Interface. 2008;5:1255–1261. doi: 10.1098/rsif.2008.0247. [DOI] [PMC free article] [PubMed] [Google Scholar]
- Bocanegra R, Galán D, Márquez M, Loscertales IG, Barrero A. Multiple electrosprays emitted from an array of holes. Journal of Aerosol Science. 2005;36:1387–1399. [Google Scholar]
- Bock N, Dargaville TR, Woodruff MA. Electrospraying of polymers with therapeutic molecules: state of the art. Progress in Polymer Science. 2012;37:1510–1551. [Google Scholar]
- Brackbill JU, Kothe DB, Zemach C. A continuum method for modeling surface tension. Journal of Computational Physics. 1992;100:335–354. [Google Scholar]
- Chakraborty S, Liao IC, Adler A, Leong KW. Electrohydrodynamics: A facile technique to fabricate drug delivery systems. Advanced Drug Delivery Reviews. 2009;61:1043–1054. doi: 10.1016/j.addr.2009.07.013. [DOI] [PMC free article] [PubMed] [Google Scholar]
- Chen DR, Pui DYH, Kaufman SL. Electrospraying of conducting liquids for monodisperse aerosol generation in the 4 nm to 1.8 μm diameter range. Journal of Aerosol Science. 1995;26:963–977. [Google Scholar]
- Chen H, Zhao Y, Song Y, Jiang L. One-step multicomponent encapsulation by compound-fluidic electrospray. Journal of the American Chemical Society. 2008;130:7800–7801. doi: 10.1021/ja801803x. [DOI] [PubMed] [Google Scholar]
- Chen X, Jia L, Yin X, Cheng J, Lu J. Spraying modes in coaxial jet electrospray with outer driving liquid. Physics of Fluids. 2005;17:032101. [Google Scholar]
- Choi DH, Park CH, Kim IH, Chun HJ, Park K, Han DK. Fabrication of core-shell microcapsules using PLGA and alginate for dual growth factor delivery system. Journal of Controlled Release. 2010;147:193–201. doi: 10.1016/j.jconrel.2010.07.103. [DOI] [PubMed] [Google Scholar]
- Enayati M, Chang MW, Bragman F, Edirisinghe M, Stride E. Electrohydrodynamic preparation of particles, capsules and bubbles for biomedical engineering applications. Colloids and Surfaces A: Physicochemical and Engineering Aspects. 2011;382:154–164. [Google Scholar]
- Fenn JB, Mann M, Meng CK, Wong SF, Whitehouse CM. Electrospray ionization for mass spectrometry of large biomolecules. Science. 1989;246:64–71. doi: 10.1126/science.2675315. [DOI] [PubMed] [Google Scholar]
- Gañán-Calvo AM, Lasheras JC, Dávila J, Barrero A. The electrostatic spray emitted from an electrified conical meniscus. Journal of Aerosol Science. 1994;25:1121–1142. [Google Scholar]
- Gañán-Calvo AM, Dávila J, Barrero A. Current and droplet size in the electrospraying of liquids. Scaling laws. Journal of Aerosol Science. 1997;28:249–275. [Google Scholar]
- Hu JF, Li SF, Nair GR, Wu WT. Predicting chitosan particle size produced by electrohydrodynamic atomization. Chemical Engineering Science. 2012;82:159–165. [Google Scholar]
- Hua J, Lim LK, Wang CH. Numerical simulation of deformation/motion of a drop suspended in viscous liquids under influence of steady electric fields. Physics of Fluids. 2008;20:113302. [Google Scholar]
- Hwang YK, Jeong U, Cho EC. Production of uniform-sized polymer core-shell microcapsules by coaxial electrospraying. Langmuir. 2008;24:2446–2451. doi: 10.1021/la703546f. [DOI] [PubMed] [Google Scholar]
- Jain RA. The manufacturing techniques of various drug loaded biodegradable poly(lactide-co-glycolide) (PLGA) devices. Biomaterials. 2000;21:2475–2490. doi: 10.1016/s0142-9612(00)00115-0. [DOI] [PubMed] [Google Scholar]
- Kim W, Kim SS. Multishell encapsulation using a triple coaxial electrospray system. Analytical Chemistry. 2010;82:4644–4647. doi: 10.1021/ac100278c. [DOI] [PubMed] [Google Scholar]
- Kim W, Kim SS. Synthesis of biodegradable triple-layered capsules using a triaxial electrospray method. Polymer. 2011;52:3325–3336. [Google Scholar]
- Lastow O, Balachandran W. Numerical simulation of electrohydrodynamic (EHD) atomization. Journal of Electrostatics. 2006;64:850–859. [Google Scholar]
- Lee YH, Mei F, Bai MY, Zhao S, Chen DR. Release profile characteristics of biodegradable-polymer-coated drug particles fabricated by dual-capillary electrospray. Journal of Controlled Release. 2010;145:58–65. doi: 10.1016/j.jconrel.2010.03.014. [DOI] [PubMed] [Google Scholar]
- Lee YH, Bai MY, Chen DR. Multidrug encapsulation by coaxial tri-capillary electrospray. Colloids and Surfaces B: Biointerfaces. 2011;82:104–110. doi: 10.1016/j.colsurfb.2010.08.022. [DOI] [PubMed] [Google Scholar]
- Leonard BP, Mokhtari S. ULTRA-SHARP Nonoscillatory Convection Schemes for High-Speed Steady Multidimensional Flow. NASA Lewis Research Center; 1990. NASA TM 1–2568 (ICOMP-90-12) [Google Scholar]
- Lim LK, Hua J, Wang CH, Smith KA. Numerical simulation of cone-jet formation in electrohydrodynamic atomization. AIChE Journal. 2011;57:57–78. [Google Scholar]
- López-Herrera JM, Barrero A, López A, Loscertales IG, Márquez M. Coaxial jets generated from electrified Taylor cones. Scaling laws. Journal of Aerosol Science. 2003;34:535–552. [Google Scholar]
- Loscertales IG, Barrero A, Guerrero I, Cortijo R, Marquez M, Gañán-Calvo AM. Micro/nano encapsulation via electrified coaxial liquid jets. Science. 2002;295:1695–1698. doi: 10.1126/science.1067595. [DOI] [PubMed] [Google Scholar]
- Mei F, Chen DR. Investigation of compound jet electrospray: particle encapsulation. Physics of Fluids. 2007;19:103303. [Google Scholar]
- Melcher JR, Taylor GI. Electrohydrodynamics: a review of the role of interfacial shear stresses. Annual Review of Fluid Mechanics. 1969;1:111–146. [Google Scholar]
- Naraharisetti PK, Ong BYS, Xie JW, Lee TKY, Wang CH, Sahinidis NV. In vivo performance of implantable biodegradable preparations delivering Paclitaxel and Etanidazole for the treatment of glioma. Biomaterials. 2007;28:886–894. doi: 10.1016/j.biomaterials.2006.09.044. [DOI] [PubMed] [Google Scholar]
- Nie H, Dong Z, Arifin DY, Hu Y, Wang CH. Core/shell microspheres via coaxial electrohydrodynamic atomization for sequential and parallel release of drugs. Journal of Biomedical Materials Research Part A. 2010a;95:709–716. doi: 10.1002/jbm.a.32867. [DOI] [PubMed] [Google Scholar]
- Nie H, Fu Y, Wang CH. Paclitaxel and suramin-loaded core/shell microspheres in the treatment of brain tumors. Biomaterials. 2010b;31:8732–8740. doi: 10.1016/j.biomaterials.2010.07.080. [DOI] [PubMed] [Google Scholar]
- Pareta R, Edirisinghe MJ. A novel method for the preparation of biodegradable microspheres for protein drug delivery. Journal of the Royal Society Interface. 2006;3:573–582. doi: 10.1098/rsif.2006.0120. [DOI] [PMC free article] [PubMed] [Google Scholar]
- Patankar SV. Numerical Heat Transfer and Fluid Flow. Hemisphere; New York: 1980. [Google Scholar]
- Regele JD, Papac MJ, Rickard MJA, Dunn-Rankin D. Effects of capillary spacing on EHD spraying from an array of cone jets. Journal of Aerosol Science. 2002;33:1471–1479. [Google Scholar]
- Rosell-Llompart J, Fernández de la Mora J. Generation of monodisperse droplets 0.3 to 4 μm in diameter from electrified cone-jets of highly conducting and viscous liquids. Journal of Aerosol Science. 1994;25:1093–1119. [Google Scholar]
- Rulison AJ, Flagan RC. Scale-up of electrospray atomization using linear arrays of Taylor cones. Review of Scientific Instruments. 1993;64:683–686. [Google Scholar]
- Saville DA. Electrohydrodynamics: the Taylor-Melcher leaky dielectric model. Annual Review of Fluid Mechanics. 1997;29:27–64. [Google Scholar]
- Wu Y, Yu B, Jackson A, Zha W, Lee LJ, Wyslouzil BE. Coaxial electrohydrodynamic spraying: a novel one-step technique to prepare oligodeoxynucleotide encapsulated lipoplex nanoparticles. Molecular Pharmaceutics. 2009;6:1371–1379. doi: 10.1021/mp9000348. [DOI] [PubMed] [Google Scholar]
- Xie J, Marijnissen JC, Wang CH. Microparticles developed by electrohydrodynamic atomization for the local delivery of anticancer drug to treat C6 glioma in vitro. Biomaterials. 2006;27:3321–3332. doi: 10.1016/j.biomaterials.2006.01.034. [DOI] [PubMed] [Google Scholar]
- Xie J, Ng WJ, Lee LY, Wang CH. Encapsulation of protein drugs in biodegradable microparticles by co-axial electrospray. Journal of Colloid and Interface Science. 2008;317:469–476. doi: 10.1016/j.jcis.2007.09.082. [DOI] [PubMed] [Google Scholar]
- Yan F, Farouk B, Ko F. Numerical modeling of an electrostatically driven liquid meniscus in the cone–jet mode. Journal of Aerosol Science. 2003;34:99–116. [Google Scholar]
- Yoon H, Woo JH, Ra YM, Yoon SS, Kim HY, Ahn S, Yun JH, Gwak J, Yoon K, James SC. Electrostatic spray deposition of copper–indium thin films. Aerosol Science and Technology. 2011;45:1448–1455. [Google Scholar]
- Zhang S, Kawakami K, Yamamoto M, Masaoka Y, Kataoka M, Yamashita S, Sakuma S. Coaxial electrospray formulations for improving oral absorption of a poorly water-soluble drug. Molecular Pharmaceutics. 2011;8:807–813. doi: 10.1021/mp100401d. [DOI] [PubMed] [Google Scholar]
Associated Data
This section collects any data citations, data availability statements, or supplementary materials included in this article.


