

Abstract
Aberrant activation of the Hedgehog (Hh) pathway can drive tumorigenesis1. To investigate the mechanism by which glioma-associated oncogene family zinc finger-1 (GLI1), a crucial effector of Hh signaling2, regulates Hh pathway activation, we searched for GLI1-interacting proteins. We report that the chromatin remodeling protein SNF5 (encoded by SMARCB1, hereafter called SNF5), which is inactivated in human malignant rhabdoid tumors (MRTs), interacts with GLI1. We show that Snf5 localizes to Gli1-regulated promoters and that loss of Snf5 leads to activation of the Hh-Gli pathway. Conversely, re-expression of SNF5 in MRT cells represses GLI1. Consistent with this, we show the presence of a Hh-Gli–activated gene expression profile in primary MRTs and show that GLI1 drives the growth of SNF5-deficient MRT cells in vitro and in vivo. Therefore, our studies reveal that SNF5 is a key mediator of Hh signaling and that aberrant activation of GLI1 is a previously undescribed targetable mechanism contributing to the growth of MRT cells.
The Hh pathway has critical functions in tissue patterning and differentiation during development1. Aberrant activation of the pathway resulting from mutations in the PTCH1 gene (encoding Patched-1 receptor) and SMO gene (encoding the Smoothened homolog signal transducer) contribute to medulloblastoma and basal cell carcinomas3,4. In addition, amplifications in the GLI1 transcription factor occur in gliomas and medulloblastomas5,6, and the oncogenic potential of GLI1 has been validated in transgenic mouse models2. However, understanding of the precise mechanisms by which GLI transcription factors are regulated is limited. We thus sought to investigate the mechanism by which GLI1 controls pathway activation.
We performed affinity purification–mass spectrometry (AP-MS) to identify proteins that interact with GLI1. We used tandem affinity purification (TAP) to isolate GLI1 from mouse TM3 cells (Supplementary Fig. 1a,b), a Hh-responsive testicular epithelial cell line, and identified interacting proteins (Fig. 1a). The top-scoring interactor was Sufu, a bona fide GLI1-interacting protein that negatively regulates its activity7. Notably, the chromatin remodeling protein Snf5 (E = 0.0022, false discovery rate P value = 0.0022) and several other SWI/SNF complex subunits, Smarcc2 (E = 0.0186, P = 0.0093) and Smarce1 (E = 0.0005, P = 0.0005), were among the top interactors of GLI1 (Fig. 1a). AP-MS experiments with TAP-tagged GLI2, however, did not yield Snf5 or its associated complex members (data not shown), thereby showing specificity in the interaction of Snf5 with GLI1. To confirm the interaction, we performed immunoprecipitation of endogenous Snf5 in TM3 cells transiently expressing GLI1 and found that GLI1 immunoprecipitated with Snf5 (Fig. 1b). As a control, we repeated this with SNF5-deficient G401 human MRT cells. We did not detect GLI1 in this case (Supplementary Fig. 1c), confirming that GLI1 is only immunoprecipitated in the presence of Snf5. In TM3 cells transiently expressing various GLI1 deletion mutants, we localized the interaction domain to the C terminus of GLI1 outside of the activation domain (Supplementary Fig. 2a–c); this is a region less conserved among the three GLI proteins, supporting a specific interaction between Snf5 and GLI1.
Figure 1.
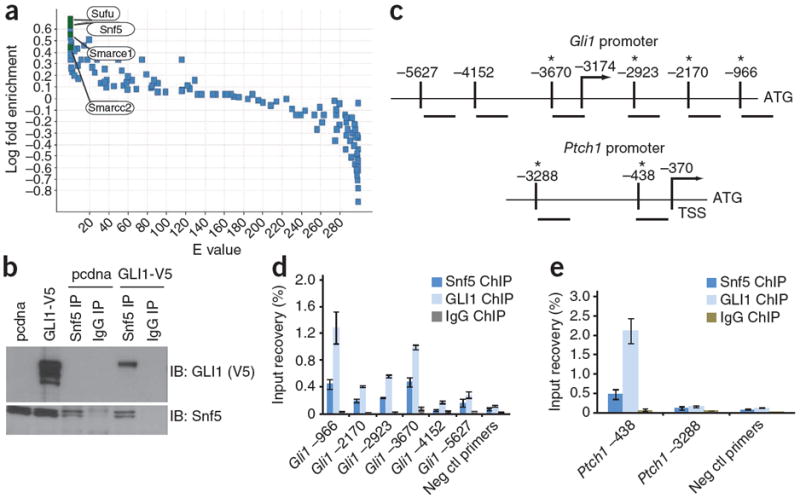
Snf5 interacts with GLI1 and localizes to Gli1 regulated promoters. (a) All proteins precipitated by TAP-GLI and detected by mass spectrometry are indicated by a single data point. The y axis shows the log10 fold ratios comparing the frequency with which each mouse protein was detected in the TAP-GLI1 protein purifications relative to the 26 TAP-protein purifications in our entire mouse database. The x axis shows the associated expected (E) values calculated using binomial statistics corrected for multiple hypotheses (false discovery rate–corrected P values not shown). (b) Immunoblot of GLI1 in whole-cell lysates from TM3 cells transfected with a vector control (pcdna) or GLI1-V5-tagged vector (shown in the first two lanes), and from GLI1-V5 expressing lysates subjected to immunoprecipitation (IP) of endogenous Snf5 with a Snf5-specific antibody or a control IgG (as indicated in lanes three through six). (c) Schematic of the mouse Gli1 and Ptch1 promoters showing locations of primers relative to the ATG translation initiation site. The arrow shows the location of the transcriptional start site (TSS) and the asterisk (*) denotes proximity of the primer set to sequences resembling the Gli1 recognition sequence. (d,e) Quantitative PCR (qPCR) with primers binding the locations depicted in c, showing percentage input recoveries of Snf5 and GLI1 at the Gli1 (d) and Ptch1 (e) promoters in ChIP performed with TM3 GLI1-V5 cells with a Snf5-specific antibody, a V5-specific antibody or a rabbit IgG. qPCR was performed in triplicate and input recovery (%) is shown as mean ± s.d. Ctl, control.
Snf5 is a core member of the ATP-dependent SWI-SNF chromatin remodeling complex, which contributes to regulation of gene expression via modulation of chromatin structure8-10. Because Ptch1 is a target of GLI1, as is Gli1 itself11,12, we determined if Snf5 associates with Gli1-regulated promoters by chromatin immunoprecipitation (ChIP), (Fig. 1c). Both Snf5 and GLI1 were enriched at regions upstream of the transcriptional start sites of both promoters (Fig. 1d,e).
We next tested the effect of shRNA-mediated knockdown of Snf5 upon the expression of the Gli1 target genes Gli1 and Ptch111,12 (Fig. 2a) and found both to be upregulated (Fig. 2b). This is unlikely to be influenced by changes in expression of other Hh pathway components, as the expression of Smo and Gli2 remained unaffected (Fig. 2b) and Hh ligands remained undetectable (data not shown). We further investigated this regulation in Snf5 conditional knockout primary mouse embryonic fibroblasts (MEFs)13. Inactivation of Snf5 (Fig. 2c) resulted in an eight- to tenfold increase in Gli1 expression (Fig. 2d) and an approximately twofold increase in Ptch1 expression (Supplementary Fig. 3a). As the SWI-SNF complex regulates nucleosome mobilization, we evaluated the effects of Snf5 inactivation on nucleosome distribution at Gli1-target promoters and found that it led to a significant (P < 0.05 for Gli1 gene and P < 0.001 for Ptch1, Fisher’s exact test) decrease in the density of nucleosomes at the Gli1 and Ptch1 promoters (Supplementary Fig. 4a,b).
Figure 2.

Loss of Snf5 leads to activation of the Hh-Gli pathway in vitro and in vivo. (a) Immunoblot showing reduction of Snf5 protein in TM3 cells expressing Snf5-targeting shRNA but not TM3 cells expressing nontargeting control (Ctl) shRNA. Gapdh, glyceraldehyde 3-phosphate dehydrogenase. (b) Quantitative RT-PCR showing expression of Snf5, Gli1, Gli2, Ptch1 and Smo mRNA in TM3 cells expressing shRNA targeting Snf5. Values are shown as mean ± s.d. (c) Immunoblot showing loss of Snf5 protein in Cre recombinase–treated Snf5fl/− (fl1 and fl2 are duplicate samples) primary MEFs; β-actin is shown as a loading control. (d) Quantitative RT-PCR showing expression of Gli1 mRNA in the above (same as in c) Cre-treated Snf5fl/− MEFs (labeled as Snf5fl/− 1, Snf5fl/− 2). The experiment was performed in duplicate, and expression is shown as mean ± s.d. (e) In situ hybridization showing the expression of Gli1 in the limb buds of littermate control (Snf5fl/+; Prx1-Cre) and Snf5-deficient (Snf5fl/fl; Prx1-Cre) embryos at day 11.5. Boxed regions are enlarged beneath their respective images. WT, wild type.
We evaluated whether Snf5 controls Gli1 expression during normal development in vivo. As the Hh pathway serves a key role in limb patterning, we used the Paired related homeobox (Prx1)-Cre transgenic mouse line14,15 to inactivate Snf5 in the early limb bud mesenchyme. We then examined the consequences of Snf5 inactivation during early limb development. Gli1 transcripts are normally restricted to the posterior half of the developing limb (Fig. 2e) (reviewed in ref. 16). Inactivation of Snf5 led to markedly increased levels of Gli1 as well as ectopic expression throughout both anterior and posterior fields (Fig. 2e). Therefore, in all three experimental contexts, loss of Snf5 leads to the upregulation of Gli1, demonstrating that Snf5 normally has a role in restraining Hh-Gli signaling.
Snf5 and Brg1 are similar in that they are both bona fide tumor suppressors and core subunits of the SWI-SNF complex. However, the relationship between the two is complex, as residual activity of Brg1 is essential for lymphoma formation driven by Snf5 inactivation17. We therefore investigated their relationship in the regulation of Gli1 activity. Inactivation of Brg1 also resulted in a substantial increase in Gli1 expression (Supplementary Fig. 5a,b), as did concurrent inactivation of Snf5 and Brg1 (Supplementary Fig. 5b). This suggests that Gli1 is a common target of the SWI-SNF complex and may be central to the tumor suppressor activity of both Snf5 and Brg1.
Biallelic inactivation of SNF5 occurs in a majority of MRTs, which are poorly differentiated cancers arising in the kidney, brain (atypical teratoid rhabdoid tumors), liver and soft tissues18-20. Notably, SNF5-deficient tumor cells are diploid and genomically stable, suggesting that the major driver of malignancy upon SNF5 loss consists of changes in epigenetically driven transcriptional control of gene expression21,22. We hypothesized that the Hh-Gli pathway is aberrantly activated in SNF5-deficient MRT cells. GLI1 mRNA expression was indeed higher in MRT cell lines than in cancer cell lines of various origins (Fig. 3a). Re-expression of SNF5 in two independent SNF5-deficient MRT cell lines (Fig. 3b and Supplementary Fig. 6a) led to a marked suppression of GLI1 mRNA (Fig. 3c and Supplementary Fig. 6b). Therefore, SNF5-induced repression of GLI1 in MRT cells is consistent with our findings that Snf5 deficiency results in hyperactivation of the Hh-Gli pathway. Taken together, these findings suggest that Snf5 normally is involved in limiting Gli1 expression.
Figure 3.
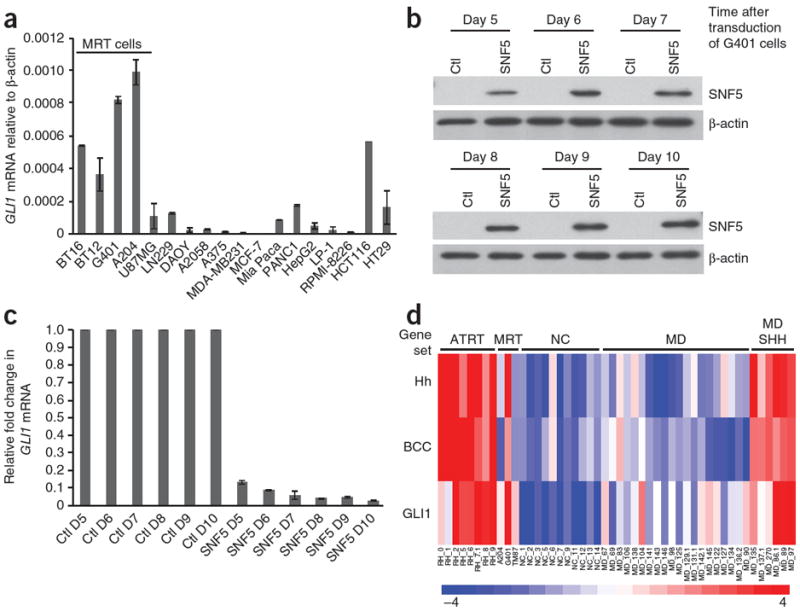
The Hh-Gli pathway is activated in MRT cell lines and primary tumors. (a) Quantitative RT-PCR of expression of GLI1 relative to β-actin in MRT cells (A204, G401, BT12 and BT16) and in glioblastoma (U87MG and LN229), medulloblastoma (DAOY), melanoma (A2058 and A375), multiple myeloma (LP1 and RPMI-8226), breast (MDA-MB231 and MCF7) and pancreas (MiaPaca, PANC1) cancer cell lines. (b) Immunoblot of SNF5 expression in G401 cells after 5 d of selection following retroviral infection with a SNF5-expressing vector or a control vector (Ctl); β-actin is shown as a loading control. (c) Quantitative RT-PCR showing GLI1 expression in Ctl vector–transduced and SNF5-expressing G401 cells. The experiment shown is representative of three independent experiments, and values represent mean ± s.d. of triplicate samples. (d) Heat map showing the single-sample signature profiles using the Hh signaling pathway, basal cell carcinoma (BCC) and GLI1-induced gene expression gene sets in a multi-tumor gene expression panel. ATRT, primary brain MRTs; MRT, three MRT cell lines; NC, normal cerebellum; MD, medulloblastoma; MD SHH, medulloblastoma with Hh pathway activation.
To investigate whether transcriptional upregulation of GLI1 and its downstream targets occurs in primary human rhabdoid tumors, we analyzed microarray data from eight primary brain rhabdoid tumors, three MRT cell lines, 11 normal cerebellum samples and 25 primary medulloblastomas13,23. A subset of these medulloblastomas have genetic mutations in PTCH1 and show an activated Hh pathway gene expression profile, thus serving as positive controls in our analyses23. Primary SNF5-deficient tumors indeed showed enrichment of gene expression associated with both Hh pathway activation (P = 2.72 × 10⁻⁶), and GLI1 overexpression signatures (P = 0.0063) (Fig. 3d), similar to Hh-activated medulloblastomas (P = 0.00207 for the Hh pathway and P = 0.00298 for the GLI1 overexpression gene sets) and to basal cell carcinomas (P = 1.19 × 10⁻⁷), which often possess activating mutations in the Hh pathway (Fig. 3d). A Snf5-null gene expression signature13 and CYCLIN-D1 overexpression signature were used as controls24, showing expected trends in the primary rhabdoid tumors (Supplementary Fig. 7a).
We next evaluated whether upregulation of GLI1 is required for the proliferation of SNF5-deficient cells. Doxycyline-inducible, shRNA-mediated knockdown of GLI1 in three MRT cell lines (Fig. 4a and Supplementary Fig. 8a) resulted in impaired proliferation (Fig. 4b–d and Supplementary Fig. 8c,d) as well as in the inhibition of colony formation (Fig. 4e). Proliferation was rescued by overexpression of a doxycycline-inducible GLI1 construct not containing the shRNA recognition sequence (Fig. 4c). To determine whether GLI1 is necessary for the growth of rhabdoid tumors in vivo, we established subcutaneous xenografts of G401 cells in severe combined immunodeficient (SCID) mice, which lack T and B cells, using the doxycycline-inducible cells. In contrast to vehicle treatments, treatment of mice with doxycycline depleted GLI1 protein (Supplementary Fig. 8b) and markedly inhibited tumor growth (Fig. 4f). Treatment of MRT cells with a small-molecule inhibitor of GLI, Hedgehog pathway inhibitor-1 (HPI-1)25, similarly led to dose-dependent decreases in GLI1 transcripts and inhibition of cell proliferation (Supplementary Fig. 9a–d). In contrast, treatment with a highly specific SMO antagonist, NVP-LDE225 (ref. 26) had no effect on GLI1 expression or proliferation of SNF5-deficient MRT cells (Supplementary Figs. 10a–d), as would be expected if Hh activation occurs downstream of SMO through activation of GLI1. Collectively, these results show an essential role for GLI1 in the proliferation of SNF5-deficient cancer cells. Finally, our preliminary findings indicate that Snf5 interacts with GLI1 even upon stimulation of the pathway with an agonist (Supplementary Fig. 11a,b). This suggests that Snf5 could functionally prevent hyperactivation of the pathway, although the precise mechanisms will need to be addressed.
Figure 4.
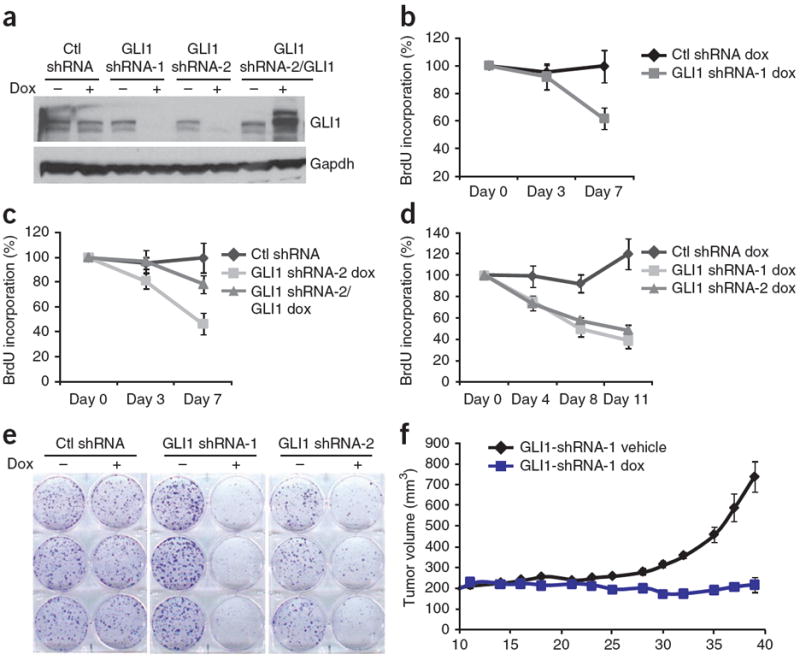
Inhibition of GLI1 impairs proliferation of MRT cells. (a) Immunoblot showing reduction of GLI1 protein in G401 cells upon induction with doxycycline (dox) of GLI1 shRNAs or of a nontargeting control (Ctl) shRNA. GLI1 is overexpressed upon doxycycline treatment in cells carrying both the inducible GLI1 shRNA and inducible GLI1 vectors; Gapdh is included as a loading control. (b) BrdU assay showing cell proliferation over a time course of doxycycline induction of GLI1 shRNA-1 or Ctl shRNAs in G401 cells. (c) BrdU time-course assay in G401 cells showing cell proliferation following doxycycline-induced expression of a control (Ctl) shRNA, GLI1 shRNA-2 or GLI1shRNA-2 accompanied by expression of a doxycycline-inducible GLI1 construct not containing the shRNA recognition sequence. (d) BrdU assay in A204 cells showing cell proliferation following doxycycline induction of Ctl, GLI1 shRNA-1 and GLI1shRNA-2. All assays were performed in triplicate, and BrdU incorporation in doxycycline-treated cells is represented as percentage of BrdU label compared to uninduced cells. Values are shown as mean ± s.d. (e) Colony formation in A204 cells in the absence and presence of doxycycline induction of Ctl shRNA, GLI1 shRNA-1 and GLI1 shRNA-2. A representative experiment of at least three independent experiments performed in triplicate is shown. (f) Tumor volumes over a time course of vehicle- and doxycycline-treated animals bearing G401 MRT cells containing inducible GLI1 shRNA-1. Tumor volume is reported as mean ± s.e.m.; n = 8 per treatment group.
Transcriptional activity is regulated by nucleosome position and density, with more open chromatin structure and decreased nucleosomal density occurring at the promoters of highly transcribed genes. Our findings suggest a model whereby the SWI-SNF complex physically interacts with GLI1 to directly regulate activity of the Hh pathway via control of chromatin structure at GLI1 target promoters. Although we have demonstrated that the tumor-suppressor effects of SNF5 require interaction with GLI1, SNF5 has other interactions of potential cancer relevance, such as with the oncoprotein c-Myc and the tumor suppressor p53 (refs. 27-30). We thus suggest a mechanistic model whereby loss of SNF5 drives cancer formation through simultaneous epigenetic perturbation of GLI1 and other key cancer-promoting pathways, several of which may thus constitute viable therapeutic targets.
In evaluating the relevance of SNF5 regulation of GLI1, we show that SNF5-deficient MRT cells have hyperactivated GLI signaling, which has a role in their growth. Our studies reveal a previously undiscovered mechanism controlling the Hh pathway that has potential therapeutic implications for an aggressive cancer for which no targeted therapy currently exists. For cancers with proximal activation of the Hh pathway, treatment with SMO inhibitors has shown clinical efficacy and little toxicity31. However, as Hh pathway activation can occur downstream of SMO, as we demonstrate in SNF5-deficient MRT cells, our studies provide further understanding and a rationale for the inhibition of GLI1 in targeted cancer treatment.
ONLINE METHODS
Tandem affinity purification-tagged–proteins and mass spectrometry
Human GLI1 was tagged at the C terminus with the TAP tag and stably expressed in TM3 cells (American Type Culture Collection) by retrovirus-mediated gene transfer32. Mouse TM3 cells are commonly used in studies pertaining to Hh signal transduction because they show an increase in Gli1 and Ptch1 transcripts in response to stimulation with a Smo agonist33. GLI1 transduction was verified by immunoblotting, and GLI1-TAP–containing protein complexes were subsequently purified from nuclear extracts and subjected to one-dimensional SDS-PAGE. Gel lanes were cut into slices across the full separation range and subjected to in-gel tryptic digestion. Peptide mass and fragmentation data obtained by liquid chromatography–tandem mass spectrometry were used to query a version (curated in house) of the International Protein Index database using Mascot (Matrix Science)32. Statistical analysis of candidate GLI1 protein interactors was performed using the binomial test (described in the Supplementary Methods).
Chromatin immunoprecipitation assay
TM3 cells were grown to subconfluence, and cross-linking was performed with disuccinimidyl glutarate (2 mM; Pierce Biotech) followed by formaldehyde (1%). Cells were lysed in 0.5% SDS lysis buffer followed by sonication with a Misonix 3000 sonicator for a total of 4 min (30-s pulses with 30-s rests, power 3.5). Lysates were processed using standard ChIP procedures34 using a control rabbit IgG, V5-specific antibody (ChIP grade; Abcam, cat. no. 9116) or a Snf5 antibody (Bethyl Laboratories, cat. no. A301-087A). Quantitative PCR was performed with the SYBR Green master mix (Applied Biosystems), and enrichment was calculated using the percentage-of-input method (see ChIP analysis online guide; http://www.invitrogen.com/site/us/en/home/Products-and-Services/Applications/RNAi-Epigenetics-and-Gene-Regulation/Chromatin-Remodeling/Chromatin-Immunoprecipitation-ChIP/chip-analysis.html). Primers were designed to amplify the promoter regions of the mouse Ptch1 and Gli1 genes (see Supplementary Methods), some in proximity to sequences resembling consensus Gli1 binding sites.
Generation of Snf5-deficient primary mouse embryonic fibroblasts
Primary MEFs were collected from embryos at day 13.5 and maintained in DMEM (10% FCS, 2mM l-glutamine, nonessential amino acids, and 100 U penicillin-streptomycin per ml (Gibco)). Inactivation of Snf5, Brg1, or Snf5 and Brg1 was achieved with retroviral infection with pBabe-puror-Cre (vector backbone from AddGene, plasmid 1764). Cells were selected in medium containing puromycin (2.5 μg ml−1) (Clontech) 48 h after infection.
Mouse strains
Conditional Snf5 loss-of-function mutant mice (Snf5fl/fl; Prx1-Cre) were generated by intercrossing Prx1-Cre transgenic mice14 with mice carrying the floxed Snf5 allele35.
In situ hybridizations
Whole-mount in situ hybridizations were performed essentially as described in ref. 36 using nonradioactive digoxygenin (DIG)-labeled probes generated according to the manufacturer’s instructions (Roche). The Gli1 probe was generously provided by C. Tabin.
Microarray analysis and signature projection methodology
Snap-frozen tumor ATRT and medulloblastoma samples were obtained from brain tumor resections performed at Children’s Hospital Boston under approval from its Institutional Review Board. Informed consent was obtained in all cases. Total RNA was isolated using Trizol reagent (Invitrogen) per the manufacturer’s protocol. RNA was applied to Affymetrix U133A2 arrays, and CEL files (CEL files are Affymetrix files with intensity calculations on the pixel values of the Affymetrix DAT files; for more details see http://www.affymetrix.com/estore/support/developer/powertools/changelog/gcos-agcc/cel.html.affx) were preprocessed using robust multiarray averaging37. Arrays were visualized using GenePattern software (http://www.broadinstitute.org/cancer/software/genepattern/). For each gene set of interest (for example, Snf5-null) we defined a numerical score to represent the single-sample absolute enrichment in each of the samples following a previously described procedure38. Briefly, we preprocessed the gene-expression data set by mapping Affymetrix gene probes to gene symbols using the gene set enrichment analysis desktop application (GSEA)39. The mapping of gene probes to gene symbols is done by selecting ‘collapse’ in the tools menu and then choosing the ‘by-max’ parameter. Genes were ranked by absolute expression for each sample. The enrichment score was produced by evaluating a weighted integral (sum) of the difference between the empirical cumulative distribution functions (ECDF) of the genes in the gene set versus the genes not in the set, rather than by using the maximum (Kolmogorov-Smirnov) as used in GSEA. For gene sets with upregulated and downregulated versions, a combined score was produced by subtracting the downregulated from the upregulated scores). To quantify the degree of matching between phenotypes and pathway profiles, we used the area under the receiver operating characteristic (ROC) curve ranging from 0.5 (random match) to 1.0 (perfect match). Statistical significance was computed with a binomial test. Both computations use the R ‘verification’ package (http://cran.r-project.org/web/packages/verification/index.html).
In vivo efficacy study of doxycycline-inducible GLI1 shRNA
SCID/beige mice (Charles River Laboratories) were allowed to acclimate in the Novartis Institutes for BioMedical Research animal facility with ad libitum access to food and water for at least 3 d before manipulation. Mice were handled in accordance with Novartis Animal Care and Use Committee protocols and regulations. Stably infected G401 cells were free of mycoplasma and viral contamination (Infectious Microbe PCR Amplification Test, Research Animal Diagnostic Laboratory, University of Missouri). Mice (8 weeks old) were inoculated subcutaneously with 5 × 10⁶ cells in 50% Matrigel (BD Biosciences) in the right dorsal axillary region. Tumor dimensions were obtained with calipers, and tumor volume was calculated as (l × w2) / 2, where l represents length and w represents width. Nine days after implantation, mice were randomized and sorted into treatment groups (n = 8 per group) on the basis of tumor volume (mean, 184–211 mm3). Mice received vehicle (5% sucrose) or doxycycline (Sigma-Aldrich) (1mg ml−1 in 5% sucrose) via oral gavage for the duration of the study.
Statistical analyses
The binomial statistical method was used to calculate significance of candidate interactors in the protein-protein interaction screen and is further described in Supplementary Methods. Statistical significance for the gene signature projection was calculated using the binomial test and that of nucleosome density was computed using Fisher’s exact test. In all cases, p < 0.05 was considered to indicate statistical significance.
Additional methods
Detailed methodology is described in the Supplementary Methods.
Supplementary Material
Acknowledgments
We thank X. Wang, A. Bouret, J. DaSilva and A. Carlson for their assistance and S. S. Kadam for critical advice. The Gli1 probe was generously provided by C. Tabin (Harvard University Medical School).
Footnotes
AUTHOR CONTRIBUTIONS
Z.J. initiated the studies, conducted most of the experiments, analyzed data and wrote the manuscript. E.L.M.-B. conducted the Gli1 in situ experiments. C.G.S. generated Snf5-inactivated MEFs. E.S.M. contributed to Snf5 re-expression studies. B.W. assisted with ChIP studies. D.C. and J.M. conducted in vivo experiments. J.K. performed statistical analysis from interaction screen. P.T., Y.-J.C., J.P.M. and S.L.P. contributed to the gene expression analysis. M.T. and P.J.P. performed nucleosome repositioning assays. H.R., T.B., S.J.L. and J.F.K. contributed to the TAP-protein interaction screen. P.T.L.N. contributed to GLI shRNA studies. K.H. generated vectors for GLI1 deletions. S.B. contributed to the writing of the manuscript. M.W., W.R.S., C.W.M.R. and M.D. supervised the studies, assisted in data analysis and contributed to the writing of the manuscript.
Note: Supplementary information is available on the Nature Medicine website.
COMPETING FINANCIAL INTERESTS
The authors declare competing financial interests: details accompany the full-text HTML version of the paper at http://www.nature.com/naturemedicine/.
References
- 1.Jiang J, Hui CC. Hedgehog signaling in development and cancer. Dev Cell. 2008;15:801–812. doi: 10.1016/j.devcel.2008.11.010. [DOI] [PMC free article] [PubMed] [Google Scholar]
- 2.Ruiz i Altaba A, Mas C, Stecca B. The Gli code: an information nexus regulating cell fate, stemness and cancer. Trends Cell Biol. 2007;17:438–447. doi: 10.1016/j.tcb.2007.06.007. [DOI] [PMC free article] [PubMed] [Google Scholar]
- 3.Gailani MR, et al. The role of the human homologue of Drosophila patched in sporadic basal cell carcinomas. Nat Genet. 1996;14:78–81. doi: 10.1038/ng0996-78. [DOI] [PubMed] [Google Scholar]
- 4.Raffel C, et al. Sporadic medulloblastomas contain PTCH mutations. Cancer Res. 1997;57:842–845. [PubMed] [Google Scholar]
- 5.Kinzler KW, et al. Identification of an amplified, highly expressed gene in a human glioma. Science. 1987;236:70–73. doi: 10.1126/science.3563490. [DOI] [PubMed] [Google Scholar]
- 6.Northcott PA, et al. Multiple recurrent genetic events converge on control of histone lysine methylation in medulloblastoma. Nat Genet. 2009;41:465–472. doi: 10.1038/ng.336. [DOI] [PMC free article] [PubMed] [Google Scholar]
- 7.Kogerman P, et al. Mammalian suppressor-of-fused modulates nuclear-cytoplasmic shuttling of Gli-1. Nat Cell Biol. 1999;1:312–319. doi: 10.1038/13031. [DOI] [PubMed] [Google Scholar]
- 8.Roberts CW, Orkin SH. The SWI/SNF complex–chromatin and cancer. Nat Rev Cancer. 2004;4:133–142. doi: 10.1038/nrc1273. [DOI] [PubMed] [Google Scholar]
- 9.Weissman B, Knudsen KE. Hijacking the chromatin remodeling machinery: impact of SWI/SNF perturbations in cancer. Cancer Res. 2009;69:8223–8230. doi: 10.1158/0008-5472.CAN-09-2166. [DOI] [PMC free article] [PubMed] [Google Scholar]
- 10.Wu JI, Lessard J, Crabtree GR. Understanding the words of chromatin regulation. Cell. 2009;136:200–206. doi: 10.1016/j.cell.2009.01.009. [DOI] [PMC free article] [PubMed] [Google Scholar]
- 11.Goodrich LV, Johnson RL, Milenkovic L, McMahon JA, Scott MP. Conservation of the hedgehog/patched signaling pathway from flies to mice: induction of a mouse patched gene by Hedgehog. Genes Dev. 1996;10:301–312. doi: 10.1101/gad.10.3.301. [DOI] [PubMed] [Google Scholar]
- 12.Lee J, Platt KA, Censullo P, Ruiz i Altaba A. Gli1 is a target of Sonic hedgehog that induces ventral neural tube development. Development. 1997;124:2537–2552. doi: 10.1242/dev.124.13.2537. [DOI] [PubMed] [Google Scholar]
- 13.Isakoff MS, et al. Inactivation of the Snf5 tumor suppressor stimulates cell cycle progression and cooperates with p53 loss in oncogenic transformation. Proc Natl Acad Sci USA. 2005;102:17745–17750. doi: 10.1073/pnas.0509014102. [DOI] [PMC free article] [PubMed] [Google Scholar]
- 14.Logan M, et al. Expression of Cre recombinase in the developing mouse limb bud driven by a Prxl enhancer. Genesis. 2002;33:77–80. doi: 10.1002/gene.10092. [DOI] [PubMed] [Google Scholar]
- 15.Martin JF, Olson EN. Identification of a prx1 limb enhancer. Genesis. 2000;26:225–229. [PubMed] [Google Scholar]
- 16.Theil T, Kaesler S, Grotewold L, Bose J, Ruther U. Gli genes and limb development. Cell Tissue Res. 1999;296:75–83. doi: 10.1007/s004410051268. [DOI] [PubMed] [Google Scholar]
- 17.Wang X, et al. Oncogenesis caused by loss of the SNF5 tumor suppressor is dependent on activity of BRG1, the ATPase of the SWI/SNF chromatin remodeling complex. Cancer Res. 2009;69:8094–8101. doi: 10.1158/0008-5472.CAN-09-0733. [DOI] [PMC free article] [PubMed] [Google Scholar]
- 18.Biegel JA, et al. Germ-line and acquired mutations of INI1 in atypical teratoid and rhabdoid tumors. Cancer Res. 1999;59:74–79. [PubMed] [Google Scholar]
- 19.Sévenet N, et al. Constitutional mutations of the hSNF5/INI1 gene predispose to a variety of cancers. Am J Hum Genet. 1999;65:1342–1348. doi: 10.1086/302639. [DOI] [PMC free article] [PubMed] [Google Scholar]
- 20.Versteege I, et al. Truncating mutations of hSNF5/INI1 in aggressive paediatric cancer. Nature. 1998;394:203–206. doi: 10.1038/28212. [DOI] [PubMed] [Google Scholar]
- 21.McKenna ES, et al. Loss of the epigenetic tumor suppressor SNF5 leads to cancer without genomic instability. Mol Cell Biol. 2008;28:6223–6233. doi: 10.1128/MCB.00658-08. [DOI] [PMC free article] [PubMed] [Google Scholar]
- 22.McKenna ES, Roberts CW. Epigenetics and cancer without genomic instability. Cell Cycle. 2009;8:23–26. doi: 10.4161/cc.8.1.7290. [DOI] [PubMed] [Google Scholar]
- 23.Pomeroy SL, et al. Prediction of central nervous system embryonal tumour outcome based on gene expression. Nature. 2002;415:436–442. doi: 10.1038/415436a. [DOI] [PubMed] [Google Scholar]
- 24.Wisniewski D, et al. Characterization of potent inhibitors of the Bcr-Abl and the c-kit receptor tyrosine kinases. Cancer Res. 2002;62:4244–4255. [PubMed] [Google Scholar]
- 25.Hyman JM, et al. Small-molecule inhibitors reveal multiple strategies for Hedgehog pathway blockade. Proc Natl Acad Sci USA. 2009;106:14132–14137. doi: 10.1073/pnas.0907134106. [DOI] [PMC free article] [PubMed] [Google Scholar]
- 26.Pan S, et al. Discovery of NVP-LDE225, a potent and selective smoothened antagonist. ACS Med Chem Lett. 2010;1:130–134. doi: 10.1021/ml1000307. [DOI] [PMC free article] [PubMed] [Google Scholar]
- 27.Chai J, Charboneau AL, Betz BL, Weissman BE. Loss of the hSNF5 gene concomitantly inactivates p21CIP/WAF1 and p16INK4a activity associated with replicative senescence in A204 rhabdoid tumor cells. Cancer Res. 2005;65:10192–10198. doi: 10.1158/0008-5472.CAN-05-1896. [DOI] [PubMed] [Google Scholar]
- 28.Lee D, et al. SWI/SNF complex interacts with tumor suppressor p53 and is necessary for the activation of p53-mediated transcription. J Biol Chem. 2002;277:22330–22337. doi: 10.1074/jbc.M111987200. [DOI] [PubMed] [Google Scholar]
- 29.Nagl NG, Jr, Zweitzig DR, Thimmapaya B, Beck GR, Jr, Moran E. The c-myc gene is a direct target of mammalian SWI/SNF-related complexes during differentiation-associated cell cycle arrest. Cancer Res. 2006;66:1289–1293. doi: 10.1158/0008-5472.CAN-05-3427. [DOI] [PubMed] [Google Scholar]
- 30.Tsikitis M, Zhang Z, Edelman W, Zagzag D, Kalpana GV. Genetic ablation of cyclin D1 abrogates genesis of rhabdoid tumors resulting from Ini1 loss. Proc Natl Acad Sci USA. 2005;102:12129–12134. doi: 10.1073/pnas.0505300102. [DOI] [PMC free article] [PubMed] [Google Scholar]
- 31.Rudin CM, et al. Treatment of medulloblastoma with hedgehog pathway inhibitor GDC-0449. N Engl J Med. 2009;361:1173–1178. doi: 10.1056/NEJMoa0902903. [DOI] [PMC free article] [PubMed] [Google Scholar]
- 32.Bouwmeester T, et al. A physical and functional map of the human TNF-α/NF-κB signal transduction pathway. Nat Cell Biol. 2004;6:97–105. doi: 10.1038/ncb1086. [DOI] [PubMed] [Google Scholar]
- 33.Frank-Kamenetsky M, et al. Small-molecule modulators of Hedgehog signaling: identification and characterization of Smoothened agonists and antagonists. J Biol. 2002;1:10. doi: 10.1186/1475-4924-1-10. [DOI] [PMC free article] [PubMed] [Google Scholar]
- 34.Turner FB, Cheung WL, Cheung P. Chromatin immunoprecipitation assay for mammalian tissues. Methods Mol Biol. 2006;325:261–272. doi: 10.1385/1-59745-005-7:261. [DOI] [PubMed] [Google Scholar]
- 35.Roberts CW, Leroux MM, Fleming MD, Orkin SH. Highly penetrant, rapid tumorigenesis through conditional inversion of the tumor suppressor gene Snf5. Cancer Cell. 2002;2:415–425. doi: 10.1016/s1535-6108(02)00185-x. [DOI] [PubMed] [Google Scholar]
- 36.Riddle RD, Johnson RL, Laufer E, Tabin C. Sonic hedgehog mediates the polarizing activity of the ZPA. Cell. 1993;75:1401–1416. doi: 10.1016/0092-8674(93)90626-2. [DOI] [PubMed] [Google Scholar]
- 37.Irizarry RA, et al. Exploration, normalization, and summaries of high density oligonucleotide array probe level data. Biostatistics. 2003;4:249–264. doi: 10.1093/biostatistics/4.2.249. [DOI] [PubMed] [Google Scholar]
- 38.Barbie DA, et al. Systematic RNA interference reveals that oncogenic KRAS-driven cancers require TBK1. Nature. 2009;462:108–112. doi: 10.1038/nature08460. [DOI] [PMC free article] [PubMed] [Google Scholar]
- 39.Subramanian A, et al. Gene set enrichment analysis: a knowledge-based approach for interpreting genome-wide expression profiles. Proc Natl Acad Sci USA. 2005;102:15545–15550. doi: 10.1073/pnas.0506580102. [DOI] [PMC free article] [PubMed] [Google Scholar]
Associated Data
This section collects any data citations, data availability statements, or supplementary materials included in this article.