Abstract
Background
Platelets are small anucleate cells circulating in the blood vessels where they play a key role in hemostasis and thrombosis. Here, we compared platelet RNA-Seq results obtained from polyA+ mRNA and rRNA-depleted total RNA.
Materials and Methods
We used purified, CD45 depleted, human blood platelets collected by apheresis from three male and one female healthy blood donors. The Illumina HiSeq 2000 platform was employed to sequence cDNA converted either from oligo(dT) isolated polyA+ RNA or from rRNA-depleted total RNA. The reads were aligned to the GRCh37 reference assembly with the TopHat/Cufflinks alignment package using Ensembl annotations. A de novo assembly of the platelet transcriptome using the Trinity software package and RSEM was also performed. The bioinformatic tools HTSeq and DESeq from Bioconductor were employed for further statistical analyses of read counts.
Results
Consistent with previous findings our data suggests that mitochondrially expressed genes comprise a substantial fraction of the platelet transcriptome. We also identified high transcript levels for protein coding genes related to the cytoskeleton function, chemokine signaling, cell adhesion, aggregation, as well as receptor interaction between cells. Certain transcripts were particularly abundant in platelets compared with other cell and tissue types represented by RNA-Seq data from the Illumina Human Body Map 2.0 project. Irrespective of the different library preparation and sequencing protocols, there was good agreement between samples from the 4 individuals. Eighteen differentially expressed genes were identified in the two sexes at 10% false discovery rate using DESeq.
Conclusion
The present data suggests that platelets may have a unique transcriptome profile characterized by a relative over-expression of mitochondrially encoded genes and also of genomic transcripts related to the cytoskeleton function, chemokine signaling and surface components compared with other cell and tissue types. The in vivo functional significance of the non-mitochondrial transcripts remains to be shown.
Background
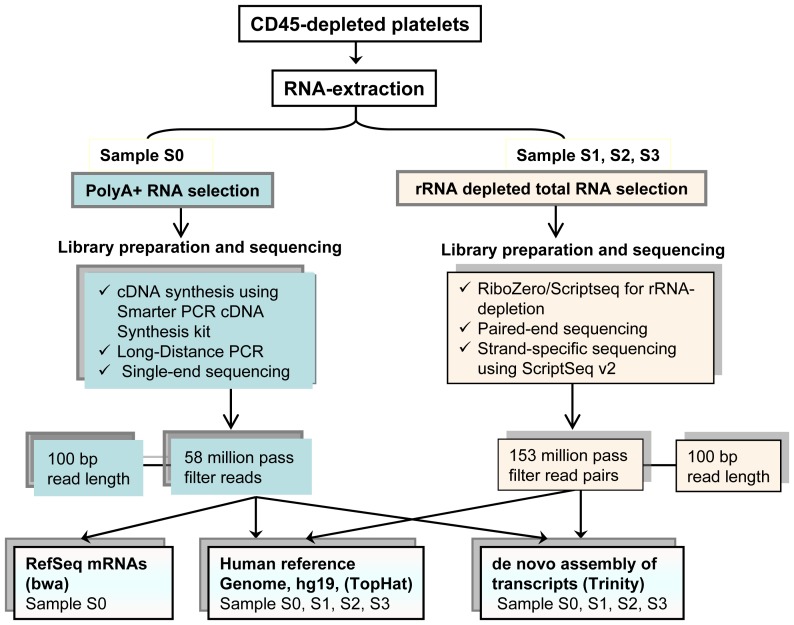
Produced by bone marrow megakaryocytes, platelets are small anucleate elements of the blood that play a pivotal role in hemostasis. They are involved in fibrinolysis and repair of the vessel wall, while circulating in the blood as sentinels of vascular integrity. Platelets lack genomic DNA but retain the ability for protein synthesis from cytoplasmic mRNA [1]. Platelet mRNA was first isolated and converted to a cDNA library more than two decades ago [2]. In recent years, several studies utilizing genome-wide techniques for gene expression profiling, such as microarrays and Serial Analysis of Gene Expression (SAGE) in concert with computer-assisted bioinformatics, have reported that thousands of gene transcripts are present in human platelets [3]–[7]. While microarrays and SAGE have made significant contributions to the characterization of the platelet transcriptome, they also have serious limitations. Hybridization-based approaches rely on probe-target binding of selected sequences and do not detect novel transcripts or unknown genes. In contrast, SAGE uses sequence tags from individual mRNAs and has an advantage over microarrays by detecting unknown genes but does not provide information on splice isoforms and is biased toward short tags, which cannot be uniquely mapped to the human genome [8]. Recently, mass sequencing of transcripts (RNA-Seq) by next generation sequencing (NGS) technologies has emerged as a powerful approach for quantitative transcript discovery [9]–[13]. RNA-Seq has clear advantages over other approaches [14] and shows higher levels of reproducibility for both technical and biological replicates [15]. Two recently published studies used NGS technology to characterize the platelet transcriptome [16]–[17]. One of these used cDNA from poly(dT) isolated mRNA and the other cDNA from ribosomal RNA-depleted total RNA. Both studies used relatively short reads (≤50 base pairs) for alignment to the human genome. In this context, we now report results from both polyA+ mRNA and rRNA-depleted total RNA approaches utilizing 100 bp long sequencing reads for investigating the transcriptional profile of unstimulated human platelets (Fig. 1). We have also for the first time applied a de novo assembly of platelet transcripts to confirm the reference-guided alignments. We believe that our data may provide important clues for understanding the elusive platelet transcriptome and its role in the coagulation system and hemostasis.
Figure 1. Schematic presentation of experimental plan used in this study.
Samples from 4 platelet donors were investigated. One sample (S0) was used for isolation of polyA+ transcripts. The 3 other samples (S1, S2, and S3) were used for analysis of total RNA after depletion of ribosomal RNA (rRNA).
Results
Mapping of polyA+ mRNA (Sample S0)
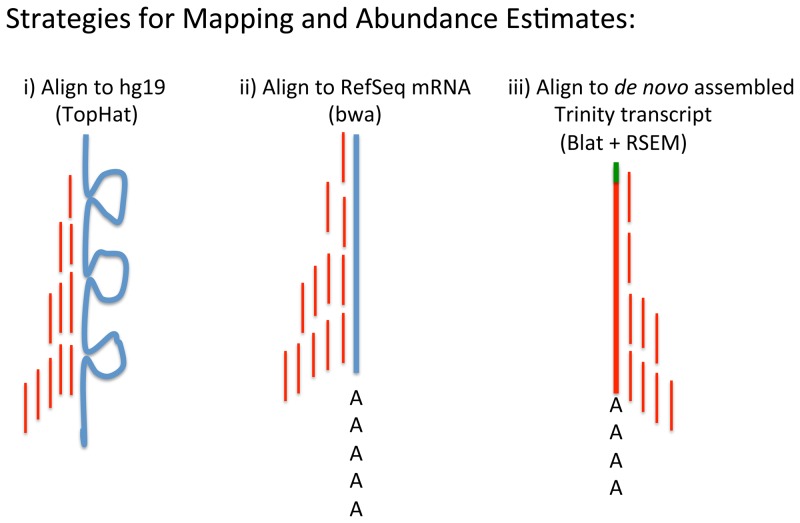
We tried three mapping strategies for polyA+ mRNA (Fig. 2).
Figure 2. Mapping strategies and abundance estimates.
i) Alignment of reads (short red lines) to the human reference genome hg19 (thick blue line) using the TopHat program that aligns RNA-Seq reads to the genome while also attending to splice junction reads. Abundance estimates obtained by counting the number of reads that map within the coordinates defining the corresponding gene with RefSeq annotations; ii) Alignment of reads (short red lines) to human reference (RefSeq) mRNA (thick blue line with polyA tail) using the bwa software for abundance estimates; iii) Alignment of reads (short red lines) to a de novo assembled transcript reported by Trinity (thick red line with polyA tail and green SMARTer IIA oligonucleotide as 5′-leader sequence) using Blat for identification and RSEM for abundance estimates.
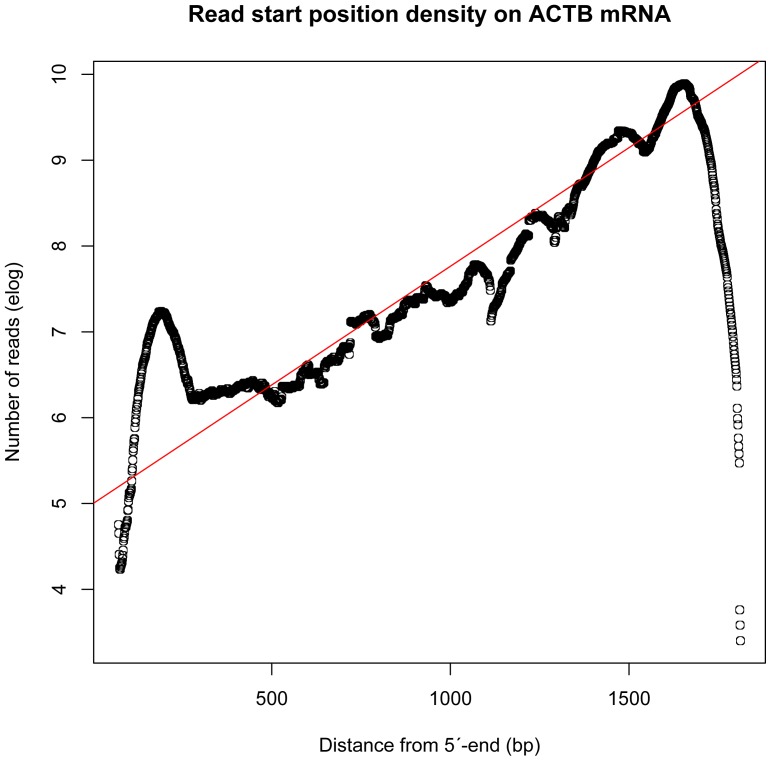
First, the 58,155,680 cleaned sequenced single-end reads with no strand-specificity were mapped to the human reference genome (GRCh37/hg19) using TopHat software (http://tophat.cbcb.umd.edu/) in order to identify exon-exon splice junctions (Fig. 2 i). This resulted in 35,322,009 (60.7%) of uniquely mapped ∼100 bp long single-end reads. The aligned sequencing reads and the Homo_sapiens.GRCh37.71.gtf features were used to estimate the coverage of known genes and transcripts with the aid of bedtools-2.17.0 (http://code.google.com/p/bedtools/). A strong bias towards the 3′-UTR end of transcripts was clearly evident, which can be expected due to the library construction involving oligo-dT primed cDNA in the library preparation procedure (Fig. 3). The uniquely mapped read localizations on the different chromosomes are shown in Table 1. Top 30 loci are shown in Table 2. The HTSeq counts are shown in Table S1 in File S1.
Figure 3. Read start position density on ACTB mRNA.
The horizontal axis shows the distance in nucleotides (bp) from the 5′-end of ACTB mRNA, and the vertical axis shows the natural logarithm of the number of uniquely mapped reads. The fitted red line calculated over the transcript body ignoring both ends corresponds to exponential decay of approximately 50% per 250 bp upstreams fom the polyA-site in the 3′-UTR. Correlation coefficient: 0.93, Slope: 0.0027638, Std error: 0.0002751, t value: -10.05, p-value: 4.70e-08 ***. (Statistics and graph generated by the R-program).
Table 1. Distribution of mapped reads for samples S0, S1, S2 and S3.
| Transcript info | No. Mapped reads per sample | ||||
| Chr | Length (bp) | S0 | S1 | S2 | S3 |
| 1 | 249250621 | 1417879 | 5604828 | 6082062 | 5836619 |
| 2 | 243199373 | 839205 | 4828700 | 4942088 | 5293788 |
| 3 | 198022430 | 376751 | 4053306 | 3561770 | 5497609 |
| 4 | 191154276 | 1574321 | 5304616 | 5313861 | 8582878 |
| 5 | 180915260 | 987877 | 2476361 | 2751025 | 2864982 |
| 6 | 171115067 | 510420 | 3116547 | 3325548 | 3279675 |
| 7 | 159138663 | 534153 | 2881230 | 2900407 | 3260889 |
| 8 | 146364022 | 202649 | 1788536 | 1718024 | 1966160 |
| 9 | 141213431 | 182805 | 2898002 | 2193803 | 4043810 |
| 10 | 135534747 | 228845 | 2687946 | 2569453 | 2952239 |
| 11 | 135006516 | 915079 | 2259841 | 1890737 | 2206632 |
| 12 | 133851895 | 396073 | 2337950 | 2332903 | 2698125 |
| 13 | 115169878 | 733311 | 1026903 | 1066507 | 1135743 |
| 14 | 107349540 | 165457 | 6691970 | 4061007 | 12098431 |
| 15 | 102531392 | 1039909 | 5280432 | 5780695 | 5035062 |
| 16 | 90354753 | 168779 | 946256 | 807193 | 892257 |
| 17 | 81195210 | 440380 | 1934478 | 1881603 | 2076841 |
| 18 | 78077248 | 92840 | 1184820 | 1263978 | 1233671 |
| 19 | 59128983 | 257403 | 860224 | 632489 | 900418 |
| 20 | 63025520 | 425316 | 1327116 | 1295269 | 1404632 |
| 21 | 48129895 | 92487 | 741307 | 599255 | 624149 |
| 22 | 51304566 | 148511 | 750870 | 567420 | 726189 |
| X | 155270560 | 1153342 | 7951615 | 6776104 | 6929134 |
| Y | 59373566 | 21311 | 51658 | 4949 | 50979 |
| MT | 16569 | 22416906 | 6781716 | 9016861 | 7198049 |
| Sum: | 35322009 | 76000000 | 73335011 | 88788961 | |
Table 2. TopHat alignment of PolyA + mRNA to genome.
| Ensembl id. | Gene | Locus | NRC* | Rank |
| ENSG00000210082 | MT-RNR2 | MT:1671–3229 | 10000000 | MT |
| ENSG00000211459 | MT-RNR1 | MT:648–1601 | 5000000 | MT |
| ENSG00000205542 | TMSB4X | X:12993226–12995346 | 1000000 | 1 |
| ENSG00000166710 | B2M | 15:45003674–45011075 | 862880 | 2 |
| ENSG00000198888 | MT-ND1 | MT:3306–4262 | 833782 | MT |
| ENSG00000163736 | PPBP | 4:74852754–74853914 | 555955 | 3 |
| ENSG00000198712 | MT-CO2 | MT:7585–8269 | 534277 | MT |
| ENSG00000163737 | PF4 | 4:74844540–74848796 | 437842 | 4 |
| ENSG00000198763 | MT-ND2 | MT:4469–5511 | 407889 | MT |
| ENSG00000198886 | MT-ND4 | MT:10469–12137 | 355599 | MT |
| ENSG00000198899 | MT-ATP6 | MT:8365–9990 | 303773 | MT |
| ENSG00000198938 | MT-CO3 | MT:8365–9990 | 303743 | MT |
| ENSG00000198786 | MT-ND5 | MT:12336–14148 | 287825 | MT |
| ENSG00000198804 | MT-CO1 | MT:5903–7445 | 282378 | MT |
| ENSG00000198727 | MT-CYB | MT:14746–15887 | 217548 | MT |
| ENSG00000187514 | PTMA | 2:232571605–232578251 | 210648 | 5 |
| ENSG00000161570 | CCL5 | 17:34195970–34212867 | 185274 | 6 |
| ENSG00000228474 | OST4 | 2:27265231–27294641 | 180079 | 7 |
| ENSG00000198695 | MT-ND6 | MT:14148–14673 | 148341 | MT |
| ENSG00000198840 | MT-ND3 | MT:10058–10404 | 105928 | MT |
| ENSG00000212907 | MT-ND4L | MT:10469–12137 | 98894 | MT |
| ENSG00000075624 | ACTB | 7:5566781–5603415 | 91079 | 8 |
| ENSG00000127920 | GNG11 | 7:93220884–93567791 | 85225 | 9 |
| ENSG00000204592 | HLA-E | 6:30457244–30461982 | 82263 | 10 |
| ENSG00000087086 | FTL | 19:49468558–49470135 | 81047 | 11 |
| ENSG00000158710 | TAGLN2 | 1:159887897–159895522 | 77614 | 12 |
| ENSG00000120885 | CLU | 8:27454434–27472548 | 72310 | 13 |
| ENSG00000168497 | SDPR | 2:192699027–193060435 | 71863 | 14 |
| ENSG00000150681 | RGS18 | 1:192127586–192154945 | 65222 | 15 |
| ENSG00000163041 | H3F3A | 1:226249552–226259702 | 63326 | 16 |
*NRC = Normalized Read Counts calculated from transcript length (x) as NRC = read_count*(1+e-0.0027638x).
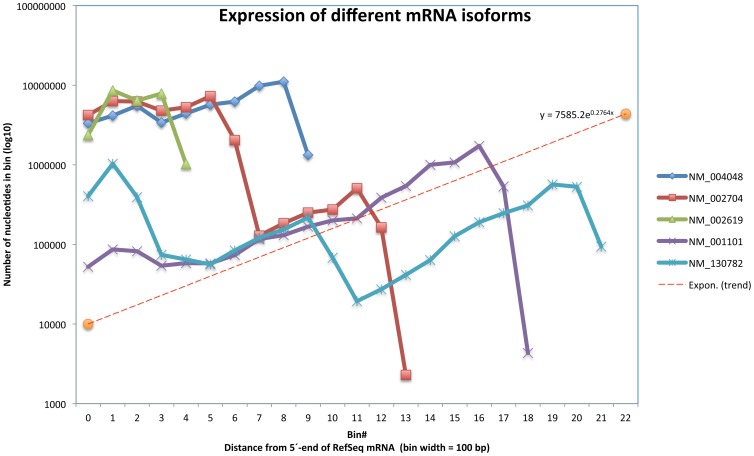
Second, to check the quality of the TopHat alignments the reads were also mapped against RefSeq mRNAs (Fig. 2 ii) using bwa (http://bio-bwa.sourceforge.net/) and samtools (http://samtools.sourceforge.net/) giving similar results (data not shown). PolyA-sites and the expression level of individual transcripts were visualized by plotting log coverage against the distance from the 5′-end of the RefSeq mRNA sequences (Fig. 4). Additional data is shown in Table S2 in File S1.
Figure 4. Mapping of S0 (poly(dT) selected transcripts) against RefSeq mRNA.
The horizontal axis shows the distance in nucleotides from the 5′-end of the transcript (bin length = 100 bp), and the vertical logarithmic axis shows the sum of uniquely mapped reads to each position of the bin. The slope of the dotted line corresponds to the exponential decay function derived in Fig. 3. The sudden “drops” correspond to polyA-sites. As seen in the figure NM_002704 (PPBP) has two polyA-sites which correspond to the known polyA-sites at positions 708 and 1307, respectively. The abundance of the longer PPBP transcript appears to be hundred-fold lower than that of the shorter transcript.
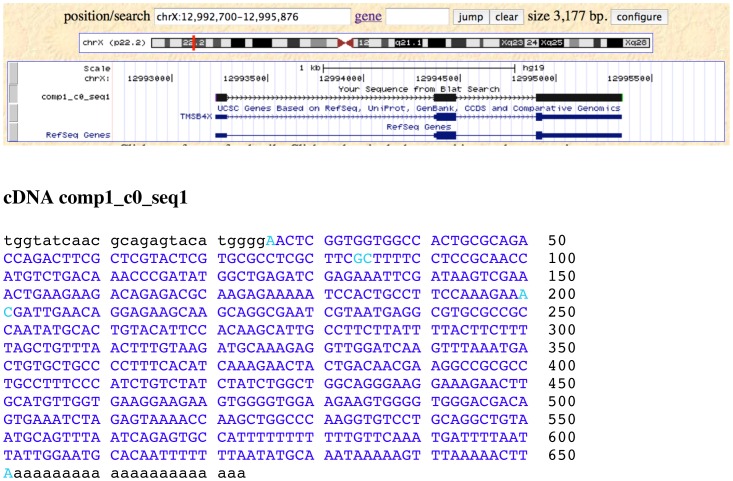
Finally, a detailed analysis of transcripts and assignment of mRNA isoforms was performed by de novo assembly of transcripts using Trinity RNA-Seq software from (http://trinityrnaseq.sourceforge.net/) followed by quantification of transcripts with RSEM (RNA-Seq by Expectation-Maximization) (Fig. 2 iii). Identification of the de novo assembled transcripts was achieved by Blat and BLAST searches using the UCSC Browser and the NCBI Genome databases, respectively. Table 3a shows the Top 25 out of 9077 reported de novo assembled polyA+ genomic transcripts with identification to locus; excluding the mitochondrial genome for clarity. Full-length transcripts could be identified by the presence of a SMARTer IIA 5′-leader sequence and a 3′-end polyA tail (Fig 5). The magnitude of expression of de novo assembled polyA+ transcripts correlated well (Spearman's rho = 0.83) with the length normalized coverage by TopHat alignment of polyA+ cDNA reads to the human genome (compare Tables 2 and 3a).
Table 3. de novo assembly of platelet transcripts.
| Table 3a. Trinity/RSEM | Table 3b. Trinity/RSEM | ||||||||
| de novo assembly of PolyA+ mRNA transcripts (MT-RNA excluded) | de novo assembly of rRNA-depleted total RNA transcripts (MT-RNA excluded) | ||||||||
| Rank | Gene | Length | FPKM¶ | NRC* | Rank§ | Gene | Length_mean | FPKM¶ _mean | FPKM_sd |
| 1 | TMSB4X | 673 | 67846 | 1399035 | ncrna | 7SLRNA | 349 | 295364 | 120832 |
| 2 | B2M | 992 | 28110 | 827815 | 1 | TMSB4X | 646 | 145005 | 15806 |
| 3 | PPBP | 1789 | 10067 | 524473 | 2 | B2M | 990 | 64093 | 8783 |
| 4 | PF4 | 1035 | 13004 | 398344 | 3 | PPBP | 2296 | 22402 | 12048 |
| 5 | OST4 | 470 | 19998 | 291396 | ncrna | 7SK-RNA | 330 | 9981 | 2495 |
| 6 | CCL5 | 777 | 6289 | 148021 | ncrna | LSU-rRNA | 1032 | 8029 | 6510 |
| 7 | FTH1 | 961 | 5068 | 144939 | 4 | FTH1 | 955 | 8008 | 1385 |
| 8 | SERF2 | 598 | 6988 | 129001 | ncrna | RNA45S5 | 307 | 6586 | 4582 |
| 9 | PTMA | 1036 | 4101 | 125730 | 5 | PF4 | 1201 | 6367 | 3351 |
| 10 | H3F3B | 1087 | 3849 | 123435 | 6 | SMARCA5 | 510 | 5991 | 1417 |
| 11 | SH3BGRL3 | 781 | 4037 | 95446 | 7 | OST4 | 492 | 5765 | 1800 |
| 12 | ACTB | 974 | 3058 | 88556 | 8 | PF4V1 | 530 | 3609 | 505 |
| 13 | FTL | 914 | 3053 | 83361 | 9 | C21orf7 | 1527 | 3207 | 912 |
| 14 | TAGLN2 | 1414 | 1866 | 76941 | 10 | ACTB | 1680 | 2991 | 637 |
| 15 | GNG11 | 876 | 2804 | 73644 | 11 | MYL6 | 700 | 2705 | 678 |
| 16 | PTMA | 320 | 6581 | 62019 | 12 | CCL5 | 777 | 2569 | 370 |
| 17 | RGS18 | 4238 | 485 | 61271 | 13 | GNG11 | 1004 | 2493 | 1019 |
| 18 | C21orf7 | 1518 | 1341 | 59276 | 14 | HSMAR1 | 1756 | 2456 | 344 |
| 19 | SDPR | 2554 | 774 | 58065 | 15 | RGS18 | 4443 | 2432 | 160 |
| 20 | TUBB1 | 3109 | 612 | 56270 | 16 | H3F3A | 588 | 2370 | 736 |
| 21 | MYL6 | 696 | 2509 | 53370 | 17 | HIST1H2AC | 1744 | 2280 | 424 |
| 22 | CLU | 1769 | 939 | 48350 | 18 | MYL12A | 1316 | 2278 | 552 |
| 23 | HLA-E | 1492 | 1025 | 44539 | 19 | EFCAB13 | 608 | 2234 | 704 |
| 24 | GPX1 | 907 | 1301 | 35274 | 20 | MORC3 | 714 | 2225 | 834 |
| 25 | RGS10 | 1001 | 1136 | 33743 | 21 | PTMA | 1232 | 2179 | 667 |
Fragments Per Kilobase of transcript per Million mapped reads.
*NRC = Normalized Read Count calculated from transcript length (x) as NRC = read_count*(1+e-0.0027638x).
Ranking of protein coding transcripts only.
Figure 5. Snapshot of UCSC Browser Blat alignment of de novo assembled transcript variant comp1_c0_seq1 mapping to TMSB4X.
The 5′-leader sequence matches the SMARTer IIA oligonucleotide. The Trinity de novo assembled nucleotide sequence is identical to the GRCh37/hg19 reference. Part of the polyA tail is also included. Splice junctions are marked in turquoise.
Mapping of rRNA-depleted total RNA (Samples S1, S2 and S3)
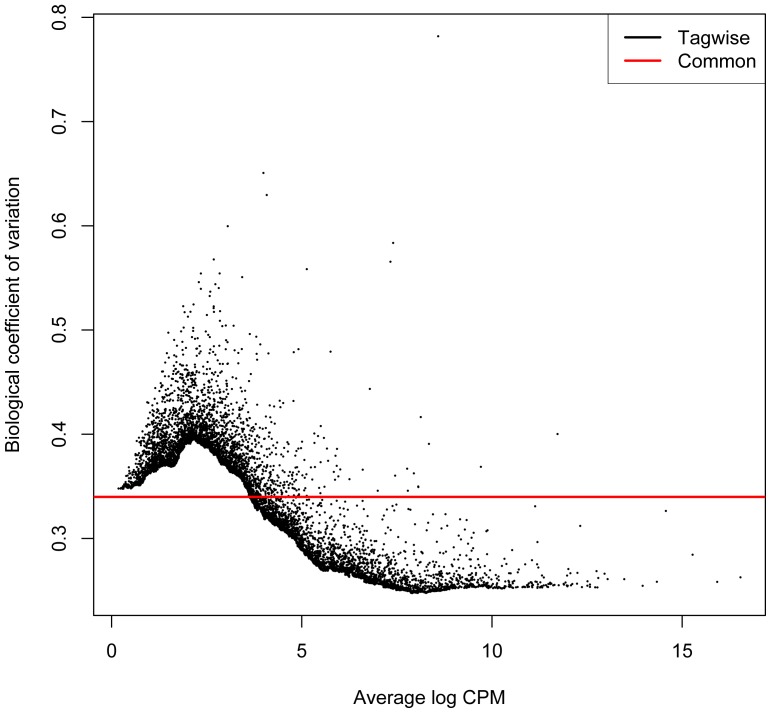
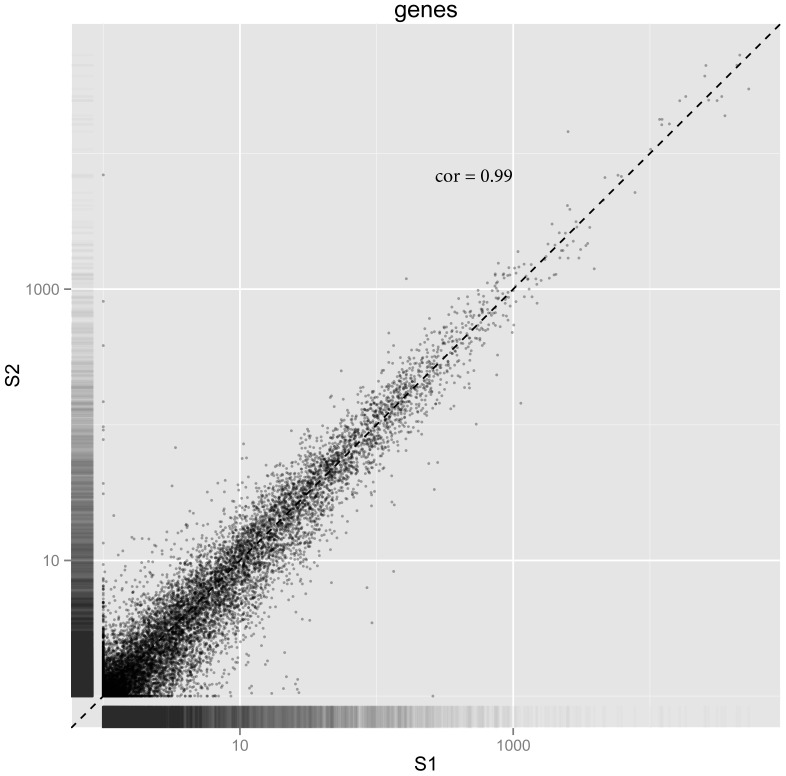
The three barcoded rRNA-depleted total RNA libraries (S1,S2 and S3) resulted in 153 million pass filter strand-specific read pairs (QC data in Fig. S1 in File S1) which were mapped to the human reference genome (GRCh37/hg19) using TopHat. The uniquely mapped read localizations on the different chromosomes are shown in Table 1. The aligned sequencing reads were assigned to the Homo_sapiens.GRCh37.71.gtf features as described above. Top 30 loci are shown in Table 4. A full table of HTSeq counts is presented in Table S1 in File S1. The biological coefficient of variation as estimated by the edgeR software (http://www.bioconductor.org/) is shown in figure 6. There was a linear dependence between FPKM (Fragments Per Kilobase of transcript per Million mapped reads)-values in samples S1, S2 and S3. Figure 7 shows a pair-wise comparison of S1 (male) and S2 (female) rendering a Pearson's correlation coefficient of 0.99. These results were confirmed by de novo assembly using the Trinity software (Table 3b).
Table 4. TopHat/Cufflinks alignment of rRNA-depleted total RNA to genome (excluding ncrna).
| Ensembl id. | Gene | Locus | S1_FPKM¶ | S2_FPKM¶ | S3_FPKM¶ | Rank |
| ENSG00000205542 | TMSB4X | X:12993226–12995346 | 34973 | 28506 | 46120 | 1 |
| ENSG00000163736 | PPBP | 4:74852754–74853914 | 25489 | 23607 | 37832 | 2 |
| ENSG00000198804 | MT-CO1 | MT:5903–7445 | 23594 | 35045 | 27213 | MT |
| ENSG00000198888 | MT-ND1 | MT:3306–4262 | 17087 | 24640 | 18055 | MT |
| ENSG00000198938 | MT-CO3 | MT:8365–9990 | 16415 | 22715 | 15566 | MT |
| ENSG00000198840 | MT-ND3 | MT:10058–10404 | 15273 | 22805 | 14332 | MT |
| ENSG00000198886 | MT-ND4 | MT:10469–12137 | 14039 | 22467 | 9924 | MT |
| ENSG00000198899 | MT-ATP6 | MT:8365–9990 | 12643 | 15608 | 11442 | MT |
| ENSG00000198727 | MT-CYB | MT:14746–15887 | 13017 | 15645 | 10847 | MT |
| ENSG00000166710 | B2M | 15:45003674–45011075 | 9394 | 11022 | 16484 | 3 |
| ENSG00000212907 | MT-ND4L | MT:10469–12137 | 9394 | 18469 | 8991 | MT |
| ENSG00000198786 | MT-ND5 | MT:12336–14148 | 10900 | 16518 | 8191 | MT |
| ENSG00000198712 | MT-CO2 | MT:7585–8269 | 11460 | 15423 | 8156 | MT |
| ENSG00000198763 | MT-ND2 | MT:4469–5511 | 11304 | 16506 | 6650 | MT |
| ENSG00000228253 | MT-ATP8 | MT:8365–9990 | 12611 | 10792 | 9831 | MT |
| ENSG00000163737 | PF4 | 4:74844540–74848796 | 5352 | 5933 | 9990 | 4 |
| ENSG00000228474 | OST4 | 2:27265231–27294641 | 7326 | 4882 | 6268 | 5 |
| ENSG00000180573 | HIST1H2AC | 6:26124372–26139344 | 5539 | 6458 | 3635 | 6 |
| ENSG00000150681 | RGS18 | 1:192127586–192154945 | 4310 | 6219 | 2841 | 7 |
| ENSG00000075624 | ACTB | 7:5566781–5603415 | 3375 | 2548 | 3199 | 8 |
| ENSG00000167996 | FTH1 | 11:61717292–61735132 | 3044 | 2459 | 2413 | 9 |
| ENSG00000198695 | MT-ND6 | MT:14148–14673 | 2741 | 3190 | 1528 | MT |
| ENSG00000127920 | GNG11 | 7:93220884–93567791 | 2369 | 1585 | 2850 | 10 |
| ENSG00000168497 | SDPR | 2:192699027–193060435 | 1809 | 2832 | 2040 | 11 |
| ENSG00000154146 | NRGN | 11:124609809–124636392 | 2807 | 1574 | 2154 | 12 |
| ENSG00000101608 | MYL12A | 18:3247478–3261848 | 2719 | 1959 | 1755 | 13 |
| ENSG00000180596 | HIST1H2BC | 6:26115100–26124154 | 2897 | 1822 | 1525 | 14 |
| ENSG00000104904 | OAZ1 | 19:2252251–2273487 | 2003 | 1762 | 1954 | 15 |
| ENSG00000163041 | H3F3A | 1:226249551–226259702 | 1910 | 1233 | 1314 | 16 |
| ENSG00000161570 | CCL5 | 17:34195970–34212867 | 1437 | 1760 | 1236 | 17 |
Fragments Per Kilobase of transcript per Million mapped reads.
Figure 6. Biological coefficient of variation of samples S1, S2 and S3 as estimated by TopHat/HTSeq/edgeR software.
As expected the more highly expressed genes show much lower dispersion estimates than the mean value. “CPM” represents counts per million.
Figure 7. Plot showing the magnitude of FPKM gene expression in rRNA-depleted total RNA in pair-wise comparisons between sample S1 and sample S2.
Each dot represents a S1/S2 pair for a gene that had detectable expression in both samples. Pearson's correlation coefficient = 0.99. (TopHat/Cufflinks/Cuffdiff/CummeRbund software).
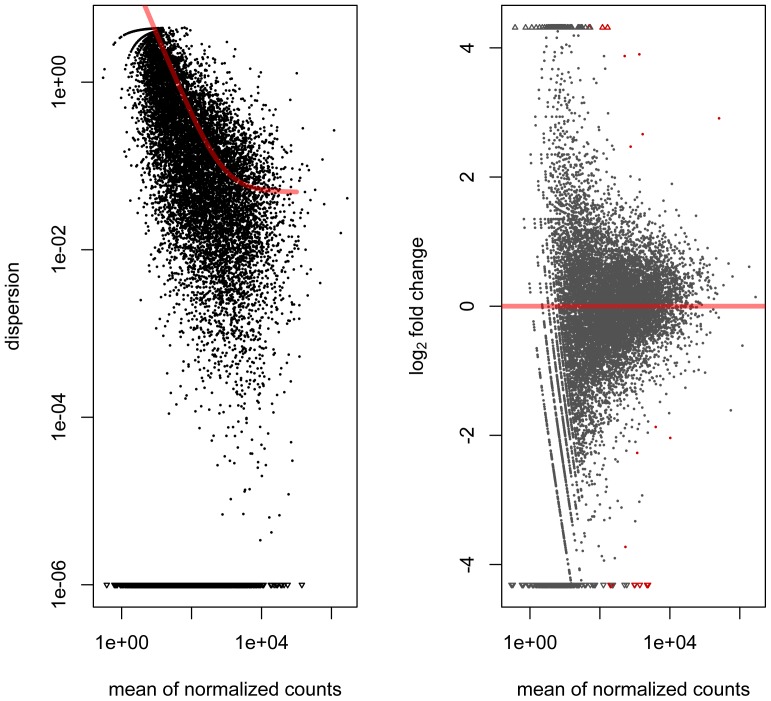
Further analyses to reveal differential expression (DE) were performed with Cufflinks and the bioinformatic tools HTseq and DESeq from Bioconductor (http://www.bioconductor.org/), which uses the R statistical programming language. Figure 8 shows dispersion and log2 fold change when comparing the two male samples S1 and S3 with the female sample S2 using DESeq. Eighteen differentially expressed genes were identified between the two sexes at 10% false discovery rate (FDR) using DESeq (Fig. 8, red dots). Not all of these genes were located on the Y chromosome (Table 5.).
Figure 8. Graphs showing the dispersion and log2 fold change, respectively, when comparing the two male samples S1 and S3 with the female sample S2 using DESeq.
The “dispersion” on the y-axis in the left-hand plot represents the square of the coefficient of biological variation, and the red “hockey-stick” line is a fitted curve through the estimates of the dispersion value for each gene. In the right-hand plot, the horizontal red line represents equal expression in male and female samples. Red dots represent differentially expressed genes at 10% FDR, and red triangles represent red dots that lie outside the graph (above or below). The identity of the differentially expressed genes and the corrresponding log2 fold changes can be found in Table 5 (columns 2 and 8, respectively).
Table 5. Significantly differentially expressed genes in male and female platelets at 10% FDR as estimated by DESeq.
| Ensembl id. | gene | locus | baseMean | baseMeanA | baseMeanB | FC* | log2 FC* | pval¶ | padj§ |
| ENSG00000183878 | UTY | Y:15360259–15592553 | 1511.7 | 2265.7 | 3.5 | 0.002 | −9.3 | 7.6E-27 | 1.4E-22 |
| ENSG00000198692 | EIF1AY | Y:22737611–22755040 | 618.0 | 925.3 | 3.5 | 0.004 | −8.0 | 4.4E-19 | 4.0E-15 |
| ENSG00000210082 | MT-RNR2 | MT:1671–3229 | 160159.6 | 50966.7 | 378545.5 | 7.427 | 2.9 | 3.5E-13 | 2.2E-09 |
| ENSG00000116117 | PARD3B | 2:205410516–206484886 | 843.0 | 153.2 | 2222.5 | 14.51 | 3.9 | 1.2E-12 | 5.7E-09 |
| ENSG00000154620 | TMSB4Y | Y:15815447–15817904 | 1407.2 | 2107.9 | 5.6 | 0.003 | −8.5 | 1.9E-12 | 6.9E-09 |
| ENSG00000196565 | HBG2 | 11:5274420–5667019 | 635.7 | 908.0 | 91.0 | 0.100 | −3.3 | 4.1E-10 | 1.3E-06 |
| ENSG00000067048 | DDX3Y | Y:15016019–15032390 | 884.4 | 1323.8 | 5.6 | 0.004 | −7.9 | 1.2E-09 | 3.2E-06 |
| ENSG00000100362 | PVALB | 22:37196728–37215523 | 209.1 | 296.0 | 35.3 | 0.119 | −3.1 | 7.0E-09 | 1.6E-05 |
| ENSG00000113658 | SMAD5 | 5:135468534–135524435 | 1050.2 | 384.3 | 2382.0 | 6.198 | 2.6 | 9.4E-09 | 1.9E-05 |
| ENSG00000135426 | TESPA1 | 12:55341802–55378530 | 321.0 | 59.3 | 844.6 | 14.25 | 3.8 | 1.7E-08 | 3.2E-05 |
| ENSG00000077984 | CST7 | 20:24929866–24940564 | 140.5 | 208.9 | 3.5 | 0.017 | −5.9 | 2.6E-08 | 4.4E-05 |
| ENSG00000118946 | PCDH17 | 13:58205944–58303445 | 74.2 | 0.88 | 220.8 | 251.4 | 8.0 | 6.0E-07 | 9.2E-04 |
| ENSG00000248527 | MTATP6P1 | 1:569076–569756 | 7122.7 | 3712.0 | 13944.1 | 3.756 | 1.9 | 1.2E-06 | 1.7E-03 |
| ENSG00000012817 | KDM5D | Y:21865751–21906825 | 149.8 | 224.4 | 0.71 | 0.003 | −8.3 | 1.5E-06 | 2.0E-03 |
| ENSG00000114374 | USP9Y | Y:14813160–14972764 | 142.5 | 213.4 | 0.71 | 0.003 | −8.2 | 2.4E-06 | 2.9E-03 |
| ENSG00000185736 | ADARB2 | 10:1228073–1779670 | 79.2 | 118.8 | 0.00 | 0.000 | -Inf | 1.53E-05 | 1.7E-02 |
| ENSG00000229308 | AC010084.1 | Y:3904538–3968361 | 340.5 | 492.35 | 36.7 | 0.075 | −3.75 | 1.47E-05 | 1.7E-02 |
| ENSG00000240356 | RPL23AP7 | 2:114368079–114384667 | 6531.0 | 8750.85 | 2091.0 | 0.239 | −2.07 | 1.62E-05 | 1.7E-02 |
*Fold change;
P-value;
Adjusted P-value.
Differential expression at the gene level in polyA + mRNA vs total RNA
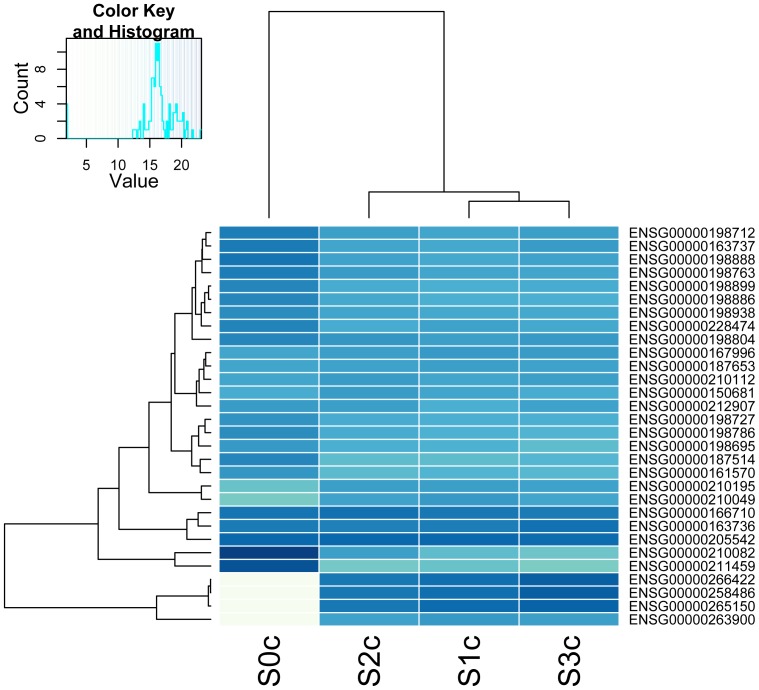
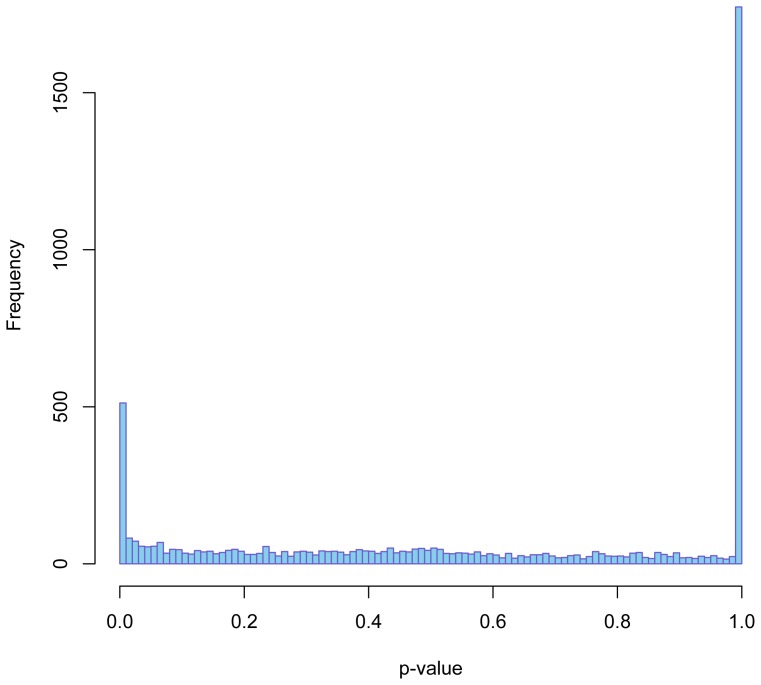
Gene expression levels in total RNA samples are conventionally measured as RPKM (Reads Per Kilobase of transcript per Million mapped reads) or FPKM values assuming a rectangular distribution of reads covering the transcript coordinates, i.e. these measures are proportional to the number of reads divided by transcript lengths. The distribution of reads covering the transcript coordinates using oligo(dT) isolated mRNA is very different as it fits an exponential decay function from the 3′-end polyA site towards the 5′-end. (Fig. 3 and Fig. 4). This makes RPKM and FPKM estimates less appropriate for comparison of gene expression levels in polyA + mRNA. Consequently, both transcript lengths and library preparation method ought to be taken into account. Otherwise, false differences will emerge. Adjusted bedcoverage data for the most abundant transcript of each gene is presented in Table S3 in File S1 where columns S0, S1, S2, and S3 represent raw counts and columns S0_adj, and S1_adj to S3_adj represent Normalized Read Counts (NRC) and normalized FPKM figures, respectively (see Table 3a for definition of NRC used in this context). Table 3a demonstrates the fallaciousness of FPKM-values if used on poly(dT) selected transcripts. Figure 9 shows a heatmap of such normalized levels of expression for the 30 most highly expressed genes across the samples from the 4 different patients. Altogether circa 500 differentially expressed genes were identified at 10% FDR comparing mRNA vs. totRNA using DESeq (Fig. 10). A full table of mRNA vs. totRNA comparisons is provided in Table S4 in File S1. As expected, most of this “DE”, which primarily should represent preparation method and mapping artefacts, was observed for non-coding transcripts, which were not present in the polyA+ mRNA preparation, and mitochondrial rRNA transcripts which were more abundant in the polyA+ mRNA sample (Table 6). However, coding transcripts that lack a polyA-tail should also appear as differentially expressed.
Figure 9. Heatmap showing normalized levels of expression for the 30 most highly expressed gene transcripts across mRNA and rRNA-depleted total RNA samples from the 4 different patients.
Nearly all differences of intensity for a given gene are likely to represent preparation artefacts, i.e. due to the poly(dT) enrichment and rRNA-depletion, respectively. Sample names have a ‘C’ added to indicate that the intensities represent length- and method-adjusted counts (TopHat/bedtools/DESeq and “in-house” software).
Figure 10. Histogram of p-values from the call to negative binomial test with DESeq comparing the length- and method-adjusted counts of polyA + mRNA sample S0 with the rRNA-depleted total RNA samples S1, S2 and S3.
Most of the circa 500 remaining significant differences after length- and method-adjusted normalization presumably represent preparation artefacts, i.e. due to the poly(dT) enrichment and rRNA-depletion, respectively. However, protein coding transcripts lacking a polyA-tail should also appear as differentially expressed. Note that omission of the length- and method-adjusted normalization yields a couple of thousand “differentially expressed” genes (TopHat/bedtools/DESeq and “in-house” software).
Table 6. Significant DEφ among the most abundant transcripts in polyA+ mRNA versus rRNA-depleted total RNA.
| Ensembl id. | gene | locus | baseMean | baseMeanA | baseMeanB | FC* | log2 FC* | pval¶ | padj§ |
| ENSG00000210082 | MT-RNR2 | MT:1671–3229∶1 | 16931163 | 66886248 | 279467 | 0.004 | −7.9 | 4.0E-23 | 2.8E-20 |
| ENSG00000266422 | RN7SL593P | 14:50053298–50053594∶1 | 6392989 | 0 | 8523986 | Inf | Inf | 5.7E-09 | 3.1E-07 |
| ENSG00000258486 | RN7SL1 | 14:50053297–50053596∶1 | 6329059 | 0 | 8438746 | Inf | Inf | 5.8E-09 | 3.1E-07 |
| ENSG00000211459 | MT-RNR1 | MT:648–1601∶1 | 6194782 | 24607232 | 57298 | 0.002 | −8.75 | 3.8E-27 | 4.0E-24 |
| ENSG00000265150 | RN7SL2 | 14:50329271–50329567∶−1 | 6165927 | 0 | 8221236 | Inf | Inf | 3.2E-12 | 4.1E-10 |
| ENSG00000198888 | MT-ND1 | MT:3307–4262∶1 | 1690338 | 5336127 | 475075 | 0.089 | −3.5 | 6.8E-06 | 1.9E-04 |
| ENSG00000163737 | PF4 | 4:74846794–74847841∶−1 | 1375290 | 3880989 | 540057 | 0.139 | −2.9 | 1.7E-04 | 3.3E-03 |
| ENSG00000198763 | MT-ND2 | MT:4470–5511∶1 | 1269252 | 3375664 | 567114 | 0.168 | −2.6 | 5.4E-04 | 8.8E-03 |
| ENSG00000198712 | MT-CO2 | MT:7586–8269∶1 | 1191008 | 3025844 | 579396 | 0.191 | −2.4 | 1.3E-03 | 1.8E-02 |
| ENSG00000228474 | OST4 | 2:27293340–27294641∶−1 | 896875 | 2240352 | 449050 | 0.2 | −2.3 | 1.7E-03 | 2.3E-02 |
| ENSG00000198899 | MT-ATP6 | MT:8527–9207∶1 | 770469 | 2046623 | 345084 | 0.169 | −2.6 | 5.8E-04 | 9.4E-03 |
| ENSG00000198886 | MT-ND4 | MT:10760–12137∶1 | 768789 | 2051607 | 341183 | 0.166 | −2.6 | 5.2E-04 | 8.6E-03 |
| ENSG00000198938 | MT-CO3 | MT:9207–9990∶1 | 728578 | 1653616 | 420232 | 0.254 | −2.0 | 6.4E-03 | 6.8E-02 |
| ENSG00000187514 | PTMA | 2:232571605–232578251∶1 | 634893 | 2086609 | 150988 | 0.072 | −3.8 | 1.5E-06 | 5.0E-05 |
| ENSG00000198786 | MT-ND5 | MT:12337–14148∶1 | 605680 | 1589548 | 277724 | 0.175 | −2.5 | 7.2E-04 | 1.1E-02 |
| ENSG00000263900 | AC006483.1 | 7:5567734–5567817∶−1 | 506347 | 0 | 675129 | Inf | Inf | 5.6E-27 | 5.0E-24 |
| ENSG00000210195 | MT-TT | MT:15888–15953∶1 | 466133 | 82374 | 594053 | 7.21 | 2.9 | 1.1E-03 | 1.6E-02 |
| ENSG00000210049 | MT-TF | MT:577–647∶1 | 464726 | 42641 | 605420 | 14.20 | 3.8 | 2.6E-05 | 6.2E-04 |
| ENSG00000161570 | CCL5 | 17:34198495–34207797∶-1 | 392953 | 1050080 | 173911 | 0.166 | −2.6 | 5.5E-04 | 9.0E-03 |
| ENSG00000198695 | MT-ND6 | MT:14149–14673∶−1 | 390765 | 897940 | 221707 | 0.247 | −2.0 | 5.5E-03 | 6.0E-02 |
| ENSG00000209082 | MT-TL1 | MT:3230–3304∶1 | 337949 | 774474 | 192441 | 0.248 | −2.0 | 5.9E-03 | 6.4E-02 |
| ENSG00000140264 | SERF2 | 15:44069285–44094787∶1 | 252646 | 889675 | 40303 | 0.045 | −4.5 | 2.8E-08 | 1.3E-06 |
| ENSG00000156265 | MAP3K7CL | 21:30449792–30548210∶1 | 240370 | 0 | 320494 | Inf | Inf | 1.4E-16 | 3.8E-14 |
| ENSG00000210196 | MT-TP | MT:15956–16023∶−1 | 238130 | 41112 | 303802 | 7.39 | 2.9 | 9.9E-04 | 1.5E-02 |
| ENSG00000087086 | FTL | 19:49468558–49470135∶1 | 167208 | 518399 | 50145 | 0.097 | −3.4 | 1.7E-05 | 4.2E-04 |
| ENSG00000210077 | MT-TV | MT:1602–1670∶1 | 136962 | 329425 | 72807 | 0.221 | −2.2 | 3.3E-03 | 3.9E-02 |
| ENSG00000142669 | SH3BGRL3 | 1:26605667–26608007∶1 | 136382 | 503776 | 13917 | 0.028 | −5.2 | 2.3E-10 | 1.9E-08 |
| ENSG00000169756 | LIMS1 | 2:109150857–109303702∶1 | 124932 | 283811 | 71972 | 0.254 | −2.0 | 7.1E-03 | 7.4E-02 |
| ENSG00000101608 | MYL12A | 18:3247479–3256234∶1 | 122263 | 3261 | 161930 | 49.66 | 5.6 | 2.5E-06 | 7.9E-05 |
| ENSG00000248527 | MTATP6P1 | 1:569076–569756∶1 | 122224 | 401658 | 29079 | 0.072 | −3.8 | 2.0E-06 | 6.2E-05 |
Differential Expression;
*Fold change;
P-value; §Adjusted P-value.
The platelet transcriptome
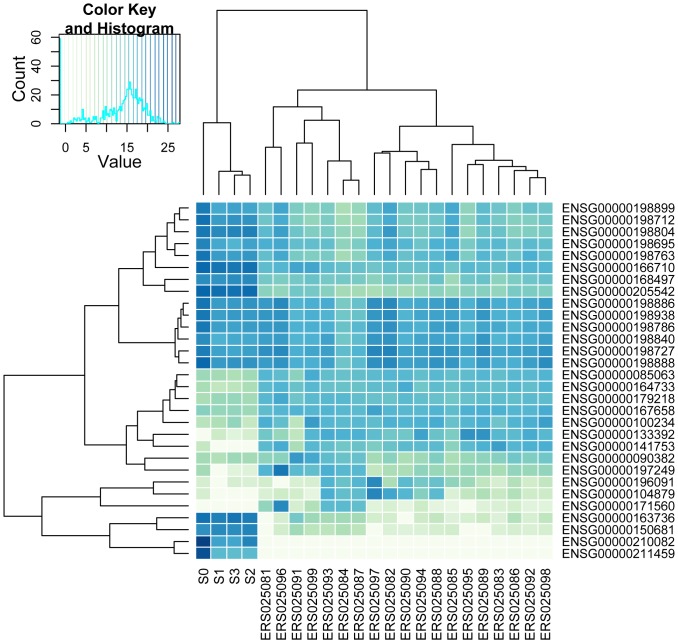
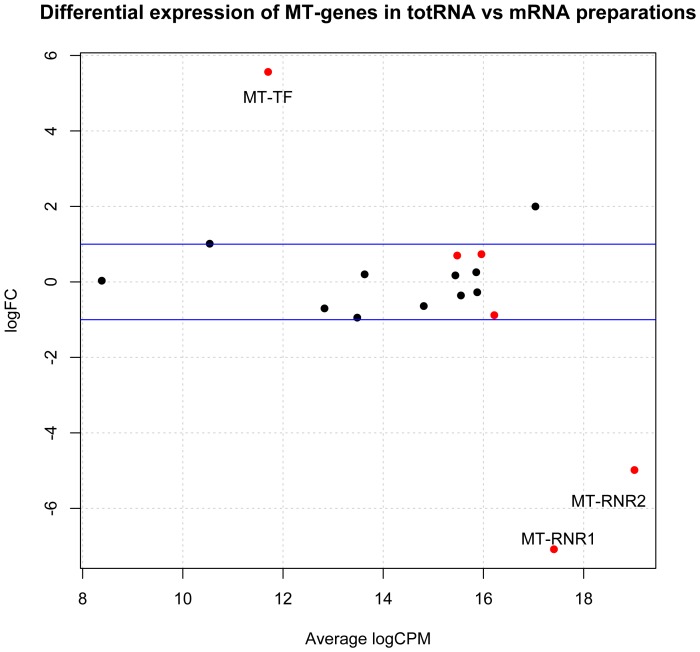
The platelet transcriptome data was then compared with RNASeq data from Illumina's Human BodyMap 2.0 project. The Illumina data, generated on HiSeq 2000 instruments, consists of 16 human tissue types, including adrenal, adipose, brain, breast, colon, heart, kidney, liver, lung, lymph, ovary, prostate, skeletal muscle, testes, thyroid, and white blood cells. The heatmap in figure 11 summarizes expression for this data integrated with the platelet raw data counts obtained with the HTSeq-counts program. The dendrogram at the top clearly shows that the platelet expression profile is unique because the samples S0,S1,S2 and S3 forms a cluster of its own from root level. As expected, the polyA+ mRNA sample S0 profile shows some DE when compared with the rRNA-depleted total RNA samples S1, S2, and S3. Thus, the present data suggests that platelets may have a unique transcriptome profile characterized by a relative over-expression of many mitochondrially encoded genes. Apart from MT-RNR1, MT-RNR2 and MT-TF, mitochondrially encoded gene expression levels were rather similar in totRNA and mRNA preparations (Fig. 12 and Table 7).
Figure 11. The platelet transcriptome data compared with RNASeq data from Illumina's Human BodyMap 2.0 project.
The integrated platelet data from samples S0, S1, S2, and S3 represent counts obtained with TopHat, Ensembl annotations, and the HTSeq-counts program. The Illumina codes are as follows. ERS025098 adipose, ERS025092 adrenal, ERS025085 brain, ERS025088 breast, ERS025089 colon, ERS025082 heart, ERS025081 kidney, ERS025096 liver, ERS025099 lung, ERS025086 lymphnode, ERS025084 mixture, ERS025087 mixture, ERS025093 mixture, ERS025083 ovary, ERS025095 prostate, ERS025097 skeletal_muscle, ERS025094 testes, ERS025090 thyroid, ERS025091 white_blood_cell.
Figure 12. Differential expression of mitochondrial (MT)-genes in total RNA vs mRNA preparations.
The figure shows that apart from MT-RNR1, MT-RNR2 and MT-TF, mitochondrially encoded gene expression levels were rather similar in rRNA-depleted total RNA and polyA + mRNA preparations (TopHat/HTSeq/edgeR software). “FC” denotes fold change whereas “CPM” represents counts per million.
Table 7. Read count table for mitochondrially encoded genes for samples S0, S1, S2 and S3.
| Ensembl id. | gene | locus | length | S0 | S1 | S2 | S3 |
| ENSG00000210049 | MT-TF | MT:577–647∶1 | 71 | 4716 | 72194 | 45984 | 42484 |
| ENSG00000211459 | MT-RNR1 | MT:648–1601∶1 | 954 | 4626427 | 98775 | 54719 | 51139 |
| ENSG00000210077 | MT-TV | MT:1602–1670∶1 | 69 | 36340 | 10399 | 6856 | 1215 |
| ENSG00000210082 | MT-RNR2 | MT:1671–3229∶1 | 1559 | 13296885 | 250572 | 1137529 | 153605 |
| ENSG00000209082 | MT-TL1 | MT:3230–3304∶1 | 75 | 86075 | 20917 | 13706 | 19721 |
| ENSG00000198888 | MT-ND1 | MT:3307–4262∶1 | 956 | 1003620 | 480131 | 557853 | 659073 |
| ENSG00000210100 | MT-TI | MT:4263–4331∶1 | 69 | 19538 | 21026 | 11319 | 7338 |
| ENSG00000210107 | MT-TQ | MT:4329–4400∶−1 | 72 | 26650 | 31551 | 37167 | 27844 |
| ENSG00000210112 | MT-TM | MT:4402–4469∶1 | 68 | 53547 | 40780 | 53844 | 59771 |
| ENSG00000198763 | MT-ND2 | MT:4470–5511∶1 | 1042 | 643951 | 625223 | 928642 | 622441 |
| ENSG00000210117 | MT-TW | MT:5512–5579∶1 | 68 | 7355 | 19999 | 8161 | 3780 |
| ENSG00000210127 | MT-TA | MT:5587–5655∶−1 | 69 | 6825 | 13478 | 5840 | 3956 |
| ENSG00000210135 | MT-TN | MT:5657–5729∶−1 | 73 | 8457 | 11923 | 4449 | 4815 |
| ENSG00000210140 | MT-TC | MT:5761–5826∶−1 | 66 | 12786 | 7746 | 3790 | 3592 |
| ENSG00000210144 | MT-TY | MT:5826–5891∶−1 | 66 | 8401 | 8967 | 4896 | 4065 |
| ENSG00000198804 | MT-CO1 | MT:5904–7445∶1 | 1542 | 414158 | 1257943 | 1669453 | 1633848 |
| ENSG00000210151 | MT-TS1 | MT:7446–7514∶−1 | 69 | 32507 | 12569 | 11010 | 9894 |
| ENSG00000210154 | MT-TD | MT:7518–7585∶1 | 68 | 7787 | 7045 | 6504 | 4022 |
| ENSG00000198712 | MT-CO2 | MT:7586–8269∶1 | 684 | 529645 | 397862 | 485662 | 598293 |
| ENSG00000210156 | MT-TK | MT:8295–8364∶1 | 70 | 16629 | 14388 | 13232 | 15576 |
| ENSG00000228253 | MT-ATP8 | MT:8366–8572∶1 | 207 | 61948 | 66353 | 72109 | 65706 |
| ENSG00000198899 | MT-ATP6 | MT:8527–9207∶1 | 681 | 357851 | 277472 | 294047 | 304636 |
| ENSG00000198938 | MT-CO3 | MT:9207–9990∶1 | 784 | 298920 | 387019 | 407105 | 435081 |
| ENSG00000210164 | MT-TG | MT:9991–10058∶1 | 68 | 6289 | 11269 | 13275 | 11525 |
| ENSG00000198840 | MT-ND3 | MT:10059–10404∶1 | 346 | 86378 | 92634 | 121847 | 146128 |
| ENSG00000210174 | MT-TR | MT:10405–10469∶1 | 65 | 8430 | 11341 | 17249 | 19014 |
| ENSG00000212907 | MT-ND4L | MT:10470–10766∶1 | 297 | 111257 | 118428 | 203231 | 207225 |
| ENSG00000198886 | MT-ND4 | MT:10760–12137∶1 | 1378 | 404373 | 502675 | 664748 | 575461 |
| ENSG00000210176 | MT-TH | MT:12138–12206∶1 | 69 | 10272 | 14951 | 7898 | 7056 |
| ENSG00000210184 | MT-TS2 | MT:12207–12265∶1 | 59 | 8641 | 6673 | 7713 | 13231 |
| ENSG00000210191 | MT-TL2 | MT:12266–12336∶1 | 71 | 8013 | 8112 | 9209 | 12015 |
| ENSG00000198786 | MT-ND5 | MT:12337–14148∶1 | 1812 | 318124 | 585691 | 707224 | 571473 |
| ENSG00000198695 | MT-ND6 | MT:14149–14673∶−1 | 525 | 146565 | 167234 | 175374 | 85557 |
| ENSG00000210194 | MT-TE | MT:14674–14742∶−1 | 69 | 7417 | 14089 | 15081 | 13333 |
| ENSG00000198727 | MT-CYB | MT:14747–15887∶1 | 1141 | 220495 | 447899 | 453336 | 452116 |
| ENSG00000210195 | MT-TT | MT:15888–15953∶1 | 66 | 9053 | 52084 | 45617 | 48793 |
| ENSG00000210196 | MT-TP | MT:15956–16023 | 68 | 4530 | 31223 | 21717 | 24467 |
| Sum | 22910855 | 6198635 | 8297396 | 6919289 | |||
| Sum without rRNA | 4987543 | 5849288 | 7105148 | 6714545 |
As shown in Figure 11 transcripts from some nuclear genes, particularly TMSB4X, were also more abundant in human platelets as compared to the other cells and tissues. TMSB4X plays a role in regulation of actin polymerization, and is involved in cell proliferation, migration, and differentiation [18]. Furthermore, several genes involved in signal transduction, including chemokines were also abundantly expressed, particularly PPBP. The protein encoded by this gene is a platelet-derived growth factor that belongs to the CXC chemokine family, and is a potent chemoattractant for neutrophils [19]. B2M (beta-2-microglogulin gene) encodes a serum protein found in association with the major histocompatibility complex (MHC) class I heavy chain on the surface of nearly all nucleated cells [20]. The PF4 chemokine is released from the alpha granules of activated platelets in the form of a homotetramer, which has high affinity for heparin and is involved in platelet aggregation [21]. ACTB is a major constituent of the contractile apparatus and one of the two nonmuscle cytoskeletal actins [22].
The full table of platelet RNASeq data integrated in Illumina's Human BodyMap 2.0 project is available in Table S5 in File S1.
Functional classification of platelet coding transcripts
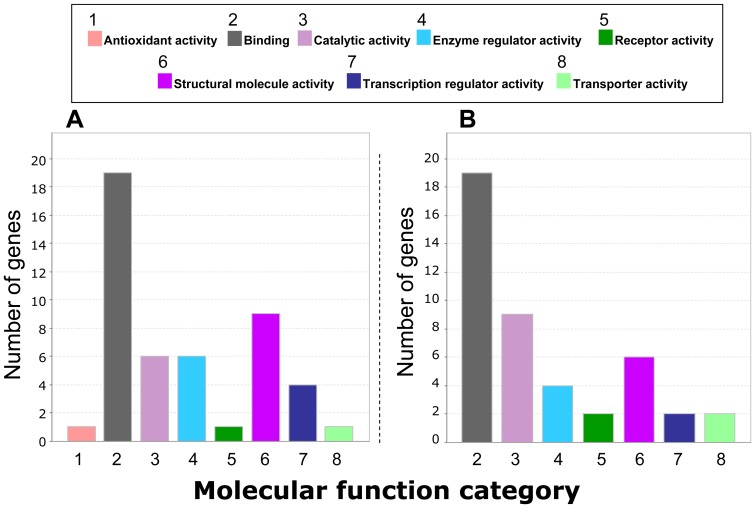
We used the web-based PANTHER software (http://www.pantherdb.org/about.jsp) [23] to classify proteins coded by the top 50 platelet genes using either polyA+ or rRNA-depleted total RNA transcripts mapped against the reference genome. The corresponding genes were grouped into clusters representing gene ontology (GO) categories of molecular functions (Fig. 13). A major finding with this analysis was that the molecular function groups of the top 50 platelet genes for polyA+ enriched RNA (Fig. 13A) correlated remarkably well with those of rRNA-depleted total RNA (Fig. 13B) despite the two distinct approaches and different donors. Among the molecular function GO groups shown in Figure 13, the category binding (GO:0005488) seems to dominate in each top 50 list. As shown in Table 8 most of the genes in this category belong to the protein binding subgroup, a class that is expected to play a prominent role in platelet functions. Another noticeable category is the structural molecule activity group. This category entails structural constituents of the cytoskeleton, and critical functions concerning cell motility and organization.
Figure 13. Classification of the proteins coded by the most abundant (top 50) coding transcripts of human platelets.
Bars represent molecular function categories generated by the PANTHER gene ontology classification web-based tool. A) Sequencing was performed on polyA+ enriched RNA, whereas in B) rRNA-depleted total RNA was analyzed.
Table 8. The function of the proteins coded by top 50 platelet genes, as provided by PANTHER gene ontology classification web-based tool.
| Nr. | Molecular function category (GO term) | Sub category (GO term) | Number of genes |
| 1 | Antioxidant activity (GO:0016209) | n.a.* | – |
| 2 | Binding (GO:0005488) | Calcium ion binding (GO:0005509) | 2 |
| Nucleic acid binding (GO:0003676) | 6 | ||
| Protein binding (GO:0005515) | 14 | ||
| 3 | Catalytic activity (GO:0003824) | Hydrolase activity (GO:0016787) | 2 |
| Ligase activity (GO:0016874) | 2 | ||
| Oxidoreductase activity (GO:0016491) | 1 | ||
| Transferase activity (GO:0016740) | 1 | ||
| 4 | Enzyme regulator activity (GO:0030234) | Enzyme activator activity (GO:0008047) | 1 |
| Enzyme inhibitor activity (GO:0004857) | 2 | ||
| Kinase regulator activity (GO:0019207) | 1 | ||
| Small GTPase regulator activity (GO:0005083) | 4 | ||
| 5 | Receptor activity (GO:0004872) | n.a.* | – |
| 6 | Structural molecule activity (GO:0005198) | Structural constituent of cytoskeleton (GO:0005200) | 9 |
| 7 | Transcription regulator activity (GO:0030528) | Transcription cofactor activity (GO:0003712) | 1 |
| Transcription factor activity (GO:0003700) | 4 | ||
| 8 | Transporter activity (GO:0005215) | n.a.* | – |
*Not available because of too few genes.
Discussion
In the present study we have compared results of RNA-Seq mapping of polyA+ transcripts in purified blood platelets with those obtained with rRNA-depleted total RNA from healthy blood donors against the set of chromosomes of the Human Feb. 2009 (GRCh37/hg19) assembly (http://www.ncbi.nlm.nih.gov/projects/genome/assembly/grc/). Based on four individuals, the present data show an apparently unique transcriptome profile as compared with other tissues of the Illumina bodymap 2.0 project.
In a typical RNA-Seq experiment, reads are sampled from RNA extracts and either mapped back to a reference genome or used for de novo assembly. Alignment and assembly of short or inaccurate reads poses a problem, which we have avoided by using 100 bp high quality Illumina reads. How closely the cDNA sequencing reflects the original RNA population is supposedly mainly determined in the library preparation step. As expected, our mapping of polyA+ reads showed a substantial bias for the 3′-end of gene transcripts due to the selection of mRNA using oligo-dT during the RNA extraction procedure and the following cDNA preparation step [24]. This 3′-UTR bias follows an exponential decay function. After length correction of coverage figures using that function for mRNA and FPKM-values for total RNA, we obtained a reasonably good agreement between quantitative estimates from mapping of polyA+ mRNA and rRNA-depleted total RNA reads to the human genome GRCh37/hg19. It is a notoriously difficult problem to assign reads to a particular isoform if there are many transcript variants with overlaps between them. Very high coverage figures are needed for satisfactory results. This is one of the reasons why RNA-Seq with low coverage has many of the same limitations as other RNA expression analysis pipelines.
Obviously, mapping of reads against the human genome and also mapping against the human exome both rely on the accuracy of gene and transcript annotations. In order to fully characterize the platelet transcriptome without reference to previous results, including the possibility to detect and fully characterize novel transcripts, we also performed a de novo assembly of transcripts using Trinity RNA-Seq software (http://trinityrnaseq.sourceforge.net/). This software will extract full-length transcripts for alternatively spliced isoforms based on the generation and analysis of de Bruijn graphs. RSEM software with the bowtie aligner (http://bowtie-bio.sourceforge.net/) was used for mapping the RNA-Seq reads back to the reported transcripts for abundance estimation. Identification of the transcripts was achieved by Blat and BLAST searches using the UCSC Browser and the NCBI Genome databases, respectively. These data fully supported our results obtained by mapping the reads to the human genome and exome, respectively, using gtf.guided assembly. However, even if transcript abundance figures agreed only the most abundant transcripts could be reliably reconstructed by the de novo assembly approach; presumably due to insufficient amounts of reads that were available.
When we started this study there was no published RNA-Seq data on platelet gene expression although microarray based as well as SAGE and real-time PCR methods have been used in the past. However, two studies using RNA-Seq by NGS were published during the progress of this study. One of these studies was reported by Rowley et al. who used polyA+ enriched RNA to characterize the transcriptomes of human and mouse platelets [17]. In contrast, Bray et al. utilized rRNA-depleted total RNA and found that their data correlated with those of previously reported microarray transcriptome data at least for the well-expressed mRNAs [16]. Both studies used relatively short sequence reads (≤50 bp for Rowley et al. and ≤40 bp for Bray et al.). The present study employed different strategies for library preparation in addition to the longer (100 bp) read length used for mapping. It is thus expected that there might exist some discrepancies between the current and the previously reported platelet transcript data. A notable difference is the “missed” NGRN transcripts (i.e. an at least tenfold lower amount) in our study when compared to the data of Rowley et al., which possibly could be due to differences of the sample preparation method. However, it should also be kept in mind that when adopting available NGS software for the RNA-seq analyses even small changes in parameter settings can produce a remarkably different result. We used settings of the Bowtie program allowing only 2 mismatches when aligning 100 bp reads to the reference sequence. Context sequencing errors (CSE) that are supposedly specific for the sequencing platform could obviously affect the read counts under such circumstances but a >10-fold reduction seems unlikely because reads from the reverse strand in the mRNA sample S0 should not have been affected to the same extent. One could also speculate whether RNA editing might influence the mapping of our platelet RNA transcripts. Adenosine to inosine (A>I) RNA editing occurs widely across the human transcriptome in certain tissues, especially in the brain [25]. Although there is no data available regarding RNA editing in platelets, we cannot exclude that possibility. However, RNA editing of protein-coding regions appears to be relatively rare events, and may thus have had limited impact on the mapping of cDNA from platelet transcripts.
The relative frequency of reads mapping uniquely to genes involved in platelet function and our molecular function protein classification by PANTHER software is consistent with but does not prove the notion that at least some mRNAs in platelets are not merely remnants from the megakaryocytes without function, but rather reflect an important role of mRNA in the physiological function of platelets. In this regard, it is not surprising that many of the proteins coded by top 50 platelet genes represent key platelet functions such as structural constituent of cytoskeleton, protein binding, calcium binding and signal transduction. On the other hand transcripts of some genes encoding prominent platelet receptors were missing or present with few sequence reads, suggesting that no further synthesis of such proteins is needed after platelet formation in the bone marrow. We also searched for transcript signal for tissue factor (TF) since this protein's eventual presence and function in platelets has been debated for years. However, we could not detect any transcripts encoding TF. Interestingly, Schwertz et al. reported that resting platelets contain TF pre-mRNA that, upon activation, is spliced into mature mRNA, indicating that only activated platelets express mature TF mRNA transcripts [26].
Simultaneously, we have confirmed the dominant frequency of mitochondrially expressed genes comprising the platelet mRNA pool. Specifically in our polyA+ mRNA study, 22,416,906 out of 35,322,009 uniquely mapped reads represent MT-transcripts, apparently related to persistent MT-transcription in the absence of nuclear-derived transcription. This is not unexpected as platelets are metabolically adapted to rapidly expend large amounts of energy required for aggregation, granule release, and clot retraction.
Conclusions
This study demonstrates that human platelets carry a unique signature of well-defined and highly abundant coding transcripts that are expressed at similar levels among individuals. However, the in vivo functional significance of nuclearly encoded platelet mRNAs remains to be shown. Future studies need to focus on establishing the biological and biochemical functions of the identified genes in the physiological and pathological regulation of platelets. The desired end point would be to define a platelet mRNA profile that is directly associated with athero-thrombotic disease, which could eventually lead to the identification of novel targets for anti-thrombotic agents.
Methods
Ethical statement
The Regional Ethical Review Board in Linköping (EPN; http://www.epn.se/start/startpage.aspx; Linköping, Sweden) granted an ethical permission for this study (permission number M74-09). Informed written consent was obtained from all participants involved in this study.
Platelet preparation
Non-irradiated apheresis platelets were collected from healthy blood donors. Platelets were collected by COBE Spectra system (Gambro BCT) as previously described [27] and were used on the same collection day. Residual leukocytes were depleted with anti-CD45 conjugated Dynabeads, according to the manufacturer's recommendations (Pan Leukocyte; Invitrogen, Carlsbad, CA). The platelet suspension, with a volume of 30 mL and a platelet count of 1.4×10⁹ cells/mL, was centrifuged at 800 g for 8 min and the supernatant was discarded. The platelet pellet was processed for leukocyte depletion, as recommended by the supplier of the Pan Leukocyte reagent (Invitrogen, Carlsbad, CA). Since leukocytes possess magnitudes of order more mRNA than platelets, the purification of platelets is a pivotal step. The leukocyte removal was performed at room temperature. Approximately 70–75% of the original platelets were recovered after the leukocyte depletion. To investigate the level of leukocyte contamination, we determined the level of CD45 (PTPRC) transcript in multiple platelet preparations (n = 6) by qPCR using TaqMan Gene Expression Assay for this gene according to the recommendations of the supplier (Assay ID: Hs00894713_m1; Applied Bioystems, Carlsbad, CA, USA).
RNA extraction and cDNA synthesis
The different strategies used for RNA-extraction, library preparation, sequencing and mapping are graphically depicted in Figure 1. For isolation of total RNA, we employed the miRVana RNA Extraction Kit as recommended by the supplier (Life Technologies). Isolation of polyA+ mRNA and synthesis of cDNA were performed by the method described by Rox et al. [22], with the exception that we used Smarter PCR cDNA Synthesis kit for the cDNA synthesis (Clontech, Mountain View, CA, USA). Briefly, the leukocyte-depleted platelet suspension was centrifuged at 1000 g for 10 min and the supernatant was discarded. PolyA+ mRNA was isolated from the platelet cell pellet by using Dynabeads Oligo(dT)25 according to the instruction of the manufacturer (Invitrogen, Carlsbad, CA, USA). To synthesize the first-strand cDNA, 3.5 µL of polyA+ mRNA was combined with 1 µL of 3′-Smart CDS primer II A (12 µM). After mixing the tube, the sample was incubated at 72 C for 3 min and then at 42 C for 2 min. This was followed by the addition of a master mix containing 2 µL of 5 First-Strand Buffer, 0.25 µL DTT (100 mM), 1 µL dNTP mix (10 mM), 1 µL SMARTer IIA oligonucleotide (12 µM), 0.25 µL RNase inhibitor, and 1 µL of SMARTScribe Reverse Transcriptase (100 U). The reverse transcription was run by incubating the tube at 42 C for 1 h before the reaction was terminated at 70 C for 10 min. The sample was then diluted with 90 µL of TE-buffer (10 nM Tris, 1 nM EDTA, pH 8.0). To run Long-Distance PCR, 10 µL of the diluted and reverse-transcribed platelet cDNA was mixed with 10 µL 10 Advantage 2 PCR buffer, 2 µL 50 dNTP mix (10 mM), 2 µL 5′PCR primer IIA (12 µM), 2 µL 50 Advantage 2 polymerase mix, and 74 µL of deionized water to a final volume of 100 µL. The sample was then incubated in a thermal cycler running a PCR program containing 95 C for 1 min, and then 20 cycles of 95 C for 15 s, 65 C for 30 s, and 68 C for 3 min. The synthesized platelet cDNA was purified with QIAquick PCR purification kit according to the manufacturer's instructions (Qiagen, Hilden, Germany), and the amount of cDNA was estimated on a Nanodrop spectrophotometer (ND1000; Saveen & Werner, Limhamn, Sweden).
Illumina HiSeq2000 sequencing
The cDNA obtained from the platelet polyA+ mRNA sample was shotgun sequenced (1×100 bp single read module) with the Illumina HiSeq 2000® instrument (Illumina, San Diego, CA, USA) by using a customer sequencing service (Eurofins MWG Operon, Ebersberg, Germany) which also included nebulization and end repair of cDNA, ligation of adaptors, gel purification, PCR amplification and library purification. The number of raw sequencing reads was 65,111,491. Filtering to remove bad quality bases and reads resulted in 58,155,680 reads (89.3%). These sequences were then mapped against the set of chromosomes of the Human Feb. 2009 (GRCh37/hg19) assembly. Initially, the mapping was conducted using the software TopHat 1.2.0 (http://tophat.cbcb.umd.edu). The post-processing of the mapping results was conducted using SamTools 0.1.12 a (http://samtools.sourceforge.net) and custom made Ruby 1.8.7 software. Bowtie http://bowtie-bio.sourceforge.net/ and bwa http://bio-bwa.sourceforge.net/ were used for aligning to de novo assembled transcripts and RefSeq mRNA respectively.
RNA samples from three platelet donors were prepared for total RNA sequencing. For these samples, ribosomal RNA was depleted with Ribo-Zero (Epicentre, Madison, WI, USA) and strand specific barcoded RNA-sequencing libraries were prepared using ScriptSeq v2 (Epicentre) according to manufacturers instructions. The barcoded libraries were run on a single lane paired end 100 bp on a HiSeq2000® (Illumina, San Diego, CA, USA), which resulted in 153 million pass filter read pairs. QC data can be found in Figure S1 in File S1. The TopHat2 software was used with the bowtie aligner.
Submission of the sequencing data to public repository
The complete sequencing data is publicly available at The European Nucleotide Archive (http://www.ebi.ac.uk/ena/) under the accession numbers E-MTAB-715 (polyA+ transcripts) and E-MTAB-1846 (total RNA transcripts). Both accession numbers are cross-referenced to one another.
Assembly of reads and bioinformatics
de novo assembly of transcripts was performed using the Trinity RNA-Seq software (http://trinityrnaseq.sourceforge.net).
Supporting Information
Contents: Table S1: HTSeq raw counts per gene in samples S0, S1, S2, and S3. Table S2: Mapping of S0 (poly(dT) selected transcripts) against RefSeq mRNA. Table S3: Length and method (NRC/FPKM) adjusted counts per gene as represented by the most abundant transcript in samples S0, S1, S2, and S3. Table S4: Differential expression of genes in polyA+ mRNA (A) versus rRNA-depleted total RNA (B). Table S5: The S0, S1, S2 and S3 RNA-Seq data integrated with Illumina's Human BodyMap 2.0 project raw data. Figure S1: QC report.
(PDF)
Acknowledgments
We are grateful to Marie Trinks of the Blood Donation Centre, Linköping University Hospital, for her kind help with the sample collection.
Funding Statement
The County Council of Östergötland (A.K., J.J. and A.O.) and the Scientific Research Council (T.L., project VR 521-2012-2729) supported this project. Sequencing was performed by the SNP&SEQ Technology Platform, Science for Life Laboratory at Uppsala University, a national infrastructure supported by the Swedish Research Council (VR-RFI). The funders had no role in study design, data collection and analysis, decision to publish, or preparation of the manuscript.
References
- 1. Kieffer N, Guichard J, Farcet JP, Vainchenker W, Breton-Gorius J (1987) Biosynthesis of major platelet proteins in human blood platelets. Eur J Biochem 164: 189–195. [DOI] [PubMed] [Google Scholar]
- 2. Wicki AN, Walz A, Gerber-Huber SN, Wenger RH, Vornhagen R, et al. (1989) Isolation and characterization of human blood platelet mRNA and construction of a cDNA library in lambda gt11. Confirmation of the platelet derivation by identification of GPIb coding mRNA and cloning of a GPIb coding cDNA insert. Thromb Haemost 61: 448–453. [PubMed] [Google Scholar]
- 3. Bugert P, Dugrillon A, Gunaydin A, Eichler H, Kluter H (2003) Messenger RNA profiling of human platelets by microarray hybridization. Thromb Haemost 90: 738–748. [PubMed] [Google Scholar]
- 4. Dittrich M, Birschmann I, Pfrang J, Herterich S, Smolenski A, et al. (2006) Analysis of SAGE data in human platelets: features of the transcriptome in an anucleate cell. Thromb Haemost 95: 643–651. [PubMed] [Google Scholar]
- 5. Gnatenko DV, Dunn JJ, McCorkle SR, Weissmann D, Perrotta PL, et al. (2003) Transcript profiling of human platelets using microarray and serial analysis of gene expression. Blood 101: 2285–2293. [DOI] [PubMed] [Google Scholar]
- 6. McRedmond JP, Park SD, Reilly DF, Coppinger JA, Maguire PB, et al. (2004) Integration of proteomics and genomics in platelets: a profile of platelet proteins and platelet-specific genes. Mol Cell Proteomics 3: 133–144. [DOI] [PubMed] [Google Scholar]
- 7. Rox JM, Bugert P, Muller J, Schorr A, Hanfland P, et al. (2004) Gene expression analysis in platelets from a single donor: evaluation of a PCR-based amplification technique. Clin Chem 50: 2271–2278. [DOI] [PubMed] [Google Scholar]
- 8. Wang Z, Gerstein M, Snyder M (2009) RNA-Seq: a revolutionary tool for transcriptomics. Nat Rev Genet 10: 57–63. [DOI] [PMC free article] [PubMed] [Google Scholar]
- 9. Heap GA, Yang JH, Downes K, Healy BC, Hunt KA, et al. (2010) Genome-wide analysis of allelic expression imbalance in human primary cells by high-throughput transcriptome resequencing. Hum Mol Genet 19: 122–134. [DOI] [PMC free article] [PubMed] [Google Scholar]
- 10. Katz Y, Wang ET, Airoldi EM, Burge CB (2010) Analysis and design of RNA sequencing experiments for identifying isoform regulation. Nat Methods 7: 1009–1015. [DOI] [PMC free article] [PubMed] [Google Scholar]
- 11. Marguerat S, Bahler J (2010) RNA-seq: from technology to biology. Cell Mol Life Sci 67: 569–579. [DOI] [PMC free article] [PubMed] [Google Scholar]
- 12. Mortazavi A, Williams BA, McCue K, Schaeffer L, Wold B (2008) Mapping and quantifying mammalian transcriptomes by RNA-Seq. Nat Methods 5: 621–628. [DOI] [PubMed] [Google Scholar]
- 13. Sultan M, Schulz MH, Richard H, Magen A, Klingenhoff A, et al. (2008) A global view of gene activity and alternative splicing by deep sequencing of the human transcriptome. Science 321: 956–960. [DOI] [PubMed] [Google Scholar]
- 14. Wilhelm BT, Landry JR (2009) RNA-Seq-quantitative measurement of expression through massively parallel RNA-sequencing. Methods 48: 249–257. [DOI] [PubMed] [Google Scholar]
- 15. Costa V, Angelini C, De Feis I, Ciccodicola A (2010) Uncovering the complexity of transcriptomes with RNA-Seq. J Biomed Biotechnol 2010: 853916. [DOI] [PMC free article] [PubMed] [Google Scholar]
- 16. Bray PF, McKenzie SE, Edelstein LC, Nagalla S, Delgrosso K, et al. (2013) The complex transcriptional landscape of the anucleate human platelet. BMC Genomics 14: 1. [DOI] [PMC free article] [PubMed] [Google Scholar]
- 17. Rowley JW, Oler AJ, Tolley ND, Hunter BN, Low EN, et al. (2011) Genome-wide RNA-seq analysis of human and mouse platelet transcriptomes. Blood 118: e101–111. [DOI] [PMC free article] [PubMed] [Google Scholar]
- 18. Kaur H, Mutus B (2012) Platelet function and thymosin beta4. Biol Chem 393: 595–598. [DOI] [PubMed] [Google Scholar]
- 19. Schenk BI, Petersen F, Flad HD, Brandt E (2002) Platelet-derived chemokines CXC chemokine ligand (CXCL)7, connective tissue-activating peptide III, and CXCL4 differentially affect and cross-regulate neutrophil adhesion and transendothelial migration. J Immunol 169: 2602–2610. [DOI] [PubMed] [Google Scholar]
- 20. Hee CS, Beerbaum M, Loll B, Ballaschk M, Schmieder P, et al. (2013) Dynamics of free versus complexed beta2-microglobulin and the evolution of interfaces in MHC class I molecules. Immunogenetics 65: 157–172. [DOI] [PubMed] [Google Scholar]
- 21. Farbiszewski R, Niewiarowski S, Worowski K, Lipinski B (1968) Release of platelet factor 4 in vivo during intravascular coagulation and in thrombotic states. Thromb Diath Haemorrh 19: 578–583. [PubMed] [Google Scholar]
- 22. Perrin BJ, Ervasti JM (2010) The actin gene family: function follows isoform. Cytoskeleton (Hoboken) 67: 630–634. [DOI] [PMC free article] [PubMed] [Google Scholar]
- 23. Thomas PD, Campbell MJ, Kejariwal A, Mi H, Karlak B, et al. (2003) PANTHER: a library of protein families and subfamilies indexed by function. Genome Res 13: 2129–2141. [DOI] [PMC free article] [PubMed] [Google Scholar]
- 24. Cheung F, Haas BJ, Goldberg SM, May GD, Xiao Y, et al. (2006) Sequencing Medicago truncatula expressed sequenced tags using 454 Life Sciences technology. BMC Genomics 7: 272. [DOI] [PMC free article] [PubMed] [Google Scholar]
- 25. Peng Z, Cheng Y, Tan BC, Kang L, Tian Z, et al. (2012) Comprehensive analysis of RNA-Seq data reveals extensive RNA editing in a human transcriptome. Nat Biotechnol 30: 253–260. [DOI] [PubMed] [Google Scholar]
- 26. Schwertz H, Tolley ND, Foulks JM, Denis MM, Risenmay BW, et al. (2006) Signal-dependent splicing of tissue factor pre-mRNA modulates the thrombogenicity of human platelets. J Exp Med 203: 2433–2440. [DOI] [PMC free article] [PubMed] [Google Scholar]
- 27. Tynngard N, Lindahl TL, Trinks M, Studer M, Berlin G (2008) The quality of platelet concentrates produced by COBE Spectra and Trima Accel cell separators during storage for 7 days as assessed by in vitro methods. Transfusion 48: 715–722. [DOI] [PubMed] [Google Scholar]
Associated Data
This section collects any data citations, data availability statements, or supplementary materials included in this article.
Supplementary Materials
Contents: Table S1: HTSeq raw counts per gene in samples S0, S1, S2, and S3. Table S2: Mapping of S0 (poly(dT) selected transcripts) against RefSeq mRNA. Table S3: Length and method (NRC/FPKM) adjusted counts per gene as represented by the most abundant transcript in samples S0, S1, S2, and S3. Table S4: Differential expression of genes in polyA+ mRNA (A) versus rRNA-depleted total RNA (B). Table S5: The S0, S1, S2 and S3 RNA-Seq data integrated with Illumina's Human BodyMap 2.0 project raw data. Figure S1: QC report.
(PDF)


