Abstract
Longitudinal analyses of single cell lineages over prolonged periods have been challenging particularly in processes characterized by high cell turn-over such as inflammation, proliferation, or cancer. RGB marking has emerged as an elegant approach for enabling such investigations. However, methods for automated image analysis continue to be lacking. Here, to address this, we created a number of different multicolored poly- and monoclonal cancer cell lines for in vitro and in vivo use. To classify these cells in large scale data sets, we subsequently developed and tested an automated algorithm based on hue selection. Our results showed that this method allows accurate analyses at a fraction of the computational time required by more complex color classification methods. Moreover, the methodology should be broadly applicable to both in vitro and in vivo analyses.
Keywords: LeGO cells, intravital imaging, automated cell analysis, RGB marking, tumor heterogeneity
Introduction
Many biological experiments, including intravital imaging studies, are performed on groups of cells under the assumption that each cell behaves similarly. However, recent evidence from single cell analyses has revealed that this assumption is often incorrect.1–4 Indeed, the behavior of individual cells, even within the same population, may differ substantially. For this reason, single cell techniques are now being developed to uncover fundamental biological principles underlying such heterogeneity in populations, and its impact on disease initiation, progression, and treatment response.
Intravital microscopy is uniquely suited to the serial study of single cells over time.5 Yet, while short time observations (hours) are typically straightforward, longer observation intervals (days) can be challenging. For example in cancerous tumors, cells are often motile, and frequently proliferate over time such that cell tracking becomes difficult and imaging fields “crowded.” To date, three general approaches have been used to deal with these issues: (1) using diluted populations of cells where only a portion of the cells in a growing tumor are fluorescent;6 (2) using photoswitchable proteins to mark individual cells7,8 and (3) using multicolored cell lines such as RGB (red/green/blue) marking with lentiviruses,9,10 green fluorescent protein (GFP), other fluorescent construct systems,1,11 or cre-lox systems.12 In the present study, to investigate clonal evolution of single cancer cell lineages in tumors, we created Lentiviral Gene Ontology (LeGO)-based multicolored versions of six common cancer cells lines (SKBR3, MCF-7, MDA-MB-231, 4T1, Paca2, and Panc02). Extensive in vitro analysis showed that these lines are reproducible, that monoclonal populations do not significantly shift in color, and that they behave in a similar manner to the parental cell lines. Determining the origin of these clones via color analysis in an automated and unbiased fashion, however, proved challenging. We thus sought to develop a simple analytical method that could be readily applied to automated analysis of large data sets.
In computer processing applications dealing with 3-dimensional RGB color space, points are typically defined in a cylindrical coordinate system using the terms hue, saturation and lightness/value or intensity (HSL/HSV or HSI). In this system, the top of the cylinder represents 360 degrees of color, wherein each color is loosely described in terms of its relative similarity to the red, yellow, green, and blue hues. The saturation and lightness/values, in turn, refer to the varying qualitative properties of each hue, which (in conjunction with hue) are used to describe the full palette of colors.13 Unfortunately, for imaging or color classification applications, the comparison of color space in 3-dimensional data sets rapidly becomes complex.
In a bid to simplify color classification in 3-dimensional biological data sets, we first created “Rainbow” cell populations by transducing Cerulean, Venus, and mCherry LeGO vectors into six cancer cell lines.9,10 Seven distinctly colored, stable, clonal populations were then selected in two of the cell lines. We consequently hypothesized that by using the single color quality, hue, we could create a simple analysis strategy for segmenting these seven clonal populations. The goal for this simple gating methodology was to provide an alternative strategy to the complex data and clustering methods typically required for analysis of 3-dimensional RGB data sets. Moreover, we also aimed to show that such analyses could be applied to in vivo studies. The described method will likely be of use in the analysis of cancer cell proliferation and/or for other applications where a simple technique for differentiating color data sets in cells is required.
Results
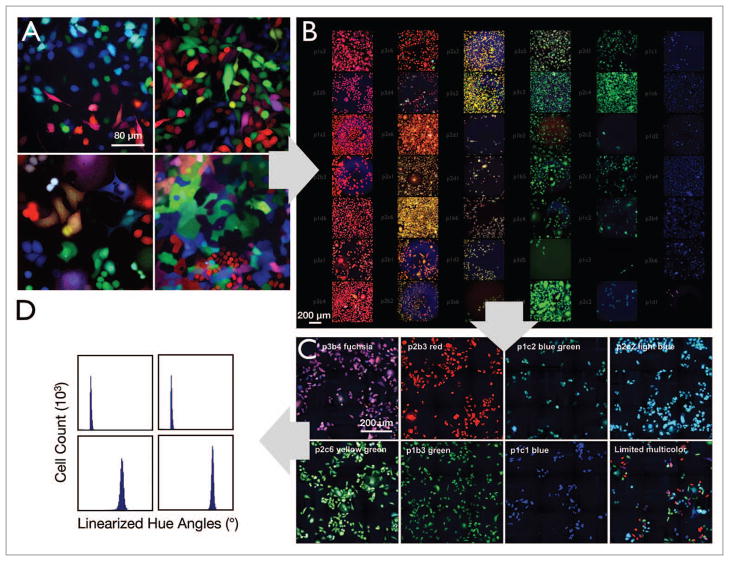
LeGO vectors were used for RGB marking.9,10 “Rainbow” cell lines were created by transducing cells (SKBR3, MCF-7, MDA-MB-231, 4T1, Paca-2, Panc02) with Cerulean, Venus, or mCherry LeGO vectors, such that approximately 50% of the cells were infected with each vector, to result in at least 64 distinct colors.9 Representative longitudinal images of the six different Rainbow cell lines (Fig. 1) obtained over three days are shown in Figure 2. In each of the clones depicted, the cells can be seen to proliferate and create identically colored daughters within the proximity of the parent cells. For subsequent in vitro and in vivo testing, seven stable “monoclonal” populations with distinct colors but with equal intensity were selected from the MDA-MB-231 and 4T1 Rainbow lines. These seven clones (p2b3 red, p1b3 green, p1c1 blue, p3b4 fuchsia, p2b3 blue-green, p1c2 light blue, p2c6 yellow-green) from the MDA-MB-231 cell line were eventually chosen for growth (Figs. 2 and 4) and in vitro color analyses (Figs. 4–6).
Figure 1.
Development of multicolored clones. (A) Multiple Rainbow cell lines were generated by transducing cells with LeGO vectors (Cerulean, Venus, and mCherry; see also Fig. 1). (B) Single clones from the MDA-MB-231 (shown here) and 4T1 Rainbow populations were then sorted and propagated. (C) Seven clones were selected by visual inspection based on color uniformity and intensity. (D) The seven clones were then analyzed using the described hue angle algorithm for their suitability for mixed population studies.
Figure 2.
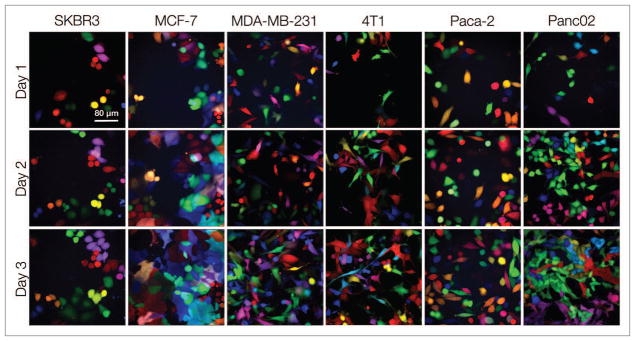
Development of LeGO cancer cell lines. To generate Rainbow populations, multiple cell lines including SKBR3, MCF-7, MDA-MB-231, 4T1, Paca-2, and Panc02 were transduced at an approximate 50% infection rate with Cerulean, Venus, and mCherry LeGO vectors. The Rainbow populations were observed over three days to determine fluorescent protein stability (color or intensity changes).
Figure 4.
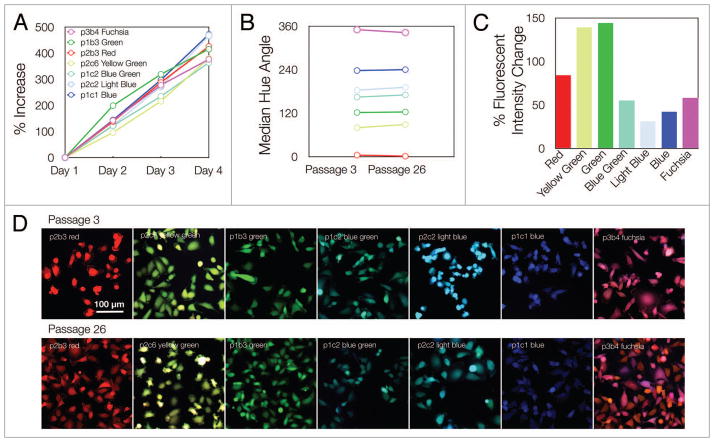
Growth characteristics. (A) The seven MDA-MB-231 clones were grown in separate wells over four days. The proliferation rate was determined using the described segmentation framework to produce unbiased counts of cells (Day 1 had ~600 counted cells for each individual clone). (B) To determine the stability of fluorescent protein expression and the suitability of the clones for long-term experiments, the median hue angle for populations of cells (~8000 cells) was measured at an early passage as well as 6 mo later after continuous cell growth and expansion. (C) Cell fluorescent intensities from passage 3 and passage 26 were taken and are displayed as the percent of change across passages. (D) Individual images for each monoclonal population at an early passage (3) and late passage (26).
Figure 6.
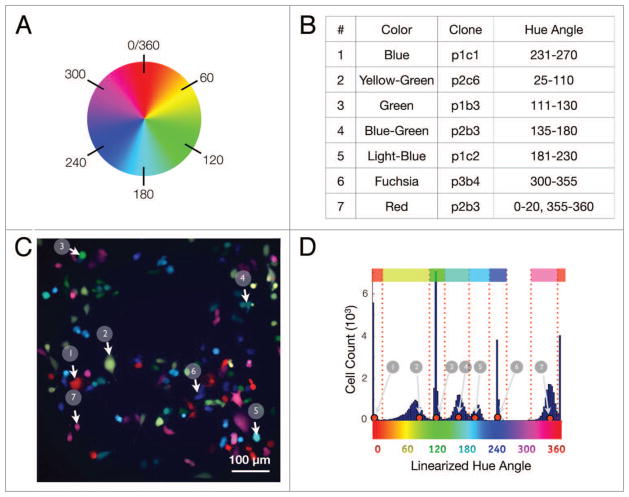
Hue analysis. (A) A generic color wheel depicting the locations of the hue angles. (B) Cutoff analysis for MDA-MB-231 cells for each of 7 hue types based on a mixed data set. (C) A typical image from a mixed MDA-MB-231 7-color set (white arrows indicate examples of each colored clone). (D) Spectral analysis of combined cells from mixed cell data sets. The top row and dotted red lines indicate the cutoff points separating each clonal subtype.
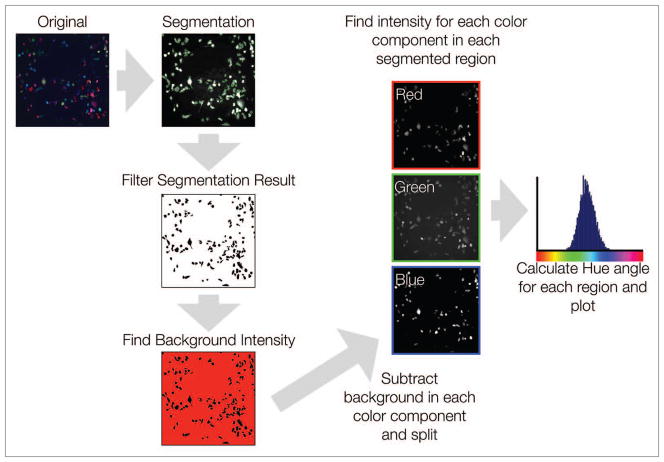
Following our development of a Rainbow cell population, we next sought to create a robust, easily implementable color-based methodology for clonal cell segmentation and counting. Briefly, for in vitro analyses, color images were first translated into grayscale equivalents and segmented in a manner that minimized cell overlapping and/or dense cell fields. Following cell segmentation, the average of the background region (region of the image that excluded all segmented areas) was obtained and subtracted from the original image of each respective color component. The relative background-subtracted intensities of each color in each segmented region were then recorded. Hue was subsequently calculated for each segmented region using the RGB values obtained from these background-subtracted images. Our results are presented as a linearized color circle histogram, where 0/360 degrees represents red, 120 degrees represents green, and 240 degrees represents blue (Figs. 3 and 6A).
Figure 3.
Image analysis. Images were first analyzed by performing unbiased automatic segmentation on a grayscale image of the cell populations. After segmentation, the background intensities for red, green, and blue were determined by finding the average intensity of the area remaining after removing the segmented regions from the original image. This background intensity was then subtracted from the red, green and blue channel images. From these background-subtracted images, the red, green and blue intensities of segmented regions were then determined, and the hue of each region calculated and plotted.
To differentiate clones falling within each of the seven different color classifications, we analyzed a mixed population of the selected MDA-MB-231 clones and plotted the results on a hue angle histogram (described above). Upon analyzing this data, seven distinct peaks were noted; these corresponded to hue angles located at approximately 0/360, 80, 120, 170, 200, 240, and 350 degrees, which correlated with the colors red, yellow-green, green, blue-green, light-blue, blue, and fuchsia, respectively. Due to simplification of our data set, which was based only on hue angle analysis, cell segmentation into their respective color categories was subsequently accomplished by generating binning cutoffs; these were established by calculating the minimum overlap percentage between each group (Fig. 6). Table 1 illustrates the percentage of overlapping cells from each area of inflection, following this gating approach. The results reflect the likely error level obtained from a system wide analysis of each of these selected clones. As expected, the highest error rates were found between the blue groups, where the hue angle plot medians are closest to one another. Of note, all error rates were found to be less than 10%, and all but two error rates were less than 5%, despite the relatively close color groupings chosen for this analysis.
Table 1.
Relative error rates for selected clones
| Color | Clone | % of Cells missed | Primary Misclassification Grouping |
|---|---|---|---|
| Red | p2b3 | 1.1% | Fuchsia (100%) |
| Yellow-Green | p2c6 | 2.0% | Green (98.3%) |
| Green | p1b3 | 0.7% | Yellow-Green(61.2%) |
| Blue-Green | p2b3 | 9.1% | Light-Blue (95.3%) |
| Light-Blue | p1c2 | 5.4% | Blue-Green (97%) |
| Blue | p1c1 | 0.0% | N/A |
| Fuchsia | p3b4 | 4.4% | Red (100%) |
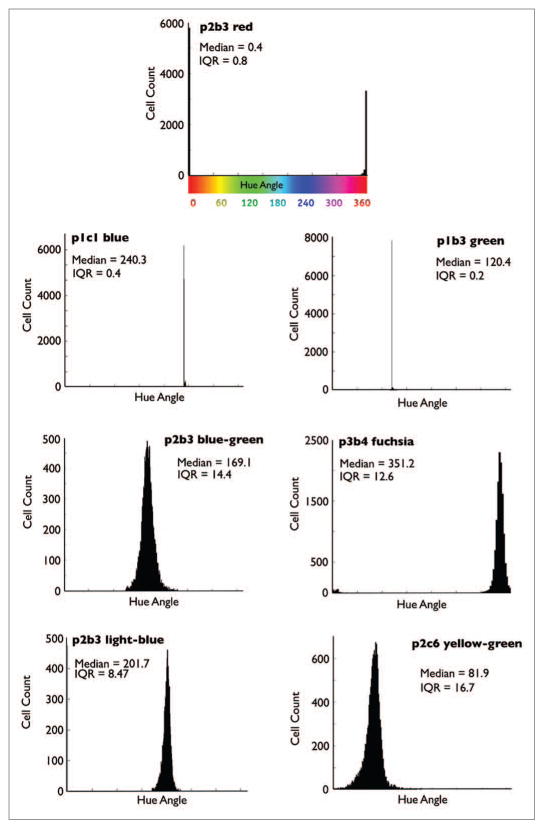
To verify our analysis method, we used individual MDA-MB-231 clones to analyze the median and variance of each set in this framework. Overall, the hues for each individual monoclonal population were mostly as expected for each color in terms of hue angle. The median and interquartile ranges were also calculated to describe the properties of the distributions in an unbiased manner. All plots were found to correspond to a Gaussian distribution (Fig. 5).
Figure 5.
Hue angle histogram analysis of individual clones. The seven MDA-MB-231 clones were grown separately, and approximately 8000 individual cells were analyzed and plotted. Each plot shows the population median as well as the interquartile range (IQR: the difference between the 25th and 75th percentile).
We next sought to apply this analytical system to verify the growth characteristics of our selected MDA-MB-231 clones. We thus initially analyzed whether LeGO vector integration had any differential effects on the rate of cell expansion in the selected clones. Over a four day period, however, we noted that the proliferation rates between each independent clone were similar. To determine whether there was any color drift over time, each clonal population was cultured for ~6 mo and the hues for each respective population were analyzed at both an early passage (passage 3) and a later passage (passage 26) (Fig. 4). Similarly, we quantified the percentage of fluorescence intensity change between passages to determine if any pattern in intensity change occurred for each construct. Additional experiments analyzing individual clonal distributions at differing passage numbers and time points showed similar distribution properties (in terms of size of interquartile range) as that seen in Figures 5 and 6. Moreover, additional proliferation experiments showed an analogous degree of proliferative expansion across clonal types as well as a comparable level of skew in terms of hue angle. Collectively, these experiments confirmed that the introduction of LeGO vectors did not introduce major proliferative changes in MDA-MB-231 cells or, by general observation, other cell lines. Furthermore, our results showing the relative skew of each of the clones illustrated that integration of the construct was stable enough for long-term experiments.
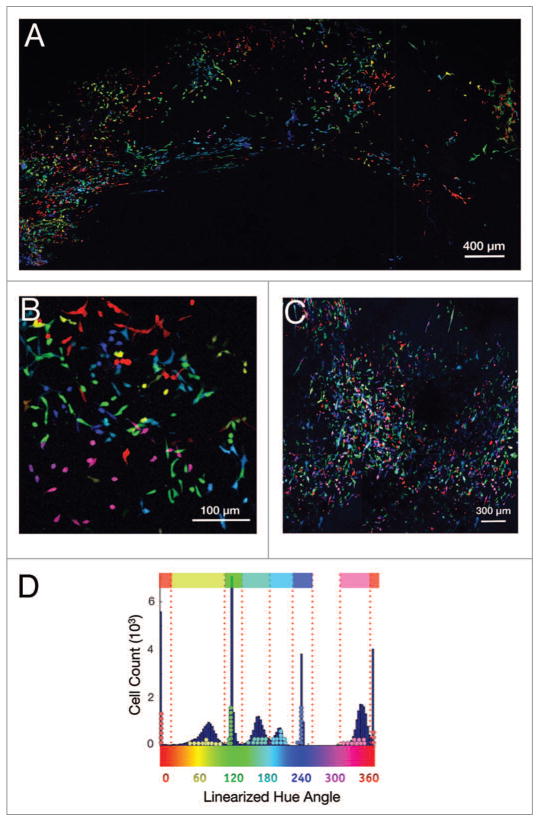
Finally, in vivo imaging experiments were performed using MDA-MB-231 and 4T1 clones to determine whether these clonal populations properties in vitro would be reflected in vivo. Clonal mixes of the above-described cells mixed with parent lines were injected into window chamber models before acquisition of 3-dimensional z-stacks. Utilizing the same segmentation and hue evaluation framework as described for the analysis of in vitro cells, we examined a representative projection from a 3-D image stack from in vivo tumors composed of MDA-MB-231 and 4T1 cells. Our results indicated that the clonal hues observed in vivo corresponded with our previously generated segmentation constructs for both MDA-MB-231 cells (Fig. 7) and 4T1 cells. Additionally, in order to ascertain the cell type specificity of the observed fluorescence, we conducted follow up experiments illustrating that tumor associated macrophages did not colocalize with LeGO fluorescence (Fig. S1). As a result of this work, we demonstrated that our clonal population and analysis methods developed in vitro could be translated into an in vivo environment. Moreover, this ability to translate the general parameters of color segmentation speaks to the robust nature of this analysis framework. Ultimately, our findings illustrate that imaging and analyses of clonal subsets in an in vivo environment is feasible, and could thus allow experimentalists to take serial measurements of clonal changes in tumors more easily.
Figure 7.
Automated in vivo analysis. (A) Low magnification montage of 4T1 tumor cells in vivo. (B) Magnified image of a 4T1 tumor in vivo. (C) Low magnification montage of MDA-MB-231 tumor cells in vivo. (D) Dots from a representative sample of 10 hues in each previously defined color region obtained via image analysis of a 3-D projection of MDA-MB-231 cells overlaid with our in vitro analysis (shown in Fig. 6).
An inherent and important advantage of the described method is its computational simplicity. Since the color division of cell lineages is relatively simple in this framework, the primary use of computational resources in the program comes from the thresholding and segmentation of cells, which was simplified further by the use of an additional parent line to the in vivo environment. This is in contrast to other statistical classification methods, which are significantly more resource intensive. To illustrate this, while the above-described technique allowed us to classify ~10000 cells in an order of minutes, a similar implementation using more complex statistical classifiers would take on the order of hours.
Discussion
Multicolor RGB markings of specific cells is a powerful tool for cell tracing, interactive mapping and clonal analyses.9 However, most published reports continue to rely on visual representation of multicolored cells10 rather than on quantitative metrics. Flow cytometry is one potential strategy for clonal analysis,14 but this technique typically relies on end-point measurements or requires resection of tumors over time, both of which could influence tumor behavior. While imaging clonal populations of cells in combination with emerging techniques and technologies in intravital imaging15,16 allows for serial analyses of tumor cell expansion and dynamics in situ, it comes at the cost of increased analytical complexity. To extract this data, it would be extremely useful to develop automated algorithms capable of segmenting cells and classifying them correctly according to their originating color. In practice, this is challenging for two reasons: (1) cells expressing cytoplasmic fluorescent proteins often form dense, overlapping groups in vivo, which makes the extraction of single cell borders in intravital images difficult; and (2) the differentiation of cells into distinct color groups from this environment can be complicated due to the nature of the color data obtained. RGB data sets also consist of 3-dimensional information, which require advanced statistical classification methods to analyze and segment colors into distinct groups. This classification is certainly possible in the case of well separated groups, but where clonal groups have coincidental feature regions, such analyses become increasingly intricate and error prone.
A variety of strategies for automated image analysis and color classification are currently being pursued, each differing in complexity and time taken for analysis. For instance, unsupervised clustering represents a potentially powerful approach for these types of analyses (e.g., see ref. 17). Unfortunately, it is computationally intensive and remains little explored for in vivo RGB-marked populations. In the present study, we therefore chose to investigate a simple approach that could be easily implemented on a desktop computer for rapid analysis of image data sets. The method relies on a single, easily calculable property of color (hue) to distribute and segment cells in a straightforward manner. By using this property of color, rather than more complicated 3-dimensional grouping methods otherwise necessary, we show that the method is easily implemented, valuable, fast and accurate.
Initially, we began by examining seven well-defined monoclonal cell populations that had been selected from a larger repertoire of multicolored cells. Individual cells from these RGB-marked populations were then isolated using flow cytometry,9 and clones were chosen by eye to provide a mix of large hue differences (for example, the red, yellow-green, green clones) combined with smaller intergroup hue differences (blue, blue green, light blue groupings) in order to better understand the separability of clonal classifications. Based on this analysis, assuming that clonal hue distributions (i.e., group variances) are similar to the clones presented, we estimate that a total of ~12 clones could be analyzed with the same approximate error percentages (~5%) observed here. Ultimately, we believe that our developed method represents a practical approach to rapidly quantitating multicolor data sets. It will thus likely be of value for both in vitro and in vivo image analysis and single cell/lineage classification.
Future work implementing and improving these methods for intravital microscopy will focus on several areas. One potential enhancement would be the development of improved methods of clonal and/or construct fluorescent cell line construction, resulting in a decreased range of individual group color distributions. Decreasing the range of these distributions would improve the system by allowing for an increased number of unique clonal populations to be monitored over time. This is particularly important in light of the use of an unlabeled parent line for segmentation purposes. Additional separable clones will aid in the segmentation of populations by decreasing the odds that identical colored cells are overlapping each other, potentially allowing for the elimination of parent cells in the population. Additionally, developments in either the constructs or clonal selection processes could also potentially speed the time required to move the system into an in vivo imaging setting. Decreasing the time needed for cell line development may further improve the system by, for example, allowing the use of primary cancer cells rather than cell lines. Such advances could increase the biological relevance of conclusions made from imaging.
Materials and Methods
Lentivirus production and titer calculation
LeGO-C2, LeGO-V2, and LeGO-Cer2 plasmids were generously provided by Drs. Kristoffer (Weber) Riecken and Boris Fehse at the University Medical Center Hamburg-Eppendorf.
HEK-293T cells were cultured in Dulbecco’s Modified Eagle Medium (DMEM) supplemented with 10% fetal bovine serum (FBS), 1% glutamine, and 1% penicillin/streptomycin and grown at 37°C in a humidified chamber with 5% CO2. 293T cells at low passage numbers were plated in 10 cm dishes and grown overnight. They were then transfected with a packaging plasmid mix of pMDL g/p, pRSV Rev, and pCMV-VSVg, (Addgene plasmids 12251, 12253, and 8454, respectively) and LeGO target vector in a 1:1 ratio using the TransIT®-LT1 Transfection Reagent (Mirus). Alternatively, cells were transduced with lentiviral vectors generated using the Lenti-X HTX packaging system and Lenti-X 293T cells following the manufacturer’s instructions (Clontech). The 293T cells were then incubated for approximately 72 h, at which point the supernatant was collected and filtered through a 0.45 μm cellulose acetate syringe filter. Supernatants were aliquoted into cryovials and snap frozen in liquid nitrogen before being stored at −80 °C.
For titer calculations, cells were plated in 96 well plates and infected with varying concentrations of viral supernatant. After 24 and 48 h, cell fluorescence was measured by fluorescence microscopy, and the number of fluorescent cells vs. total number of cells was determined.
Cell line generation
MDA-MB-231, MCF-7, 4T1, and Panc02 cells were grown in RPMI medium supplemented with 10% FBS, 1% glutamine, and 1% penicillin/streptomycin. SKBR3 and Paca-2 cells were grown in DMEM supplemented with 10% FBS, 1% glutamine, and 1% penicillin/streptomycin. All cells were grown at 37°C in a humidified chamber with 5% CO2.
To generate Rainbow cell lines, cells were plated in 12 well plates and infected with a combination of three lentiviral supernatents such that approximately 50% of the cells expressed each fluorescent protein. Individual MDA-MB-231 or 4T1 cells were then sorted into wells of 96 well plates using a BD Vantage Cell Sorter (MGH Flow Cytometry Core) or the BD FACSAria (MGH Center for Regenerative Medicine and Harvard Stem Cell Institute Flow Cytometry Core). For the 4T1 cell lines, sorted clones were further isolated using the dilution method of clonal selection to guarantee monoclonal populations. Isolated clones were allowed to grow in 96 well plates until ready for passaging, at which point cells were screened using high-throughput fluorescence microscopy to determine fluorescence profiles and uniformity of the populations. Clones with uniform fluorescence and comparable intensity were further propagated and frozen.
In vitro imaging
In vitro microscopy was performed using a DeltaVision imaging system (Applied Precision). This system consists of an environmental chamber heated to 37 °C with CO2 bubbled through a water bath, an automated Olympus IX70 inverted microscope, and a CoolSnap HQ2 CCD camera. Cells to be imaged were plated in ibidi 96-well plates with optically clear, thin bottoms (ibidi).
Mouse model and in vivo imaging
All surgical procedures and imaging sessions were performed according to approved animal protocols. Nu/Nu mice (Cox-7; Massachusetts General Hospital) were anesthetized with 2.0 L/minute isoflurane: 2.0 L/minute oxygen. Surgeries were performed under sterile conditions using a zoom stereo microscope (Olympus SZ61). Titanium dorsal skinfold chambers (DSCs; APJ Trading Co, Inc.) were implanted into the dorsal skin fold of Nu/Nu mice, and cells were implanted under the chamber as described6 utilizing a mix of LeGO and non-fluorescent parent line cells in order to increase distinction between cells and simplify in vivo segmentation. Tumors were imaged one week following implantation. To reduce motion artifacts from mouse respiration and to permit imaging of single cells at high-resolution over extended periods, a custom-made DSC holder was used.
Images were collected using a confocal/multi-photon Olympus FV1000 system with a BX61-WI microscope base. Olympus objectives, including a 25× XPlan N (NA 1.05, water), 2×/340 XLFluor (NA 0.14, air), and 60× LUMFL N (NA 1.10, water), were used for imaging. Cells were excited using a 458 nm or 515 nm Argon ion laser-line, or using a 559 nm pumped solid-state laser, respectively, in combination with a DM440–458/515/559–561 nm dichroic beam splitter. Emitted light was separated and collected using SDM490 and SDM560 beam splitters, and BA480–495, BA535–565 and BA575–675 bandpass filters. Z-stacks with 2.5 μm intervals were collected in x-y mosaics.
Image analysis and color segmentation
All image analysis was conducted using in-house created Matlab scripts (Mathworks). The overall algorithm functions by first, segmenting cells in a consistent manner for both in vitro and in vivo environments. Cell segmentation was completed using a modified version of a previously described algorithm18 based on Ray’s thresholding method.19 This method is an example of a local adaptive thresholding method that has previously been shown to work well for in vivo thresholding due to first, its ability to segment cells based off of intensity differences in local neighborhoods and second, its function which iteratively determines relevant parameters for segmentation. An additional aid in cell segmentation was the addition of an unlabeled parent cell line to color mixes providing for more separation of cells in a solid tumor environment. Following cell segmentation, the average RGB values in each cell region, as well as the background (defined as the whole of the image minus segmented regions) was determined in Matlab. Background value was then subtracted from each segmented region to determine true fluorescent intensity in the red, green, and blue channels. Cell hues for each defined region were then calculated from RGB values that were obtained from these background subtracted values, according to the method popularized by Preucil.20
Macrophage LeGO fluorescence colocalization
It is theoretically possible that tumor associated macrophages (TAM) incorporate fluorescent debris from LeGO cells and thus become fluorescent themselves. To investigate this possibility we performed the following experiment. LeGO 4T1 cells were implanted in dorsal skin window chambers as previously described. Following tumor formation, a near infrared fluorochrome labeled TAM avid dextran nanoparticle (Cross Linked Iron Oxide conjugated to Vivo Tag 680; Clio-VT680) was injected via tail vein where it was taken up by macrophages over 24 h.21 Imaging was conducted as previously described either 1 or 2 d following Clio-VT680 injection.
Supplementary Material
Acknowledgments
We would like to thank Matt Sebas for performing mouse surgery, Josh Dunham and Alex Zaltsman for microscopy, Drs Aaron Aguirre and Rainer Kohler for assistance with macrophage experiments, Dr Jeffrey Schlom at the Laboratory of Tumor Immunology and Biology at the National Cancer Institute for the Panc02 cell line, Drs Didier Trono and Robert Weinberg at the Massachusetts Institute of Technology for the lentiviral packaging plasmids, and Drs Kristoffer Riecken (formerly Weber) and Boris Fehse at the University Medical Center Hamburg-Eppendorf for kindly providing the LeGO vectors. Part of this work was supported by NIH grants P50-CA86355, RO1-EB006432 and RO1-CA164448.
Footnotes
Disclosure of Potential Conflicts of Interest
No potential conflicts of interest were disclosed.
References
- 1.Kreso A, O’Brien CA, van Galen P, Gan OI, Notta F, Brown AM, Ng K, Ma J, Wienholds E, Dunant C, et al. Variable clonal repopulation dynamics influence chemotherapy response in colorectal cancer. Science. 2013;339:543–8. doi: 10.1126/science.1227670. http://dx.doi.org/10.1126/science.1227670. [DOI] [PMC free article] [PubMed] [Google Scholar]
- 2.Campos M, Luque R, Jiménez J, Martínez R, Warleta F, Sánchez-Quesada C, Delgado-Rodríguez M, Calvo A, Gaforio JJ. Simultaneous phenotypic and genetic characterization of single circulating tumor cells from colon cancer patients. Histol Histopathol. 2013 doi: 10.14670/HH-28.1439. [DOI] [PubMed] [Google Scholar]
- 3.Spencer SL, Gaudet S, Albeck JG, Burke JM, Sorger PK. Non-genetic origins of cell-to-cell variability in TR AIL-induced apoptosis. Nature. 2009;459:428–32. doi: 10.1038/nature08012. http://dx.doi.org/10.1038/nature08012. [DOI] [PMC free article] [PubMed] [Google Scholar]
- 4.Albeck JG, Burke JM, Aldridge BB, Zhang M, Lauffenburger DA, Sorger PK. Quantitative analysis of pathways controlling extrinsic apoptosis in single cells. Mol Cell. 2008;30:11–25. doi: 10.1016/j.molcel.2008.02.012. http://dx.doi.org/10.1016/j.molcel.2008.02.012. [DOI] [PMC free article] [PubMed] [Google Scholar]
- 5.Pittet MJ, Weissleder R. Intravital imaging. Cell. 2011;147:983–91. doi: 10.1016/j.cell.2011.11.004. http://dx.doi.org/10.1016/j.cell.2011.11.004. [DOI] [PMC free article] [PubMed] [Google Scholar]
- 6.Earley S, Vinegoni C, Dunham J, Gorbatov R, Feruglio PF, Weissleder R. In vivo imaging of drug-induced mitochondrial outer membrane permeabilization at single-cell resolution. Cancer Res. 2012;72:2949–56. doi: 10.1158/0008-5472.CAN-11-4096. http://dx.doi.org/10.1158/0008-5472.CAN-11-4096. [DOI] [PMC free article] [PubMed] [Google Scholar]
- 7.Subach OM, Patterson GH, Ting LM, Wang Y, Condeelis JS, Verkhusha VV. A photoswitchable orange-to-far-red fluorescent protein, PSmOrange. Nat Methods. 2011;8:771–7. doi: 10.1038/nmeth.1664. http://dx.doi.org/10.1038/nmeth.1664. [DOI] [PMC free article] [PubMed] [Google Scholar]
- 8.Entenberg D, Wyckoff J, Gligorijevic B, Roussos ET, Verkhusha VV, Pollard JW, Condeelis J. Setup and use of a two-laser multiphoton microscope for multichannel intravital fluorescence imaging. Nat Protoc. 2011;6:1500–20. doi: 10.1038/nprot.2011.376. http://dx.doi.org/10.1038/nprot.2011.376. [DOI] [PMC free article] [PubMed] [Google Scholar]
- 9.Weber K, Thomaschewski M, Warlich M, Volz T, Cornils K, Niebuhr B, Täger M, Lütgehetmann M, Pollok JM, Stocking C, et al. RGB marking facilitates multicolor clonal cell tracking. Nat Med. 2011;17:504–9. doi: 10.1038/nm.2338. http://dx.doi.org/10.1038/nm.2338. [DOI] [PubMed] [Google Scholar]
- 10.Weber K, Thomaschewski M, Benten D, Fehse B. RGB marking with lentiviral vectors for multicolor clonal cell tracking. Nat Protoc. 2012;7:839–49. doi: 10.1038/nprot.2012.026. http://dx.doi.org/10.1038/nprot.2012.026. [DOI] [PubMed] [Google Scholar]
- 11.Lin MZ. Beyond the rainbow: new fluorescent proteins brighten the infrared scene. Nat Methods. 2011;8:726–8. doi: 10.1038/nmeth.1678. http://dx.doi.org/10.1038/nmeth.1678. [DOI] [PubMed] [Google Scholar]
- 12.Livet J, Weissman TA, Kang H, Draft RW, Lu J, Bennis RA, Sanes JR, Lichtman JW. Transgenic strategies for combinatorial expression of fluorescent proteins in the nervous system. Nature. 2007;450:56–62. doi: 10.1038/nature06293. http://dx.doi.org/10.1038/nature06293. [DOI] [PubMed] [Google Scholar]
- 13.Cheng HD, Jiang XH, Sun Y, Wang J. Color image segmentation: advances and prospects. Pattern Recognit. 2001;34:2259–81. http://dx.doi.org/10.1016/S0031-3203(00)00149-7. [Google Scholar]
- 14.Malide D, Métais JY, Dunbar CE. Dynamic clonal analysis of murine hematopoietic stem and progenitor cells marked by 5 fluorescent proteins using confocal and multiphoton microscopy. Blood. 2012;120:e105–16. doi: 10.1182/blood-2012-06-440636. http://dx.doi.org/10.1182/blood-2012-06-440636. [DOI] [PMC free article] [PubMed] [Google Scholar]
- 15.Wang K, Liu TM, Wu J, Horton NG, Lin CP, Xu C. Three-color femtosecond source for simultaneous excitation of three fluorescent proteins in two-photon fluorescence microscopy. Biomed Opt Express. 2012;3:1972–7. doi: 10.1364/BOE.3.001972. http://dx.doi.org/10.1364/BOE.3.001972. [DOI] [PMC free article] [PubMed] [Google Scholar]
- 16.Mahou P, Zimmerley M, Loulier K, Matho KS, Labroille G, Morin X, Supatto W, Livet J, Débarre D, Beaurepaire E. Multicolor two-photon tissue imaging by wavelength mixing. Nat Methods. 2012;9:815–8. doi: 10.1038/nmeth.2098. http://dx.doi.org/10.1038/nmeth.2098. [DOI] [PubMed] [Google Scholar]
- 17.Shi T, Horvath S. Unsupervised learning with random forest predictors. J Comput Graph Statist. 2006;15:118–38. http://dx.doi.org/10.1198/106186006X94072. [Google Scholar]
- 18.Giedt RJ, Koch PD, Weissleder R. Single cell analysis of drug distribution by intravital imaging. PLoS One. 2013;8:e60988. doi: 10.1371/journal.pone.0060988. http://dx.doi.org/10.1371/journal.pone.0060988. [DOI] [PMC free article] [PubMed] [Google Scholar]
- 19.Ray N, Saha BN. Edge Sensitive Variational Image Thresholding. ICIP; 2009. [Google Scholar]
- 20.Preucil F. Color Hue and Ink Transfer … Their Relation to Perfect Reproduction. TAGA Proceedings. 1953:102–110. [Google Scholar]
- 21.Weissleder R, Nahrendorf M, Pittet MJ. Imaging macrophages with nanoparticles. Nat Mater. 2013 doi: 10.1038/nmat3780. In press. [DOI] [PubMed] [Google Scholar]
Associated Data
This section collects any data citations, data availability statements, or supplementary materials included in this article.


