

Abstract
Obesity is a leading risk factor for a variety of metabolic diseases including cardiovascular disease, diabetes and cancer. Although in its simplest terms, obesity may be thought of as a consequence of excessive caloric intake and sedentary lifestyle, it is also evident that individual propensity for weight gain can vary. The etiology of individual susceptibility to obesity appears to be complex – involving a combination of environmental – genetic interactions. Herein, we suggest that the mitochondrion plays a major role in influencing individual susceptibility to this disease via mitochondrial – nuclear interaction processes, and that environmentally influenced selection events for mitochondrial function that conveyed increased reproductive and survival success during the global establishment of human populations during prehistoric times can influence individual susceptibility to weight gain and obesity.
Obesity is currently the fifth leading risk for global death [1] as well as a major risk factor for cardiovascular disease, diabetes and cancer, which, combined, accounted for over 1.2 million deaths in the U.S. in 2010 [2] In general, weight gain and ultimately obesity are considered a. consequence of excessive caloric intake and sedentary lifestyles commonplace in western society. However, it is clear that some individuals appear to be more prone to weight gain than others, and that certain racial groups are at greater risk for obesity. Studies endeavoring to find a clear genetic basis of this susceptibility have largely been unsuccessful, suggesting that the etiology of individual susceptibility to obesity is a combination of complex environmental – genetic interactions. We suggest that the mitochondrion plays a major role in influencing individual susceptibility to this disease via mitochondrial – nuclear interaction processes, and that environmentally influenced selection events for mitochondrial function that conveyed increased reproductive and survival success during the global establishment of human populations during prehistoric times, today, can influence individual susceptibility to weight gain and obesity.
Obesity is endemic in the developed world
Obesity is defined as increased deposition of adipose tissue, particularly in the abdomen, leading to increased waist circumference and a body mass index (BMI) of 30 or more [3]. Obesity rates have been steadily rising over the past 25 years, with current reports classifying more than one-third of US adults as obese [4]. This is of particular concern in the southern states, with Alabama, Mississippi, and Louisiana all reporting obesity prevalence greater than 31%, compared to northern states reporting in the mid- to upper-20s. Obesity is also a major risk factor for Metabolic Syndrome, or Syndrome X – a cluster of risk factors that, when occurring together, increase a patient’s risk for cardiovascular disease and Type 2 Diabetes (T2DM) [5]. While there is no relationship between obesity and education level among men, there is a surprising link between obesity and income. It is reported that African-American and Mexican-American men with higher income are more likely to be obese than those with low income [6, 7], which is contrary to classic dogma [7]. However, it should be noted that most documented relationships between obesity and socioeconomic status occur in children, adolescents and women [8, 9]. Obesity does have a documented racial disparity, with non-Hispanic African-Americans having the highest age-adjusted obesity rate of 49.5%, compared to non-Hispanic Caucasians with a rate of 34.3% [10]. While obesity can occur at any age, metabolic and lifestyle changes associated with aging increase obesity risk [11]. Poor diet and lack of exercise are implicated as the major contributors to the rising incidence of obesity [12–15], but there is also an increasing volume of research exploring possible genetic factors causing, or at least contributing to, obesity susceptibility in adult and juvenile populations.
Single-gene mutations that cause obesity are rare
Numerous studies have attempted to identify causal mutations that could explain the rising obesity rates. Multiple monogenic syndromes have been identified – where afflicted patients are morbidly obese and some exhibit multiple factors of the metabolic syndrome as a result of a single mutation in one nuclear gene. A number of these monogenic obesity syndromes were reviewed by Farooqi and O’Rahilly [16], including congenital leptin deficiency, leptin receptor mutations, and melanocortin-4 receptor (MCR4) mutations.
Leptin is a 16kDa hormone that is synthesized in the adipocytes of white adipose tissue [17]. It has been shown to play a role in modulating energy expenditure and food intake by exerting effects on appetite and hunger as well as metabolism [18]. Leptin exerts its effects by binding its receptors in the brain to inhibit appetite [19]. Leptin is, along with insulin, considered an adiposity signal [20]; circulating leptin levels are proportional to body fat, though this can be altered with calorie restriction [21–23]. Given its function, leptin deficiency results in morbid obesity caused, in part, by an uncontrollable appetite. Documented cases of patients with congenital leptin deficiency are extremely rare, with less than 20 afflicted individuals identified since 1997 [24]. Some cases have been reported in consanguineous families [25]. Most of the patients in these studies were treated with exogenous leptin. Leptin therapy has been shown to promote weight loss as well as a decrease in hyperphagia associated with leptin deficiency [26]. The rodent model of leptin deficiency, the ob/ob mouse [27], is considered a classic obesity model for basic science research. While a plethora of research has been conducted on this transgenic mouse model, as previously stated, leptin deficiency is an extremely rare cause of obesity in humans.
The leptin receptor, which binds the leptin hormone, is found in the brainstem as well as the hypothalamus [28]. A rodent model of leptin receptor (LEPR) deficiency, the db/db mouse, has also been widely studied. However, it is again clear that the LEPR deficiency seen in the db/db mouse is equally rare in humans, with fewer than 15 reported cases as of 2012 [24]. Leptin receptor mutations result in high levels of mutant receptor and subsequent elevated circulating leptin levels. The phenotype of LEPR deficiency is comparable to that of congenital leptin deficiency, characterized by morbid obesity, rapid weight-gain and increased fat mass, severe hyperphagia as well as some endocrine dysfunction [29]. As the gene defect is in the receptor, treatment with exogenous leptin is not therapeutic for these patients. Evidence points to uncoupling proteins (UCPs) as a potential therapeutic target in both rodents and humans [30, 31], but significant pharmacological interventions have not yet been developed [28].
The melanocortin 4 receptor (MCR4) is a G-protein coupled protein receptor in the brain that binds α-melanocyte stimulating hormone [32]. Studies of MCR4 in rodents demonstrate its role in both feeding as well as metabolism. Mice with MCR4 deficiency exhibit progressive obesity, hyperphagia, hyperglycemia and hyperinsulinemia [32, 33]. The frequency of MCR4 mutations is higher than all other monogenic obesity syndromes; in UK and European populations, 1–2.5% of individuals with a BMI of 30 or greater were found to have MCR4 mutations [34]. Individuals that are heterozygous for the gene mutation exhibit less severe symptoms than homozygotes [35]. Patients with MCR4 deficiency do not currently have any widely available treatment options.
While these monogenic syndromes do cause obesity, the frequencies of these mutations are low and therefore do not account for the rising rates of obesity currently observed in the developed world (Table 1). In addition, these rare monogenic syndromes have been reported in various ethnic groups and thus do not contribute to the racial disparity seen in obesity and metabolic disease. Finally, the rate at which obesity is rising in the population is too rapid to be explained by single gene mutations in the nucleus and is likely due to environmental – genetic interaction processes as the primary cause [36]. Consistent with this notion is the CDC statement in 2012 that “genetic changes in human populations occur too slowly to be responsible for the obesity epidemic” [37].
Table 1.
Table summarizing some of the single gene mutations that cause obesity. Listed are genetic loci, mutation types, inheritance patterns, prevalence in global population and laboratory mouse model of gene defect Information In Table 1 adapted from www.orpha.net
| Gene | Locus | Mutation | Inheritance | Prevalence | Mouse Model |
|---|---|---|---|---|---|
| Leptin | 7q31.3 | Homozygous | Autosomal recessive | < 1/1 000 000 | Ob/Ob |
| Leptin Receptor (LEPR) | 1p31.3 | Homozygous | Autosomal recessive | < 1/1 000 000 | Db/Db |
| Melanocortin-4 Receptor (MCR4) | 18q21.32 | Heterozygous | Autosomal dominant | 1–5/10 000 | Mc4rtm1Lowt |
Obesity is associated with inflammation and oxidative stress
Though it has been widely studied [38–48], obesity is often not described to patients or the public as an inflammatory disease. However, inflammation provides an additional link between obesity and diabetes [49]. Rodent studies have shown that insulin resistance related to obesity is part of a systemic inflammatory state that is initiated in the adipose tissue [46]. Additionally, adipose tissue of obese patients has elevated macrophage numbers and these macrophages activate numerous inflammatory pathways [47]. Systemic oxidative stress has also been correlated to numerous clinical conditions including obesity. Examination of 8-epi-PGF2α, an isoprostane and marker of oxidative stress, in a cohort of patients in the Framingham Study revealed positive correlation between 8-epi-PGF2α levels and obesity as well as insulin resistance [50]. Adipose tissue plays a role in regulating inflammation [48] and it is known that inflammation contributes to numerous pathologies downstream of obesity [51–54]. These findings point to a positive feedback loop between chronic, systemic inflammation and increased adiposity. Numerous markers of inflammation co-segregate with and play roles in obesity and metabolic disease, including C-reactive protein, interleukin-6, tumor necrosis factor-alpha and reactive oxygen species.
C-reactive protein (CRP) is a native protein that is commonly used as a marker of low-grade systemic inflammation [38]. Synthesized in the liver, its role in inflammatory processes is to bind phosphocholine expressed on the cell surface of dying cells and consequently activate the complement system as part of the innate immune response [55]. Interleukin-6 (IL-6) is a pro-inflammatory cytokine that is secreted by T-cells and macrophages. Adipose tissue-derived IL-6 is known to exert effects on metabolism by altering adipose tissue gene expression, triglyceride release and insulin sensitivity [56]. Both CRP and IL-6 levels are elevated in overweight and obese patients, suggesting that there is chronic, systemic inflammation within the obese patient population [39]. In addition to obesity, elevated CRP, IL-6 and tumor necrosis factor-alpha (TNF-α) levels have been reported in patients with insulin resistance [40] and cardiovascular disease [40, 41]. CRP has also been implicated in mitochondrial reactive oxygen species (ROS) formation associated with apoptosis as well as alteration of antioxidant levels including manganese superoxide dismutase (MnSOD) and glutathione peroxidase (GPx) [57]. Race has also been addressed with respect to CRP levels – healthy Indian-Asians have higher CRP concentrations than European whites [42], suggesting that basal inflammatory state differs between races and could potentially contribute to differential disease susceptibility.
Tumor necrosis factor-alpha (TNF-α) is a pro-inflammatory cytokine that is also associated with systemic inflammation [58]. TNF-α is produced by activated macrophages and is able to induce numerous immune responses including fever [59] and cell death [60]. Elevated TNF-α levels have been reported in obese patients as well as those with peripheral insulin resistance [43]. Interestingly, the increase is not only in circulating TNF-α levels, but also in adipose tissue specifically [44]. The involvement of TNF-α in obesity has also been confirmed in animal studies, where transgenic animals lacking TNF receptors attenuated obesity and obesity-induced insulin resistance even when an animal model predisposed to obesity (the ob/ob mouse) was used [45]. TNF-α has also been implicated in mitochondrial reactive oxygen species (ROS) formation and signaling related to cell death [61], providing a probable link between the mitochondrion and inflammatory processes associated with obesity.
Hence, the etiology underlying individual susceptibility to obesity points to a complex process. This process likely involves environmental factors and “normal” genetic polymorphisms (i.e. not pathogenic mutations) that under conditions of environmental stress are linked with increased inflammation and metabolic dysfunction. Therefore, when exploring possible cellular and genetic mechanisms that contribute to obesity, numerous factors should be considered. These include factors involved in cellular metabolism that are responsive to changes in the environment (e.g. caloric intake and physical activity), those that can influence oxidant and/or inflammatory response, as well as account for racial differences in susceptibility. As discussed in the following sections and summarized in Figure 1, we hypothesize that features of mitochondrial biology, function and genetics meet these criteria.
Figure 1.
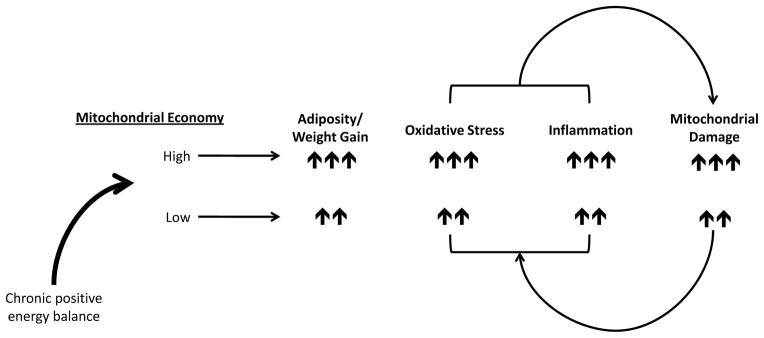
Schematic illustrating the hypothesized relationship between the mitochondrion and obesity. Mitochondrial economy can be relatively high (greater conservation of energy for proton pumping linked to ATP production with less generation of heat) or low (less conservation of energy for proton pumping linked to ATP production with greater generation of heat), which is influenced by mtDNA mutations that segregate with maternal geographic origins. Proposed is a positive feedback loop between mitochondrial damage and oxidant levels/inflammation contributing to adiposity. Under conditions of chronic positive energy balance (excess caloric intake, low ATP demand) mitochondria harboring mtDNA mutations associated with high economy will generate increased oxidants relative to those associated with relatively lower economy, contributing to oxidative stress and inflammatory processes. Individuals with high economy will also store calories (adipose tissue) to a greater extent than those with lower economy, however, over time, those with lower economy will also experience pathogenic levels of oxidative stress, inflammation and weight gain.
Mitochondrial Function
The mitochondrion is a multifunctional organelle that is responsible for many cellular functions including energy generation, cell growth [62] as well as cell death [63]. It is the hub of cellular metabolism where, in addition to fatty acid oxidation, caloric energy in the form of reducing equivalents NADH and FADH2 are converted to molecular energy (ATP), thermal energy and cellular oxidants via the coupling of electron transport, oxidative phosphorylation (OXPHOS) and proton pumping across the inner mitochondrial membrane. Energy derived from electrons as they move through the electron transport complexes is utilized to pump protons across the inner mitochondrial membrane to form an electrochemical gradient; this conserved energy is used to generate ATP at Complex V (ATP synthase). Energy not conserved for proton pumping is lost in the form of heat [64]. In addition, electrons can “leak out” and react with molecular oxygen to form superoxide, a reactive species that is rapidly converted to hydrogen peroxide, a potent cell-signaling molecule [65–68], or, when nitric oxide (·NO) is present, form peroxynitrite (ONOO−) [69]. Superoxide production is accentuated under conditions of excess reducing equivalent and ATP availability [70]; hence it is likely that this production serves as a feedback mechanism to regulate cellular metabolism and conserve caloric energy.
Mitochondrial Oxidative Stress & Obesity
Reactive species produced by the mitochondrion contribute to signaling for multiple cellular processes involving pathways that utilize proteins encoded by the nuclear genome including inflammation [71], cell death [72], and appetite control [73], as well as the MAP kinase and Akt pathways [74]. While mitochondrial oxidant production is essential for proper cell function, chronic, over-production of oxidants can be harmful. It has been previously demonstrated that mitochondria exhibit functional decline associated with aging [75], and this has also been linked to oxidative damage to mitochondrial DNA [76–78]. Oxidative stress has been implicated in numerous pathologies, including obesity and insulin resistance [50, 79]. Gudson et al. explored mitochondrial-nuclear interactions and susceptibility to Type 1 Diabetes (T1DM) using a transgenic mouse susceptible to T1DM [80, 81]. It was observed that mitochondrial DNA (mtDNA) variants (cytosine to adenine transversion) in NADH dehydrogenase subunit 2 directly affected ROS production from Complexes I and III. The adenine-containing allele conferred resistance to T1DM in the susceptible mouse model, and substituting for a cytosine-containing allele both increased ROS production and ameliorated the T1DM resistance. Similarly, Houštek et al. successfully linked defects in mitochondrial function and insulin sensitivity using a conplastic rat model [82]. Using two strains of rat with identical nuclear genomes and generating a conplastic strain, it was shown that mitochondrial genetic background directly impacts glucose and lipid metabolism. Overall, these observations strongly suggest that changes in mitochondrial function influenced by the mtDNA have effects on cellular processes whose regulation is classically attributed to the nucleus.
It has been reported using multiple cell and animal models that reactive oxygen species (ROS) play a major role in insulin resistance [79]. Using cell lines carrying transgenes for ROS scavengers including superoxide dismutase (CuZnSOD and MnSOD) and mitochondrially-targeted catalase, as well as treating the ob/ob mouse with a small-molecule antioxidant, Houstis et al. demonstrated that decreasing ROS restored insulin sensitivity and glucose homeostasis to varying degrees [79]. Mitochondrial morphology is also affected by hyperglycemia. Exposure to high glucose concentrations causes mitochondrial fragmentation (fission) as well as a simultaneous increase in ROS levels [83]. Interestingly, mitochondrial dynamics as measured by fission and fusion protein levels are impaired in obese patients, as discussed in the next section.
Mitochondrial biogenesis, function and obesity
Mitochondria within cells are dynamic; they migrate throughout cells, fuse and divide, and undergo synchronized turnover. Because the mitochondrion serves as a focal point of cellular metabolism, its biogenesis is essential for maintenance of proper cell and tissue function, in addition to maintaining the functional integrity of mitochondrial networks. Whereas mitochondrial biogenesis and dynamics have been the focus of many studies relating to neurodegenerative diseases, there is an emerging field of study that documents the role of mitochondrial biogenesis in obesity [84], as well as related metabolic disorders [85–87]. Mitofusin 2 (MFN2) is an essential outer mitochondrial membrane GTPase that plays an integral role in mitochondrial fusion. While commonly studied for its role in the neurological disorder Charcot-Marie-Tooth disease [88], MFN2 has recently been implicated as a regulatory mechanism in obesity [84]. Bach et al. determined that MFN2 controls the operation of the mitochondrial network in skeletal muscle and that repression of MFN2 impairs glucose oxidation and mitochondrial membrane potential. It is postulated that substrate oxidation and membrane potential are impaired when the mitochondrial electron transport chain is not operating at maximal activity. MFN2 plays an integral role in maintaining maximal activity of the respiratory chain as well as mitochondrial dynamics. Additionally, MFN2 gene expression is repressed in skeletal muscle of obese patients compared to lean, signifying the role of mitochondrial dynamics in metabolism and obesity [84]. It has also been demonstrated in numerous studies that patients with obesity and T2DM have mitochondrial dysfunction in multiple tissues, including liver and skeletal muscle [85–87]. Deficiencies in mitochondrial number and mtDNA content [85], electron transport [86], and PGC-1α expression [87] have been reported in obese patients. Although the majority of these functional and biogenesis-related deficiencies are associated with nuclear encoded genes and proteins, their expression is often regulated to the metabolic requirements of the cell, which will be linked to mitochondrial function [89, 90].
Mitochondrial genetics
The mitochondrion contains its own DNA, the mtDNA that is distinct from the nuclear genome. Because each cell can contain hundreds to thousands of mitochondria (mitochondrial number varies across tissues) and each mitochondrion contains 2–10 copies of mtDNA, there are typically thousands of mtDNA copies per cell [91, 92]. This maternally inherited, double – stranded, closed circular genome is ~16.5 kilobases in humans and encodes genes for 13 polypeptides essential for OXPHOS and its own translational machinery (22 tRNAs and 2 rRNAs) for proper translation of these proteins (the genetic code of mtDNA differs from nuclear DNA) [93]. The remaining proteins required for assembly of OXPHOS subunits and the mitochondrion itself are encoded by the nuclear genome. Hence, the organelle is a fascinating representation of a complex, symbiotic relationship between two distinct genomes.
There is a high degree of homology in the mitochondrial genome of humans and other mammals [94, 95]. Due to its location within the mitochondrial matrix, lack of protective histone wrapping as well as a comparatively limited repair mechanism relative to the nucleus, mtDNA is more vulnerable to oxidative modifications that accumulate over time [78]. It has also been shown that mtDNA has a significantly higher mutation/fixation rate than the nuclear genome, with mtDNA fixing 10–12 times more substitutions than nDNA [96]. This higher mutation rate contributes to variation in mtDNA sequence and the propensity for heteroplasmy. MtDNA heteroplasmy is the existence of more than one mtDNA sequence within an individual. It has been estimated that ~25% of individuals have germline mtDNA heteroplasmy [97]. Of these individuals, ~60% have mutations that were either in the non-coding region or were silent coding region mutations, with the balance (~40%) being missense mutations. In addition, the ratios of heteroplasmic mtDNAs can change over meiotic and/or mitotic cell divisions via a process referred to as “replicative segregation”. Replicative segregation occurs during cell division, where relative proportions of mtDNAs from heteroplasmic cells can randomly drift during cytokinesis in the formation of daughter cells, and in subsequent radiating cell lineages resulting in expansion of multiple mtDNA variants. These features of mitochondrial genetics have resulted in a marked variation of mtDNA sequences (or haplotypes) that can identify maternal geographic origins of a human lineage. In fact, the migration of humans out of Africa has been mapped by changes in mtDNA sequence [98, 99], and these changes persist in modern populations. For example, the greatest haplogroup (groups that share common polymorphisms) diversity is seen within haplogroup L, but the majority of both ancient and modern populations with African origins share specific, ancient mtDNA polymorphisms [100]. Interestingly, Ruiz-Pesini et al. reported that ancient humans accumulated a greater proportion of missense mutations as they migrated farther north, and postulated that these mutations contributed to increased generation of heat in harsh, cold climates [101]. The mechanism by which body heat production was increased is hypothesized to be a decreased conservation of energy during proton translocation across the inner membrane as a result of the greater frequency of missense mutations. The rationale and implications of this evolutionary adaptation of “mitochondrial economy” are discussed in the following sections.
Mitochondrial Economy
Mitochondrial economy describes how the mitochondrion uses consumed oxygen to generate ATP, heat and oxidants [102]. Mitochondria that use less oxygen to generate the same amount of ATP compared to mitochondria that require more oxygen are considered more economical. It is suggested that, under conditions of high calorie intake and low energetic demand, mitochondria considered “high-economy” will be more likely to donate electrons to form oxidants than to generate heat or ATP. This scenario is also true for “less economical” mitochondria, though to a lesser degree since these mitochondria use more electrons to generate ATP and thus, lose more energy in the form of heat.
Evolution & the mitochondrial paradigm of disease
Alterations in mitochondrial function to promote survival have been documented in numerous species including the bar-headed goose [103] and the blue and dwarf blue sheep of Asia [104]. Adaptations in prehistoric humans may have also occurred. Ancient populations in Sub-Saharan Africa (ancestors to contemporary African as well as the majority of African-American populations) subsisted on a diet of primarily plant carbohydrates [105] and were also under constant energy demand due to food scarcity. Consequently, the evolution of mitochondria that generated ATP efficiently under conditions of low calorie intake and without excess generation of heat would have been advantageous. Mitochondria that met these criteria contributed to increased fitness, allowing populations to thrive and bear offspring. As populations migrated northward out of Africa, they encountered drastic changes in both climate and diet [105]. The need to generate more heat became paramount to survival and reproductive fitness, and therefore missense mutations that resulted in lower mitochondrial economy and the increased production of heat would be evolutionary advantageous [101]. Energy demand remained a major selective pressure, but demand for both heat and energy could be met, due to a change from a mostly vegetarian diet that was low in both protein and fat, to one of both high protein and high fat in the form of fish and other animals [105]. These northern migrant populations include Eurasians as well as populations that settled in what is now Europe [106]. Today, most Caucasians can trace their mitochondrial genetic backgrounds to these northern haplogroups.
Implications for obesity
Mitochondrial mutations became fixed in these populations over thousands of years as humans radiated out of Africa and encountered changes in climate and diet. In contrast, contemporary humans typically have a more sedentary lifestyle and lower energy demands. While it is unclear whether mitochondria will adapt to these changes, currently, substantial numbers of individuals in the western world live in a state of chronic positive energy balance (high amount of substrates with low ATP demand) and climate controlled environments. These conditions promote caloric storage (fat deposition) and systemic inflammation possibly via mitochondrial oxidant production [107–109]. Differential increases in mitochondrial oxidant production under conditions of chronic positive energy balance could be a major contributory factor to individual susceptibility to weight gain and obesity. This may also explain racial susceptibility to obesity as African-Americans have a higher level of systemic oxidative stress compared to Caucasians [110]. Consistent with differences in mitochondrial economy, individuals with African mtDNAs will have a robust oxidant response under conditions of positive energy balance relative to those of Eurasian descent. While positive energy balance will result in sustained oxidant production in individuals of both African and Eurasian descent, those of African origins will generate more oxidants and therefore will cross pathological thresholds earlier; however, individuals harboring Eurasian mtDNAs will also cross thresholds, albeit comparatively later due to lower sustained oxidant production.
During their evolutionary history the cell and mitochondrion evolved to deal with environmental challenges and utilize available resources to stave off life-threatening conditions (e.g. infection) in order to successfully reproduce. For humans, the majority of this history did not involve chronic abundance of food or sedentary lifestyles; hence the mitochondria and cell did not evolve under conditions of chronic positive energy balance. Today, positive energy balance is commonplace in the Western world and is often coupled with a sedentary lifestyle. Under these conditions, fat storage is evolutionarily normal. It is perhaps in this light that a greater understanding for the molecular basis of disease development could be ascertained. So-called mitochondrial “dysfunction” in response to changing endogenous environmental cues (e.g. excess calories and sedentary lifestyle) initially is not dysfunction, but a normal adaptive response consistent with the prehistoric environment that influenced its evolution. It is the chronic nature of these modern changes that drives a chronic “normal” mitochondrial response, which ultimately manifests in cellular damage and dysfunction over time.
Undoubtedly the interactions between the mitochondrion and the nucleus are important catalysts in dictating response to environmental cues. Because mtDNA sequence changes can alter mitochondrial function that involves the inter-related balance of ATP production, heat generation and oxidant generation, these factors will impact inflammation and nuclear gene expression and therefore influence individual susceptibility to certain diseases associated with metabolism, such as obesity. An important feature not discussed in this review is the role of the nucleus in this susceptibility. As hinted at above, the combination of nuclear and mitochondrial genetic complements of an individual will ultimately dictate how they respond to environmental challenges. This may explain why it has been difficult to identify the common basis for individual disease susceptibility using exclusively Mendelian approaches. Instead, it is likely the result of both Mendelian and mitochondrial genetic complements, which evolutionarily, can provide the greatest flexibility for adaptation to environmental challenges. The rapid fixation of mutations in the mtDNA, along with its uni-parental inheritance provides a swift means (evolutionarily speaking) for adjusting functional aspects of mitochondrial economy, whereas the bi-parental inheritance of the nucleus allows for selection of genetic complements from both parents that can increase fitness in combination with the mtDNA background for a greater chance of survival and reproductive success. Furthermore, it is possible that the mtDNA exerts its own selective pressure on the nuclear genome by influencing selection of ideal nuclear allele combinations for reproductive success and increased survival. Examining any potential role for the mtDNA in nuclear allelic selection could significantly expand our understanding of individual susceptibility to disease, including obesity.
While sequence variation in mtDNA is widely used in anthropologic [111] and forensic [112] applications, the notion that this sequence variation and/or the interactions between the mitochondrial and nuclear genomes can impact disease susceptibility is relatively new [113]. Epidemiological studies of different human mitochondrial haplogroups associated with disease have been largely focused on either a single, or very few mitochondrial haplogroups [114–117], and generally do not compare haplogroups that are significantly divergent. Studies have been performed to address the role of mtDNA background on mitochondrial and cell function and have been contradictory; however they utilize transformed or immortalized cell lines and therefore have certain drawbacks [118–120]. Studies utilizing conplastic animals have shown that mtDNA background can have effects upon function and certain pathologies and therefore do appear to be consistent with the notion of the mitochondrial paradigm of disease originally proposed by Wallace [113]. A potential drawback of congenic or conplastic animal models generated via standard approaches (i.e. congenic breeding) [121] is the possibility that some nuclear genes from the unsought background remain in the congenic progeny, even after multiple back-crosses. Assuming Hardy-Weinberg equilibrium, a nuclear genome of ~30,000 genes will potentially have a minimum of ~30 genes from the unsought nuclear genome using a breeding strategy to yield an estimated 99.9% “pure” nuclear background. Whether these ~30 genes are identical or different between progeny will depend on the means of their selection (via mitochondrial and/or Mendelian factors) or due to random events within offspring.
In order to definitively investigate the role of mitochondrial genetics on disease susceptibility and/or progression, a model must be selected that eliminates uncontrolled variation in nuclear genetics. One potential model is the Mitochondrial-Nuclear-Exchange model used by Fetterman et al. [122]. Animals used in this study were generated via complete transplant of the nucleus to an enucleated embryo of rodents with differing mtDNA. The resultant progeny harbored the complete nuclear genome of one mouse and the complete mitochondrial genome of the other. This method bypasses Mendelian selection that occurs during breeding of mice. Using a model such as this would allow for experimentation to determine if mitochondrial genetics directly impacts obesity and other related metabolic diseases. The use of this model would also allow for exploration of any effect the mitochondrial genome exerts on nuclear allelic selection. As previously stated, examining the potential for the mitochondrion to influence nuclear gene selection could provide additional insight into mitochondrial-nuclear interactions and how they relate to disease susceptibility. Lastly, selection of an appropriate animal model is imperative as rising obesity trends have been documented in numerous species – as discussed below.
While clinical and financial implications have kept human obesity in the forefront of basic and translational research, obesity is not exclusively a human problem. Reported by Allison et al in 2011 [123], increased body weight has been documented over the past 10–15 years in primates [124–127], laboratory [128, 129] and feral rodents [130] and domestic house pets [131–133].
Bauer’s review of research in macaques [126] highlights spontaneous metabolic changes occurring in a species that evolved to hunt and forage for food in an environment where energy demand was also high. Animals in captivity are typically fed on a regular schedule. In addition to the manipulations of food intake, captive animals are less active, compared to their counterparts in the wild. Studies by both Kemnitz [124] and Jen [125] show variations in adiposity and insulin levels in captive macaques, respectively. Videan et al. have reported similar findings in female, but not male captive chimpanzees [127], suggesting that sexual dimorphism with respect to disease susceptibility differs between species.
Keenan et al. reported in 1997 that Sprague-Dawley rats fed ad libitum over-eat and this resulted in negative impact on survival [129]. Similar to previously mentioned data from macaques, studies of obesity in rodents are typically performed in a laboratory setting in a controlled environment. While these conditions are desirable to eliminate as many variables as possible, laboratory animals are housed in a small space with unlimited supply of food. As with primates, laboratory rodents have a substantially lower energy demand, and without scavenging for food and depleting energy stores, they will, in a sense, be overeating. When examining data collected from feral rodents, Allison et al. showed similar trends of weight gain in feral rodents compared to their laboratory counterparts [123]. While intriguing, it should be noted that the data used by Allison et al. reporting increased weight in feral rodents were collected from wild rodents living in or near city centers, in close proximity to humans. This is important as densely populated areas provide a comparatively larger food source than undeveloped land, where scavenging for food is a more arduous process.
Lastly, similar trends of rising obesity have also been reported in domestic cats and dogs. It is hypothesized that the increase in house pet obesity is largely due to diet and exercise - overfeeding coupled with a sedentary lifestyle not unlike humans [132, 133]. Since the health of house pets is closely linked to the dietary and exercise habits of their owners, it is perhaps not surprising that obesity in domestic cats and dogs has risen over the last 20 years. The results of the above-mentioned studies are interesting and support the hypothesis posed herein, that obesity is, at least in part, a result of “normal” physiological function in an environment of low energy demand and caloric excess.
Summary
Obesity is represents a major burden upon healthcare costs and contributor of increased morbidity and mortality in developed countries. While essentially a problem related to chronic positive energy balance, the etiology for individual susceptibility to obesity is complex and perhaps not that dissimilar to risk for other related metabolic diseases. Although studies have clearly shown that single nuclear gene mutations can cause obesity, the frequency of these mutations in the human population is too low to sufficiently account for the rapidly growing incidence of obesity and weight gain in the western world. Because inflammation, oxidative stress and racial origins appear to influence relative risk for obesity, it is logical to hypothesize that its etiology could involve a cellular component reflective of these features. In this regard, mitochondria are directly involved in cellular metabolism, are major sources (and targets) of oxidants, and have been shown to influence inflammatory response. Finally, the mtDNA is transmitted maternally and represents maternal geographic origin (e.g. race). Mitochondrial function (and mtDNA diversity) was influenced by prehistoric selection events that promoted mitochondrial economy suited for survival and reproduction based upon environmental challenges and food availability. Today, excess caloric intake and sedentary lifestyles result in a chronic caloric storage scenario for the mitochondrion, which is an evolutionarily “normal” response. It is the chronic nature of this process however, that ultimately has pathogenic impact.
Obesity is an environmental–genetic disease and a consequence of modern lifestyle.
Nuclear gene mutations do not account for obesity prevalence or racial disparities.
A role of the mitochondrion in obesity is hypothesized.
MtDNA mutations impact metabolism and adaptation to environmental changes.
Prehistoric selective events for mtDNA mutation impact contemporary disease.
Acknowledgments
This study was funded by NIH grants RO1 HL94518 (SWB) and HL103859 (SWB), and an American Heart Association predoctoral fellowship 11PRE7650033 (KDS). The authors wish to thank Kyle Feeley for his valuable comments and edits.
Footnotes
Publisher's Disclaimer: This is a PDF file of an unedited manuscript that has been accepted for publication. As a service to our customers we are providing this early version of the manuscript. The manuscript will undergo copyediting, typesetting, and review of the resulting proof before it is published in its final citable form. Please note that during the production process errors may be discovered which could affect the content, and all legal disclaimers that apply to the journal pertain.
References
- 1.WHO. Obesity and overweight Fact Sheet #311. 2013 Mar; Fact Sheet - Website. cited 2013 June 12, 2013. Available from: http://www.who.int/mediacentre/factsheets/fs311/en/
- 2.CDC. Deaths and Mortality 2011. 2013 Apr 5; [cited 2013; Available from: http://www.cdc.gov/nchs/fastats/deaths.htm.
- 3.CDC. Overweight and Obesity. 2012 Apr 27; [cited 2013; Available from: http://www.cdc.gov/obesity/adult/defining.html.
- 4.Ogden CL, et al. Prevalence of obesity in the United States, 2009–2010. NCHS Data Brief. 2012;(82):1–8. [PubMed] [Google Scholar]
- 5.Eckel RH, Grundy SM, Zimmet PZ. The metabolic syndrome. Lancet. 2005;365(9468):1415–28. doi: 10.1016/S0140-6736(05)66378-7. [DOI] [PubMed] [Google Scholar]
- 6.Ogden CL, et al. Obesity and socioeconomic status in adults: United States, 2005–2008. NCHS Data Brief. 2010;(50):1–8. [PubMed] [Google Scholar]
- 7.Bambra CL, et al. Tackling inequalities in obesity: a protocol for a systematic review of the effectiveness of public health interventions at reducing socioeconomic inequalities in obesity among adults. Syst Rev. 2013;2(1):27. doi: 10.1186/2046-4053-2-27. [DOI] [PMC free article] [PubMed] [Google Scholar]
- 8.Wang Y, Zhang Q. Are American children and adolescents of low socioeconomic status at increased risk of obesity? Changes in the association between overweight and family income between 1971 and 2002. Am J Clin Nutr. 2006;84(4):707–16. doi: 10.1093/ajcn/84.4.707. [DOI] [PubMed] [Google Scholar]
- 9.Zhang Q, Wang Y. Trends in the association between obesity and socioeconomic status in U.S. adults: 1971 to 2000. Obes Res. 2004;12(10):1622–32. doi: 10.1038/oby.2004.202. [DOI] [PubMed] [Google Scholar]
- 10.Flegal KM, et al. Prevalence of obesity and trends in the distribution of body mass index among US adults, 1999–2010. JAMA. 2012;307(5):491–7. doi: 10.1001/jama.2012.39. [DOI] [PubMed] [Google Scholar]
- 11.Clinic M. Obesity Risk Factors 2012. 2012 Aug 3; [cited 2013; Available from: http://www.mayoclinic.com/health/obesity/DS00314/DSECTION=risk-factors.
- 12.Schonfeld-Warden N, Warden CH. Pediatric obesity. An overview of etiology and treatment. Pediatr Clin North Am. 1997;44(2):339–61. doi: 10.1016/s0031-3955(05)70480-6. [DOI] [PubMed] [Google Scholar]
- 13.Hill JO, Peters JC. Environmental contributions to the obesity epidemic. Science. 1998;280(5368):1371–4. doi: 10.1126/science.280.5368.1371. [DOI] [PubMed] [Google Scholar]
- 14.Hu FB, et al. Television watching and other sedentary behaviors in relation to risk of obesity and type 2 diabetes mellitus in women. JAMA. 2003;289(14):1785–91. doi: 10.1001/jama.289.14.1785. [DOI] [PubMed] [Google Scholar]
- 15.Hu FB. Sedentary lifestyle and risk of obesity and type 2 diabetes. Lipids. 2003;38(2):103–8. doi: 10.1007/s11745-003-1038-4. [DOI] [PubMed] [Google Scholar]
- 16.Farooqi IS, O’Rahilly S. Monogenic human obesity syndromes. Recent Prog Horm Res. 2004;59:409–24. doi: 10.1210/rp.59.1.409. [DOI] [PubMed] [Google Scholar]
- 17.MacDougald OA, et al. Regulated expression of the obese gene product (leptin) in white adipose tissue and 3T3-L1 adipocytes. Proc Natl Acad Sci U S A. 1995;92(20):9034–7. doi: 10.1073/pnas.92.20.9034. [DOI] [PMC free article] [PubMed] [Google Scholar]
- 18.Chin-Chance C, Polonsky KS, Schoeller DA. Twenty-four-hour leptin levels respond to cumulative short-term energy imbalance and predict subsequent intake. J Clin Endocrinol Metab. 2000;85(8):2685–91. doi: 10.1210/jcem.85.8.6755. [DOI] [PubMed] [Google Scholar]
- 19.Schwartz MW, et al. Identification of targets of leptin action in rat hypothalamus. J Clin Invest. 1996;98(5):1101–6. doi: 10.1172/JCI118891. [DOI] [PMC free article] [PubMed] [Google Scholar]
- 20.Benoit SC, et al. Insulin and leptin as adiposity signals. Recent Prog Horm Res. 2004;59:267–85. doi: 10.1210/rp.59.1.267. [DOI] [PubMed] [Google Scholar]
- 21.Mars M, et al. Fasting leptin and appetite responses induced by a 4-day 65%-energy-restricted diet. Int J Obes (Lond) 2006;30(1):122–8. doi: 10.1038/sj.ijo.0803070. [DOI] [PubMed] [Google Scholar]
- 22.Ronnemaa T, et al. Relation between plasma leptin levels and measures of body fat in identical twins discordant for obesity. Ann Intern Med. 1997;126(1):26–31. doi: 10.7326/0003-4819-126-1-199701010-00004. [DOI] [PubMed] [Google Scholar]
- 23.Ryan AS, et al. Plasma adiponectin and leptin levels, body composition, and glucose utilization in adult women with wide ranges of age and obesity. Diabetes Care. 2003;26(8):2383–8. doi: 10.2337/diacare.26.8.2383. [DOI] [PubMed] [Google Scholar]
- 24.Dubern B, Clement K. Leptin and leptin receptor-related monogenic obesity. Biochimie. 2012;94(10):2111–5. doi: 10.1016/j.biochi.2012.05.010. [DOI] [PubMed] [Google Scholar]
- 25.Montague CT, et al. Congenital leptin deficiency is associated with severe early-onset obesity in humans. Nature. 1997;387(6636):903–8. doi: 10.1038/43185. [DOI] [PubMed] [Google Scholar]
- 26.Licinio J, et al. Phenotypic effects of leptin replacement on morbid obesity, diabetes mellitus, hypogonadism, and behavior in leptin-deficient adults. Proc Natl Acad Sci U S A. 2004;101(13):4531–6. doi: 10.1073/pnas.0308767101. [DOI] [PMC free article] [PubMed] [Google Scholar]
- 27.Zhang Y, et al. Positional cloning of the mouse obese gene and its human homologue. Nature. 1994;372(6505):425–32. doi: 10.1038/372425a0. [DOI] [PubMed] [Google Scholar]
- 28.Cottrell EC, Mercer JG. Leptin receptors. Handb Exp Pharmacol. 2012;(209):3–21. doi: 10.1007/978-3-642-24716-3_1. [DOI] [PubMed] [Google Scholar]
- 29.Clement K, et al. A mutation in the human leptin receptor gene causes obesity and pituitary dysfunction. Nature. 1998;392(6674):398–401. doi: 10.1038/32911. [DOI] [PubMed] [Google Scholar]
- 30.Oh KS, et al. Swim training improves leptin receptor deficiency-induced obesity and lipid disorder by activating uncoupling proteins. Exp Mol Med. 2007;39(3):385–94. doi: 10.1038/emm.2007.43. [DOI] [PubMed] [Google Scholar]
- 31.Jezek P. Possible physiological roles of mitochondrial uncoupling proteins--UCPn. Int J Biochem Cell Biol. 2002;34(10):1190–206. doi: 10.1016/s1357-2725(02)00061-4. [DOI] [PubMed] [Google Scholar]
- 32.Huszar D, et al. Targeted disruption of the melanocortin-4 receptor results in obesity in mice. Cell. 1997;88(1):131–41. doi: 10.1016/s0092-8674(00)81865-6. [DOI] [PubMed] [Google Scholar]
- 33.Fan W, et al. Role of melanocortinergic neurons in feeding and the agouti obesity syndrome. Nature. 1997;385(6612):165–8. doi: 10.1038/385165a0. [DOI] [PubMed] [Google Scholar]
- 34.Larsen LH, et al. Prevalence of mutations and functional analyses of melanocortin 4 receptor variants identified among 750 men with juvenile-onset obesity. J Clin Endocrinol Metab. 2005;90(1):219–24. doi: 10.1210/jc.2004-0497. [DOI] [PubMed] [Google Scholar]
- 35.Farooqi IS, et al. Clinical spectrum of obesity and mutations in the melanocortin 4 receptor gene. N Engl J Med. 2003;348(12):1085–95. doi: 10.1056/NEJMoa022050. [DOI] [PubMed] [Google Scholar]
- 36.Roach JC, et al. Analysis of genetic inheritance in a family quartet by whole-genome sequencing. Science. 2010;328(5978):636–9. doi: 10.1126/science.1186802. [DOI] [PMC free article] [PubMed] [Google Scholar]
- 37.CDC. Behavior, environment, and genetic factors all have a role in causing people to be overweight and obese. 2012 May 10; Available from: http://www.cdc.gov/genomics/resources/diseases/obesity/
- 38.Ridker PM, et al. C-reactive protein and other markers of inflammation in the prediction of cardiovascular disease in women. N Engl J Med. 2000;342(12):836–43. doi: 10.1056/NEJM200003233421202. [DOI] [PubMed] [Google Scholar]
- 39.Visser M, et al. Elevated C-reactive protein levels in overweight and obese adults. JAMA. 1999;282(22):2131–5. doi: 10.1001/jama.282.22.2131. [DOI] [PubMed] [Google Scholar]
- 40.Yudkin JS, et al. C-reactive protein in healthy subjects: associations with obesity, insulin resistance, and endothelial dysfunction: a potential role for cytokines originating from adipose tissue? Arterioscler Thromb Vasc Biol. 1999;19(4):972–8. doi: 10.1161/01.atv.19.4.972. [DOI] [PubMed] [Google Scholar]
- 41.Hak AE, et al. Associations of C-reactive protein with measures of obesity, insulin resistance, and subclinical atherosclerosis in healthy, middle-aged women. Arterioscler Thromb Vasc Biol. 1999;19(8):1986–91. doi: 10.1161/01.atv.19.8.1986. [DOI] [PubMed] [Google Scholar]
- 42.Chambers JC, et al. C-reactive protein, insulin resistance, central obesity, and coronary heart disease risk in Indian Asians from the United Kingdom compared with European whites. Circulation. 2001;104(2):145–50. doi: 10.1161/01.cir.104.2.145. [DOI] [PubMed] [Google Scholar]
- 43.Hotamisligil GS, Shargill NS, Spiegelman BM. Adipose expression of tumor necrosis factor-alpha: direct role in obesity-linked insulin resistance. Science. 1993;259(5091):87–91. doi: 10.1126/science.7678183. [DOI] [PubMed] [Google Scholar]
- 44.Hotamisligil GS, et al. Increased adipose tissue expression of tumor necrosis factor-alpha in human obesity and insulin resistance. J Clin Invest. 1995;95(5):2409–15. doi: 10.1172/JCI117936. [DOI] [PMC free article] [PubMed] [Google Scholar]
- 45.Uysal KT, et al. Protection from obesity-induced insulin resistance in mice lacking TNF-alpha function. Nature. 1997;389(6651):610–4. doi: 10.1038/39335. [DOI] [PubMed] [Google Scholar]
- 46.Xu H, et al. Chronic inflammation in fat plays a crucial role in the development of obesity-related insulin resistance. J Clin Invest. 2003;112(12):1821–30. doi: 10.1172/JCI19451. [DOI] [PMC free article] [PubMed] [Google Scholar]
- 47.Weisberg SP, et al. Obesity is associated with macrophage accumulation in adipose tissue. J Clin Invest. 2003;112(12):1796–808. doi: 10.1172/JCI19246. [DOI] [PMC free article] [PubMed] [Google Scholar]
- 48.Juge-Aubry CE, Henrichot E, Meier CA. Adipose tissue: a regulator of inflammation. Best Pract Res Clin Endocrinol Metab. 2005;19(4):547–66. doi: 10.1016/j.beem.2005.07.009. [DOI] [PubMed] [Google Scholar]
- 49.Dandona P, Aljada A, Bandyopadhyay A. Inflammation: the link between insulin resistance, obesity and diabetes. Trends Immunol. 2004;25(1):4–7. doi: 10.1016/j.it.2003.10.013. [DOI] [PubMed] [Google Scholar]
- 50.Keaney JF, Jr, et al. Obesity and systemic oxidative stress: clinical correlates of oxidative stress in the Framingham Study. Arterioscler Thromb Vasc Biol. 2003;23(3):434–9. doi: 10.1161/01.ATV.0000058402.34138.11. [DOI] [PubMed] [Google Scholar]
- 51.Libby P, Ridker PM, Maseri A. Inflammation and atherosclerosis. Circulation. 2002;105(9):1135–43. doi: 10.1161/hc0902.104353. [DOI] [PubMed] [Google Scholar]
- 52.Hansson GK. Inflammation, atherosclerosis, and coronary artery disease. N Engl J Med. 2005;352(16):1685–95. doi: 10.1056/NEJMra043430. [DOI] [PubMed] [Google Scholar]
- 53.Pickup JC. Inflammation and activated innate immunity in the pathogenesis of type 2 diabetes. Diabetes Care. 2004;27(3):813–23. doi: 10.2337/diacare.27.3.813. [DOI] [PubMed] [Google Scholar]
- 54.Grundy SM. Inflammation, hypertension, and the metabolic syndrome. JAMA. 2003;290(22):3000–2. doi: 10.1001/jama.290.22.3000. [DOI] [PubMed] [Google Scholar]
- 55.Thompson D, Pepys MB, Wood SP. The physiological structure of human C-reactive protein and its complex with phosphocholine. Structure. 1999;7(2):169–77. doi: 10.1016/S0969-2126(99)80023-9. [DOI] [PubMed] [Google Scholar]
- 56.Eder K, et al. The major inflammatory mediator interleukin-6 and obesity. Inflamm Res. 2009;58(11):727–36. doi: 10.1007/s00011-009-0060-4. [DOI] [PubMed] [Google Scholar]
- 57.Fujii H, et al. C-reactive protein alters antioxidant defenses and promotes apoptosis in endothelial progenitor cells. Arterioscler Thromb Vasc Biol. 2006;26(11):2476–82. doi: 10.1161/01.ATV.0000242794.65541.02. [DOI] [PubMed] [Google Scholar]
- 58.Beutler B, Cerami A. Cachectin (tumor necrosis factor): a macrophage hormone governing cellular metabolism and inflammatory response. Endocr Rev. 1988;9(1):57–66. doi: 10.1210/edrv-9-1-57. [DOI] [PubMed] [Google Scholar]
- 59.Dinarello CA. Infection, fever, and exogenous and endogenous pyrogens: some concepts have changed. J Endotoxin Res. 2004;10(4):201–22. doi: 10.1179/096805104225006129. [DOI] [PubMed] [Google Scholar]
- 60.Sidoti-de Fraisse C, et al. TNF-alpha activates at least two apoptotic signaling cascades. Oncogene. 1998;17(13):1639–51. doi: 10.1038/sj.onc.1202094. [DOI] [PubMed] [Google Scholar]
- 61.Kim JJ, et al. TNF-alpha-induced ROS production triggering apoptosis is directly linked to Romo1 and Bcl-X(L) Cell Death Differ. 2010;17(9):1420–34. doi: 10.1038/cdd.2010.19. [DOI] [PubMed] [Google Scholar]
- 62.Nunez L, et al. Cell proliferation depends on mitochondrial Ca2+ uptake: inhibition by salicylate. J Physiol. 2006;571(Pt 1):57–73. doi: 10.1113/jphysiol.2005.100586. [DOI] [PMC free article] [PubMed] [Google Scholar]
- 63.Green DR, Reed JC. Mitochondria and apoptosis. Science. 1998;281(5381):1309–12. doi: 10.1126/science.281.5381.1309. [DOI] [PubMed] [Google Scholar]
- 64.Alberts B, Johnson A, Lewis J, Raff M, Roberts K, Walter P. Molecular Biology of the Cell. 4. New York, NY: Garland Science; 2002. p. 1463. [Google Scholar]
- 65.Rhee SG. Redox signaling: hydrogen peroxide as intracellular messenger. Exp Mol Med. 1999;31(2):53–9. doi: 10.1038/emm.1999.9. [DOI] [PubMed] [Google Scholar]
- 66.Rhee SG, et al. Hydrogen peroxide: a key messenger that modulates protein phosphorylation through cysteine oxidation. Sci STKE. 2000;2000(53):pe1. doi: 10.1126/stke.2000.53.pe1. [DOI] [PubMed] [Google Scholar]
- 67.Hancock JT, Desikan R, Neill SJ. Role of reactive oxygen species in cell signalling pathways. Biochem Soc Trans. 2001;29(Pt 2):345–50. doi: 10.1042/0300-5127:0290345. [DOI] [PubMed] [Google Scholar]
- 68.Cadenas E. Mitochondrial free radical production and cell signaling. Mol Aspects Med. 2004;25(1–2):17–26. doi: 10.1016/j.mam.2004.02.005. [DOI] [PubMed] [Google Scholar]
- 69.Valdez LB, et al. Reactions of peroxynitrite in the mitochondrial matrix. Free Radic Biol Med. 2000;29(3–4):349–56. doi: 10.1016/s0891-5849(00)00301-4. [DOI] [PubMed] [Google Scholar]
- 70.Hansford RG, Hogue BA, Mildaziene V. Dependence of H2O2 formation by rat heart mitochondria on substrate availability and donor age. J Bioenerg Biomembr. 1997;29(1):89–95. doi: 10.1023/a:1022420007908. [DOI] [PubMed] [Google Scholar]
- 71.Rogers RJ, Monnier JM, Nick HS. Tumor necrosis factor-alpha selectively induces MnSOD expression via mitochondria-to-nucleus signaling, whereas interleukin-1beta utilizes an alternative pathway. J Biol Chem. 2001;276(23):20419–27. doi: 10.1074/jbc.M008915200. [DOI] [PubMed] [Google Scholar]
- 72.Fleury C, Mignotte B, Vayssiere JL. Mitochondrial reactive oxygen species in cell death signaling. Biochimie. 2002;84(2–3):131–41. doi: 10.1016/s0300-9084(02)01369-x. [DOI] [PubMed] [Google Scholar]
- 73.Yamagishi SI, et al. Leptin induces mitochondrial superoxide production and monocyte chemoattractant protein-1 expression in aortic endothelial cells by increasing fatty acid oxidation via protein kinase A. J Biol Chem. 2001;276(27):25096–100. doi: 10.1074/jbc.M007383200. [DOI] [PubMed] [Google Scholar]
- 74.Fang Y, et al. Bile acids induce mitochondrial ROS, which promote activation of receptor tyrosine kinases and signaling pathways in rat hepatocytes. Hepatology. 2004;40(4):961–71. doi: 10.1002/hep.20385. [DOI] [PubMed] [Google Scholar]
- 75.Trounce IA, et al. Assessment of mitochondrial oxidative phosphorylation in patient muscle biopsies, lymphoblasts, and transmitochondrial cell lines. Methods Enzymol. 1996;264:484–509. doi: 10.1016/s0076-6879(96)64044-0. [DOI] [PubMed] [Google Scholar]
- 76.James AM, Murphy MP. How mitochondrial damage affects cell function. J Biomed Sci. 2002;9(6 Pt 1):475–87. doi: 10.1159/000064721. [DOI] [PubMed] [Google Scholar]
- 77.Wei YH, et al. Oxidative damage and mutation to mitochondrial DNA and age-dependent decline of mitochondrial respiratory function. Ann N Y Acad Sci. 1998;854:155–70. doi: 10.1111/j.1749-6632.1998.tb09899.x. [DOI] [PubMed] [Google Scholar]
- 78.Yakes FM, Van Houten B. Mitochondrial DNA damage is more extensive and persists longer than nuclear DNA damage in human cells following oxidative stress. Proc Natl Acad Sci U S A. 1997;94(2):514–9. doi: 10.1073/pnas.94.2.514. [DOI] [PMC free article] [PubMed] [Google Scholar]
- 79.Houstis N, Rosen ED, Lander ES. Reactive oxygen species have a causal role in multiple forms of insulin resistance. Nature. 2006;440(7086):944–8. doi: 10.1038/nature04634. [DOI] [PubMed] [Google Scholar]
- 80.Gusdon AM, et al. Nuclear and mitochondrial interaction involving mt-Nd2 leads to increased mitochondrial reactive oxygen species production. J Biol Chem. 2007;282(8):5171–9. doi: 10.1074/jbc.M609367200. [DOI] [PubMed] [Google Scholar]
- 81.Gusdon AM, Votyakova TV, Mathews CE. mt-Nd2a suppresses reactive oxygen species production by mitochondrial complexes I and III. J Biol Chem. 2008;283(16):10690–7. doi: 10.1074/jbc.M708801200. [DOI] [PMC free article] [PubMed] [Google Scholar]
- 82.Houstek J, et al. Nonsynonymous variants in mt-Nd2, mt-Nd4, and mt-Nd5 are linked to effects on oxidative phosphorylation and insulin sensitivity in rat conplastic strains. Physiol Genomics. 2012;44(9):487–94. doi: 10.1152/physiolgenomics.00156.2011. [DOI] [PMC free article] [PubMed] [Google Scholar]
- 83.Yu T, Robotham JL, Yoon Y. Increased production of reactive oxygen species in hyperglycemic conditions requires dynamic change of mitochondrial morphology. Proc Natl Acad Sci U S A. 2006;103(8):2653–8. doi: 10.1073/pnas.0511154103. [DOI] [PMC free article] [PubMed] [Google Scholar]
- 84.Bach D, et al. Mitofusin-2 determines mitochondrial network architecture and mitochondrial metabolism. A novel regulatory mechanism altered in obesity. J Biol Chem. 2003;278(19):17190–7. doi: 10.1074/jbc.M212754200. [DOI] [PubMed] [Google Scholar]
- 85.Ritov VB, et al. Deficiency of subsarcolemmal mitochondria in obesity and type 2 diabetes. Diabetes. 2005;54(1):8–14. doi: 10.2337/diabetes.54.1.8. [DOI] [PubMed] [Google Scholar]
- 86.Ritov VB, et al. Deficiency of electron transport chain in human skeletal muscle mitochondria in type 2 diabetes mellitus and obesity. Am J Physiol Endocrinol Metab. 2010;298(1):E49–58. doi: 10.1152/ajpendo.00317.2009. [DOI] [PMC free article] [PubMed] [Google Scholar]
- 87.Holmstrom MH, et al. Tissue-specific control of mitochondrial respiration in obesity-related insulin resistance and diabetes. Am J Physiol Endocrinol Metab. 2012;302(6):E731–9. doi: 10.1152/ajpendo.00159.2011. [DOI] [PubMed] [Google Scholar]
- 88.Cartoni R, Martinou JC. Role of mitofusin 2 mutations in the physiopathology of Charcot-Marie-Tooth disease type 2A. Exp Neurol. 2009;218(2):268–73. doi: 10.1016/j.expneurol.2009.05.003. [DOI] [PubMed] [Google Scholar]
- 89.Wu Z, et al. Mechanisms controlling mitochondrial biogenesis and respiration through the thermogenic coactivator PGC-1. Cell. 1999;98(1):115–24. doi: 10.1016/S0092-8674(00)80611-X. [DOI] [PubMed] [Google Scholar]
- 90.St-Pierre J, et al. Bioenergetic analysis of peroxisome proliferator-activated receptor gamma coactivators 1alpha and 1beta (PGC-1alpha and PGC-1beta) in muscle cells. J Biol Chem. 2003;278(29):26597–603. doi: 10.1074/jbc.M301850200. [DOI] [PubMed] [Google Scholar]
- 91.Wiesner RJ, Ruegg JC, Morano I. Counting target molecules by exponential polymerase chain reaction: copy number of mitochondrial DNA in rat tissues. Biochem Biophys Res Commun. 1992;183(2):553–9. doi: 10.1016/0006-291x(92)90517-o. [DOI] [PubMed] [Google Scholar]
- 92.Miller FJ, et al. Precise determination of mitochondrial DNA copy number in human skeletal and cardiac muscle by a PCR-based assay: lack of change of copy number with age. Nucleic Acids Res. 2003;31(11):e61. doi: 10.1093/nar/gng060. [DOI] [PMC free article] [PubMed] [Google Scholar]
- 93.Anderson S, et al. Sequence and organization of the human mitochondrial genome. Nature. 1981;290(5806):457–65. doi: 10.1038/290457a0. [DOI] [PubMed] [Google Scholar]
- 94.Anderson S, et al. Complete sequence of bovine mitochondrial DNA. Conserved features of the mammalian mitochondrial genome. J Mol Biol. 1982;156(4):683–717. doi: 10.1016/0022-2836(82)90137-1. [DOI] [PubMed] [Google Scholar]
- 95.Bibb MJ, et al. Sequence and gene organization of mouse mitochondrial DNA. Cell. 1981;26(2 Pt 2):167–80. doi: 10.1016/0092-8674(81)90300-7. [DOI] [PubMed] [Google Scholar]
- 96.Neckelmann N, et al. cDNA sequence of a human skeletal muscle ADP/ATP translocator: lack of a leader peptide, divergence from a fibroblast translocator cDNA, and coevolution with mitochondrial DNA genes. Proc Natl Acad Sci U S A. 1987;84(21):7580–4. doi: 10.1073/pnas.84.21.7580. [DOI] [PMC free article] [PubMed] [Google Scholar]
- 97.Li M, et al. Detecting heteroplasmy from high-throughput sequencing of complete human mitochondrial DNA genomes. Am J Hum Genet. 2010;87(2):237–49. doi: 10.1016/j.ajhg.2010.07.014. [DOI] [PMC free article] [PubMed] [Google Scholar]
- 98.Ballinger SW, et al. Southeast Asian mitochondrial DNA analysis reveals genetic continuity of ancient mongoloid migrations. Genetics. 1992;130(1):139–52. doi: 10.1093/genetics/130.1.139. [DOI] [PMC free article] [PubMed] [Google Scholar]
- 99.Excoffier L, Smouse PE, Quattro JM. Analysis of molecular variance inferred from metric distances among DNA haplotypes: application to human mitochondrial DNA restriction data. Genetics. 1992;131(2):479–91. doi: 10.1093/genetics/131.2.479. [DOI] [PMC free article] [PubMed] [Google Scholar]
- 100.Salas A, et al. Charting the ancestry of African Americans. Am J Hum Genet. 2005;77(4):676–80. doi: 10.1086/491675. [DOI] [PMC free article] [PubMed] [Google Scholar]
- 101.Ruiz-Pesini E, et al. Effects of purifying and adaptive selection on regional variation in human mtDNA. Science. 2004;303(5655):223–6. doi: 10.1126/science.1088434. [DOI] [PubMed] [Google Scholar]
- 102.Krzywanski DM, et al. The mitochondrial paradigm for cardiovascular disease susceptibility and cellular function: a complementary concept to Mendelian genetics. Lab Invest. 2011;91(8):1122–35. doi: 10.1038/labinvest.2011.95. [DOI] [PMC free article] [PubMed] [Google Scholar]
- 103.Scott GR, et al. Molecular evolution of cytochrome C oxidase underlies high-altitude adaptation in the bar-headed goose. Mol Biol Evol. 2011;28(1):351–63. doi: 10.1093/molbev/msq205. [DOI] [PubMed] [Google Scholar]
- 104.Peng Q, et al. Mitogenomic analysis of the genus Pseudois: evidence of adaptive evolution of morphological variation in the ATP synthase genes. Mitochondrion. 2012;12(5):500–5. doi: 10.1016/j.mito.2012.07.107. [DOI] [PubMed] [Google Scholar]
- 105.Cordain L, et al. Plant-animal subsistence ratios and macronutrient energy estimations in worldwide hunter-gatherer diets. Am J Clin Nutr. 2000;71(3):682–92. doi: 10.1093/ajcn/71.3.682. [DOI] [PubMed] [Google Scholar]
- 106.van Oven MKM. Updated Comprehensive Phylogenetic Tree of Global Human Mitochondrial DNA Variation. Human Mutation - Mutation in Brief. 2008;1039(30):E386–E394. doi: 10.1002/humu.20921. [DOI] [PubMed] [Google Scholar]
- 107.De Pauw A, et al. Mitochondrial (dys)function in adipocyte (de)differentiation and systemic metabolic alterations. Am J Pathol. 2009;175(3):927–39. doi: 10.2353/ajpath.2009.081155. [DOI] [PMC free article] [PubMed] [Google Scholar]
- 108.Matsuzawa-Nagata N, et al. Increased oxidative stress precedes the onset of high-fat diet-induced insulin resistance and obesity. Metabolism. 2008;57(8):1071–7. doi: 10.1016/j.metabol.2008.03.010. [DOI] [PubMed] [Google Scholar]
- 109.Attie AD, Scherer PE. Adipocyte metabolism and obesity. J Lipid Res. 2009;50(Suppl):S395–9. doi: 10.1194/jlr.R800057-JLR200. [DOI] [PMC free article] [PubMed] [Google Scholar]
- 110.Morris AA, et al. Differences in systemic oxidative stress based on race and the metabolic syndrome: the Morehouse and Emory Team up to Eliminate Health Disparities (META-Health) study. Metab Syndr Relat Disord. 2012;10(4):252–9. doi: 10.1089/met.2011.0117. [DOI] [PMC free article] [PubMed] [Google Scholar]
- 111.Paabo S. Ancient DNA: extraction, characterization, molecular cloning, and enzymatic amplification. Proc Natl Acad Sci U S A. 1989;86(6):1939–43. doi: 10.1073/pnas.86.6.1939. [DOI] [PMC free article] [PubMed] [Google Scholar]
- 112.Wilson MR, et al. Validation of mitochondrial DNA sequencing for forensic casework analysis. Int J Legal Med. 1995;108(2):68–74. doi: 10.1007/BF01369907. [DOI] [PubMed] [Google Scholar]
- 113.Wallace DC. A mitochondrial paradigm of metabolic and degenerative diseases, aging, and cancer: a dawn for evolutionary medicine. Annu Rev Genet. 2005;39:359–407. doi: 10.1146/annurev.genet.39.110304.095751. [DOI] [PMC free article] [PubMed] [Google Scholar]
- 114.Marcuello A, et al. Human mitochondrial variants influence on oxygen consumption. Mitochondrion. 2009;9(1):27–30. doi: 10.1016/j.mito.2008.10.002. [DOI] [PubMed] [Google Scholar]
- 115.Hofmann S, et al. Population genetics and disease susceptibility: characterization of central European haplogroups by mtDNA gene mutations, correlation with D loop variants and association with disease. Hum Mol Genet. 1997;6(11):1835–46. doi: 10.1093/hmg/6.11.1835. [DOI] [PubMed] [Google Scholar]
- 116.Feder J, et al. Differences in mtDNA haplogroup distribution among 3 Jewish populations alter susceptibility to T2DM complications. BMC Genomics. 2008;9:198. doi: 10.1186/1471-2164-9-198. [DOI] [PMC free article] [PubMed] [Google Scholar]
- 117.Fuku N, et al. Mitochondrial haplogroup N9a confers resistance against type 2 diabetes in Asians. Am J Hum Genet. 2007;80(3):407–15. doi: 10.1086/512202. [DOI] [PMC free article] [PubMed] [Google Scholar]
- 118.Amo T, Brand MD. Were inefficient mitochondrial haplogroups selected during migrations of modern humans? A test using modular kinetic analysis of coupling in mitochondria from cybrid cell lines. Biochem J. 2007;404(2):345–51. doi: 10.1042/BJ20061609. [DOI] [PMC free article] [PubMed] [Google Scholar]
- 119.Moreno-Loshuertos R, et al. Differences in reactive oxygen species production explain the phenotypes associated with common mouse mitochondrial DNA variants. Nat Genet. 2006;38(11):1261–8. doi: 10.1038/ng1897. [DOI] [PubMed] [Google Scholar]
- 120.Gomez-Duran A, et al. Unmasking the causes of multifactorial disorders: OXPHOS differences between mitochondrial haplogroups. Hum Mol Genet. 2010;19(17):3343–53. doi: 10.1093/hmg/ddq246. [DOI] [PubMed] [Google Scholar]
- 121.Silver LM. Mouse Genetics: Concepts and Applications. Oxford University Press; 1995. [Google Scholar]
- 122.Fetterman JL, et al. Mitochondrial genetic background modulates bioenergetics and susceptibility to acute cardiac volume - overload. Biochem J. 2013 doi: 10.1042/BJ20130029. [DOI] [PMC free article] [PubMed] [Google Scholar]
- 123.Klimentidis YC, et al. Canaries in the coal mine: a cross-species analysis of the plurality of obesity epidemics. Proc Biol Sci. 2011;278(1712):1626–32. doi: 10.1098/rspb.2010.1890. [DOI] [PMC free article] [PubMed] [Google Scholar]
- 124.Kemnitz JW. Obesity in macaques: spontaneous and induced. Adv Vet Sci Comp Med. 1984;28:81–114. doi: 10.1016/b978-0-12-039228-5.50009-7. [DOI] [PubMed] [Google Scholar]
- 125.Jen KL, Hansen BC, Metzger BL. Adiposity, anthropometric measures, and plasma insulin levels of rhesus monkeys. Int J Obes. 1985;9(3):213–24. [PubMed] [Google Scholar]
- 126.Bauer SA, et al. Obesity in rhesus and cynomolgus macaques: a comparative review of the condition and its implications for research. Comp Med. 2011;61(6):514–26. [PMC free article] [PubMed] [Google Scholar]
- 127.Videan EN, Fritz J, Murphy J. Development of guidelines for assessing obesity in captive chimpanzees (Pan troglodytes) Zoo Biol. 2007;26(2):93–104. doi: 10.1002/zoo.20122. [DOI] [PubMed] [Google Scholar]
- 128.Keenan KP, et al. The effects of diet, ad libitum overfeeding, and moderate dietary restriction on the rodent bioassay: the uncontrolled variable in safety assessment. Toxicol Pathol. 1996;24(6):757–68. doi: 10.1177/019262339602400620. [DOI] [PubMed] [Google Scholar]
- 129.Keenan KP, et al. The effects of diet, overfeeding and moderate dietary restriction on Sprague-Dawley rat survival, disease and toxicology. J Nutr. 1997;127(5 Suppl):851S–856S. doi: 10.1093/jn/127.5.851S. [DOI] [PubMed] [Google Scholar]
- 130.Davis DE. A phenotypical difference in growth of wild rats. Growth. 1949;13(1):1–6. [PubMed] [Google Scholar]
- 131.Scarlett JM, et al. Overweight cats: prevalence and risk factors. Int J Obes Relat Metab Disord. 1994;18(Suppl 1):S22–8. [PubMed] [Google Scholar]
- 132.Lund EMA, PJ, Kirk CA, Klausner JS. Prevalence and risk factors for obesity in adult dogs from private US veterinary practices. Intern J Appl Res Vet Med. 2006;4(2):177–86. [Google Scholar]
- 133.Lund EMA, PJ, Kirk CA, Klausner JS. Prevalence and risk factors for obesity in adult cats from private US veterinary practices. Intern J Appl Res Vet Med. 2005;3(2):88–96. [Google Scholar]