

Abstract
Objective
Patients with gout have lower calcitriol levels that improve when uric acid is lowered. The mechanism of these observations is unknown. We hypothesized that uric acid inhibits 1- αhydroxylase.
Materials and methods
In vivo, Sprague Dawley rats were randomized to control (n=5), allantoxanamide (n=8), febuxostat (n=5), or allantoxanamide+febuxostat (n=7). Vitamin D, PTH, and 1-αhydroxylase protein were evaluated. In order to directly evaluate the effect of uric acid on 1-αhydroxylase, we conducted a series of dose response and time course experiments in vitro. Nuclear factor κ-B (NFκB) was inhibited pharmacologically. Finally, to evaluate the potential implications of these findings in humans, the association between uric acid and PTH in humans was evaluated in a cross-sectional analysis of data from the NHANES (2003-2006); n= 9773.
Results
1,25(OH)2D and 1-αhydroxylase protein were reduced in hyperuricemic rats and improved with febuxostat treatment. Uric acid suppressed 1-αhydroxylase protein and mRNA expression in proximal tubular cells. This was prevented by NFκB inhibition. In humans, for every 1 mg/dL increase in uric acid, the adjusted odds ratio for an elevated PTH (>65 pg/mL) was 1.21 (95% C.I. 1.14, 1.28; P< 0.0001), 1.15 (95% C.I. 1.08, 1.22; P<0.0001), and 1.16 (95% C.I. 1.03, 1.31; P=0.02) for all subjects, subjects with estimated GFR ≥60, and subjects with estimated GFR <60 mL/min/1.73 m2 respectively.
Conclusion
Hyperuricemia suppresses 1-αhydroxylase leading to lower 1,25(OH)2D and higher PTH in rats. Our results suggest this is mediated by NFκB. The association between uric acid and PTH in NHANES suggests potential implications for human disease.
Keywords: uric acid, parathyroid hormone, mineral and bone disorders
Introduction
Chronic kidney disease (CKD) is associated with significant morbidity and mortality [1]. In addition to well-known risk factors such as hypertension and diabetes, several “nontraditional” risk factors may contribute to the higher risk of death in patients with CKD compared to the general population [2-6]. Inflammation and CKD mineral and bone disorder (MBD) are two risk factors that have taken center stage in CKD patients [7-8]. In particular, the progressive decline in 1,25 dihydroxy-vitamin D (1,25(OH)2D) levels that occurs as glomerular filtration rate (GFR) falls has been associated with increased activity of the renin angiotensin system [9], insulin resistance [10], and progressive inflammation [11-12]. In turn, inflammation itself may suppress vitamin D activation thus contributing to the osteopenia seen is inflammatory diseases such as ankylosing spondylitis [13].
Vitamin D, provided in the diet or generated in the skin by ultraviolet light, is normally converted to 25 hydroxyvitamin D (25(OH)D) in the liver. 25(OH)D is then further hydroxylated by a rate-limiting step to 1,25(OH)2D by the enzyme 1- α hydroxylase (CYP27B1); present primarily in proximal tubular cells in the kidney [14]. A decrease in 1,25(OH)2D secondary to reduced nephron mass and/or 1- α hydroxylase enzyme activity contributes to the development of secondary hyperparathyroidism in patients with CKD [15].
The potential for a direct relationship between hyperuricemia and vitamin D metabolism was initially raised more than 20 years ago [16-17], and was subsequently explored by Takahashi et al [18], where patients with gout were found to have lower 1,25(OH)2D levels than normal controls. The same group showed that treatment of hyperuricemia increases 1,25(OH)2D levels with no change in 25(OH)D [19] suggesting that hyperuricemia may have a suppressive effect on 1-α hydroxylase activity. The mechanism underlying such observations remains unknown. We hypothesized that high uric acid levels reduces 1,25(OH)2D levels by suppressing 1-α hydroxylase and, since low 1,25(OH)2D levels can stimulate parathyroid hormone (PTH), that high uric acid levels should be associated with elevated PTH levels. To test this, we also conducted studies in vivo where we utilized an animal model of acute hyperuricemia and in vitro using human proximal tubular cells. Furthermore, we evaluated the relation between high uric and elevated PTH levels utilizing data from the National Health and Nutrition Examination Survey (NHANES 2003-2006), a large cross sectional sample of the US population.
Methods
Animal Study
Male Sprague-Dawley rats (n = 25) weighing 150 g (Charles Rivers Laboratories, Wilmington, MA) were randomly assigned to one of 4 groups: control (n=5), allantoxanamide at a dose of 150 mg/kg intraperitoneally (n=8), febuxostat at a dose of 30mg/kg by gavage (n=5), or allantoxanamide and febuxostat (n=7). Allantoxanamide is a uricase inhibitor that has been shown to acutely raise serum uric acid when injected intraperitoneally in rats [20] at a dose of 100-200 mg/kg [20-21]. Febuxostat is a non-purine selective inhibitor of xanthine oxidase. Contrary to allopurinol, febuxostat does not inhibit other enzymes in purine and pyrimidine metabolism pathways [22], yet has a more potent uric acid lowering effect than allopurinol in vitro and in vivo [23]. Considering the potent effect of allantoxanamide, febuxostat was administered 1 hour prior to allantoxanamide and at a high dose to ensure the uric acid lowering effect. After 24 hours, blood samples were obtained and all animals were sacrificed under light anesthesia. Kidneys were immediately fixed in Methyl-Carnoy's solution. The animal protocol was approved by the Animal Care and Use Committee of the University of Colorado Denver.
Biochemical data
Serum chemistries including uric acid, creatinine, calcium, and phosphorus were measured by autoanalyzer (VetAce machine; Alpha Wasserman, West Caldwell, NJ). As previously published by other groups, the ratio of 1,25(OH)2D to 25(OH)D was used as an indirect assessment of 1-α hydroxylase activity [24]. 1,25(OH)2D and 25(OH)D levels were measured by Enzyme-linked ImmunoAssay (ELISA) kits (Immunodiagnosticsystems). The reported intra-assay CV% for 25(OH)D ranges between 5.3-6.7% and the interassay CV% ranges from 4.6-8.7%. For 1,25(OH)2D, the intra-assay CV% ranges between 9.3-10.7% and the interassay CV% ranges from 17.1-19.7%. Similarly, intact PTH was measured by ELISA (Immunotopics, Inc.).
Renal histology and Immunofluorescence
Kidneys were fixed in paraffin, sectioned (2 μm thickness), and stained by Periodic Acid- Schiff (PAS) for histological analysis. For immunofluorescence, heat-induced epitope retrieval was achieved in antigen retrieval citrate solution (BioGenex, San Ramon, CA) for 1-α hydroxylase. After rinsing the sections in PBS, they were blocked in 1% normal goat serum for 1 hour at room temperature. A rabbit polyclonal anti-rat 1-α hydroxylase antibody (Santa Cruz, CA) was used as primary antibody, and Alexa fluor 568 conjugated goat polyclonal anti-rabit antibody (Invitrogen, Carlsbad, CA) as secondary antibody. Images were analyzed using Axio Vision image analyzer (Carl Zeiss, Thornwood, NY) at 20X and 40X. The same settings of the microscope were applied to all the images being compared. Nonspecific staining with secondary antibody was negligible.
Immunoblotting
Whole kidney or stimulated HK2 cells were lysed in lysis buffer (20 mM Tris-HCl [pH 8.0], 1.5 mM MgCl2, 0.2 mM EDTA, 25% Glycerol, and 0.5 mM PMSF). Nuclear and cytosolic proteins were extracted with Biovision extraction kit (Mountain View, CA). Equal amounts of protein were resuspended in SDS sample buffer, boiled for 5 min, and analyzed on 4 to 20% SDS-PAGE gels. The proteins were electrophoretically transferred to polyvinylidene difluoride membranes (Hybond-ECL; Amersham, Piscataway, NJ) and probed with the following antibodies: 1-α hydroxylase and 24 hydroxylase (Santa Cruz, Santa Cruz, CA), or glyceraldehyde-3-phosphate dehydrogenase (GAPDH). The antigen–antibody complexes were detected by the ECL protocol using horseradish peroxidase–conjugated goat anti-rabbit or anti-mouse IgG as secondary antibody. The immunoblots shown are representative of the animal groups.
Cell culture and reagents
In order to evaluate the effect of uric acid on 1-α hydroxylase more directly, we conducted a series of in vitro experiments. Human proximal tubular cells (HK2 cells) were cultured in Keratinocyte-SFM basal media (Invitrogen), supplemented with Bovine Pituitary Extract (20-30 μg/mL) and recombinant Epidermal Growth Factor (0.1-0.2 ng/mL), 5% Fetal Bovine Serum, 100 U/ml penicillin, and 10 g/ml streptomycin (Invitrogen). Cells were cultured at 37°C in 95% air-5% CO2 until they were 90% confluent, and then allowed to differentiate for 5-7 days. After serum starvation for 24 hours, cells were stimulated with uric acid. For the dose response experiments, uric acid was given at 2.5, 5.0, 7.5, and 10 mg/dL and the cells were collected after 24 hours of treatment. Uric acid was used at 10 mg/dL for the time course experiments and the cells were collected at: 1, 2, 4, 8, 16, and 24 hours. To prevent uric acid crystal formation in the media, uric acid was dissolved in prewarmed media, and kept at 37°C for a minimum of 30 minutes prior to application in cell culture. For cell viability assessment, the cells were treated with 2.5, 5.0, 7.5, and 10 mg/dL uric acid and collected after 24 hours, then incubated for 3 min at room temperature with an equal volume of 0.4% (w/v) trypan blue solution, and counted using a dual-chamber hemocytometer and a light microscopy. Viable and nonviable cells were recorded separately. The means of three independent cell counts were pooled for analysis. Considering prior evidence that nuclear factor κ- B (NFκB) may inhibit 1-α hydroxylase transcription [25], and that uric acid has been shown to activate NFκB[26-27], we examined the role of NFκB in mediating uric acid effects. BAY 11-7082, an NFκB inhibitor (Sigma) was used. A dose of 5uM/mL of BAY 11-7082 was determined by a series of viability experiments, and was applied 1 hour prior to uric acid treatment (10mg/dL).
The cell culture experiments were repeated twice to ensure reproducibility. Quantitative data are presented as mean ± SEM and were analyzed either by paired t-test or ANOVA as appropriate. Significance was assigned at P < 0.05. All statistical analyses were performed by using InStat Version 3.06 (GraphPad Software, San Diego, CA).
Methods for the correlation between uric acid and PTH in humans
Study population and sample
Data were obtained from the NHANES (2003-2006), a cross sectional survey conducted by the National Center for Health Statistics (NCHS) of the Centers for Disease Control and prevention between 2003 and 2006. A stratified, multistage sampling design was used, with over sampling of non-Hispanic Blacks, Mexican-Americans, and persons over the age of 60 years. Subjects underwent a standardized questionnaire, administered during a home interview followed by a detailed physical examination and blood specimens' collection at a mobile examination center or at the participants' homes [28]. The analysis was restricted to adult participants 18 years of age or older who had complete serum PTH and uric acid data (n= 9773 individuals).
Primary predictor and outcome
The independent variable used in this analysis was serum uric acid modeled as a continuous variable. Serum uric acid was measured by oxidization with the specific enzyme uricase (Hitachi model 737 Multichannel Analyzer; Boehringer Mannheim Diagnostics, Indianapolis, IN) and is reported in mg per dL. Details about quality-control procedures have been published elsewhere [28].
The dependent variable of interest was serum PTH levels (modeled as a continuous and categorical variable). PTH was tested for normality and found to be non-normally distributed, hence it was log transformed. Categorically, elevated PTH was defined as > 65 pg/mL on the basis of previous studies [15]. Intact PTH levels were measured by Elecsys 1010 analyzer using ECL/Origen electrochemiluminescent process (reference range: 10–65 pg/mL) [28].
Other measurements
Potential confounding factors were chosen based on prior studies or on their biological plausibility. The following covariates were included in the analysis: age, sex, race/ethnicity, diabetes, hypertension, BMI, serum levels of 25-hydroxyvitamin D (25(OH)D), calcium, phosphorus, and serum bicarbonate levels, in addition to the Modification of Diet in Renal Disease (MDRD)- estimated glomerular filtration rate (eGFR), and use of diuretics.
Statistical analysis
Univariate modeling was first performed to determine if a directional trend existed between the selected variables and elevated PTH. Categorical variables were examined with a Chi-square test and continuous variables examined with two- tailed T test. The independent relationship between serum uric acid and elevated PTH levels was investigated using logistic regression models adjusting simultaneously for several potential confounders. The analysis was then stratified by serum phosphorus levels >4.5 and ≤4.5 mg/dL based on the normal adult reference range. In addition, we stratified by serum calcium levels > 9.5 and ≤ 9.5 mg/dL. The number of participants with serum calcium levels > 10 mg/dL was small (3%), and the cut-off of 9.5 mg/dL was chosen based on prior evidence that serum calcium > 9.5 mg/dL is associated with an increased risk of death in patients with CKD [29]. Due to known confounding effect of kidney function on uric acid and PTH levels, we examined the association between serum uric acid and PTH in groups stratified by MDRD- estimated GFR. The absence of significant CKD was defined as MDRD- estimated GFR ≥60 mL/min/1.73 m2 and significant CKD was defined as MDRD- estimated GFR <60 mL/min/1.73 m2. Considering the evidence that PTH levels begin to increase once the GFR is <60 mL/min/1.73 m2[15] and the variability of the MDRD equation in individuals with GFR ≥60 mL/min/1.73 m2 we avoided further definition of GFR ≥ 60 mL/min/1.73m2 into 60-89 and ≥ 90 mL/min/1.73m2[30]. To characterize the relationship between uric acid and PTH in CKD, we stratified CKD status as follows: MDRD-eGFR 45-59, 30-44, and 15-29 mL/min/1.73 m2. Linear regression models were also applied. Only a few of NHANES participants had eGFR <15 mL/min/1.73 m2 and were not included in the analysis. Analyses were conducted using SAS software, version 9.1.3 (Research Triangle Institute, Research Triangle Park, NC). P values <0.05 were considered statistically significant.
Results
Acute hyperuricemia significantly reduces 1-α hydroxylase activity and protein expression in vivo
Mean serum uric acid for the different treatment groups are shown in Figure 1A. Animals with hyperuricemia had a significantly lower ratio of 1,25(OH)2D/25(OH)D when compared to the control group, as shown in Figure 1B. 1,25(OH)2D levels for the control, allantoxanamide, febuxostat, allantoxanamide + febuxostat groups were 836±56, 708±73, 756±55, and 795±56 pmol/L, respectively (Figure 1C). Mean 25(OH)D levels were lower in the hyperuricemic rats but this did not achieve statistical significance (Figure 1D). Immunofluorescence indicated reduced expression of 1-α hydroxylase protein in the proximal tubular nephron of the hyperuricemic rats (Figure 2A). Consistently, immunoblotting showed reduced expression of 1-α hydroxylase in whole kidney lysates of hyperuricemic rats and restoration of protein expression in the rats treated with both allantoxanamide and febuxostat, thus excluding direct toxicity of allantoxanamide as causative for reduced 1α hydroxylase expression (Figure 2B and 2C). 24-hydroxylase expression was unchanged in response to hyperuricemia. Median (IQR) PTH levels were: 499 (451, 571), 984 (459, 1789), 596 (452, 836), and 776 (730, 1131) pg/mL for the control, allantoxanamide, febuxostat, and allantoxanamide + febuxostat groups respectively (P=0.14). Calcium and phosphorus levels are shown in Table 1. While serum phosphorus levels increased in the hyperuricemic group compared to the control, this was not statistically significant. Of note, acute hyperuricemia was associated with increased serum creatinine and tubular dilatation as shown in Figure 3. The serum creatinine for the allantoxanamide group was significantly higher than the control group (1.9±1.2 versus 0.4±0.1 mg/dL). The acute kidney injury was only partially reversed by the xanthine oxidase inhibitor, febuxostat (serum creatinine 0.7±0.2 mg/dL).
Figure 1.
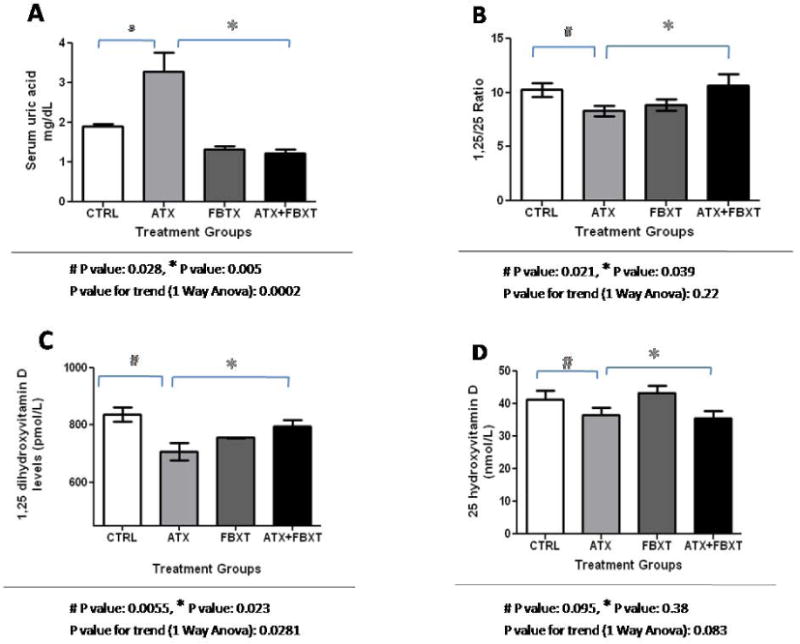
Allantoxanamide successfully induces acute hyperuricemia and significantly inhibits 1-α hydroxylase activity in rats. Figure 1A: After 24 hours, mean serum uric acid was 1.9 ± 0.1, 3.3 ± 1.4, 1.3 ± 0.2, and 1.2 ± 0.3 mg/dL for the control, allantoxanamide, febuxostat, and allantoxanamide + febuxostat groups respectively. Figure 1B: Acute hyperuricemia leads to reduced 1-α hydroxylase activity estimated by the ratio of 1,25(OH)2D to 25(OH)D. Figure 1C: Mean ± SD of 1,25(OH)2D levels (pmol/L) in different treatment groups. Figure 1D: Mean ± SD of 25(OH)D levels (nmol/L) according to treatment group. CTRL: control, ATX: allantoxanamide, FBXT: febuxostat, and ATX + FBXT: allantoxanamide + febuxostat.
Figure 2.
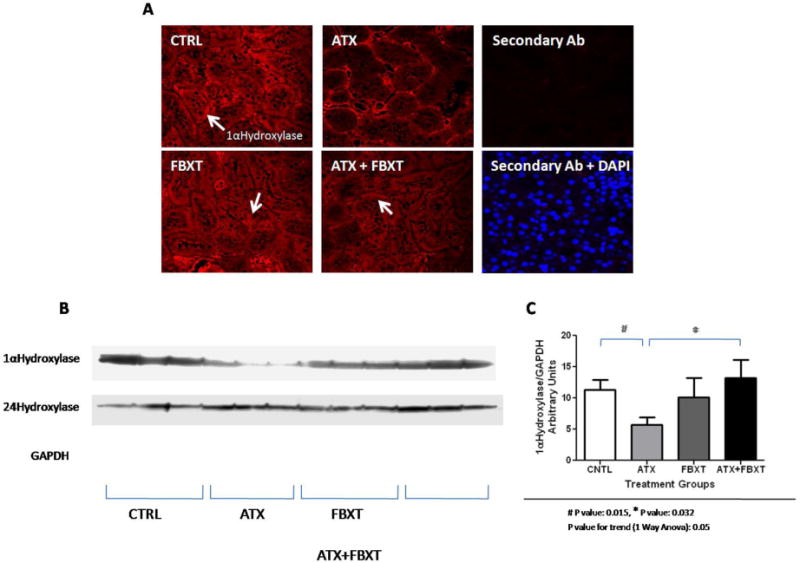
1-α hydroxylase protein expression is significantly reduced in hyperuricemic rats. Acute hyperuricemia had no significant effect on 24-hydroxylase protein expression. Figure 2A: Immunofluorescence for 1- α hydroxylase protein according to treatment group. Figure 2B: Western blotting for whole kidney lysates showing the expression of 1-α hydroxylase, 24- hydroxylase, and GAPDH proteins. The results shown are representative of all the animals included in the study. Figure 2C: Densitometry results comparing 1- α hydroxylase protein expression after normalization to GAPDH protein expression between the different treatment groups. The densitometry summarizes normalized 1-α hydroxylase protein expression for all the animals included in the study. CTRL: control, ATX: allantoxanamide, FBXT: febuxostat, and ATX + FBXT: allantoxanamide. + febuxostat.
Table 1.
Serum calcium and phosphorus levels for the in vivo model.
| Treatment group | |||||
|---|---|---|---|---|---|
| Control | Allantoxanamide | Febuxostat | Allantoxanamide + Febuxostat | P for trend | |
| Calcium | 8.4 ± 0.9 | 9.2 ± 1.2 | 10.0 ± 1.4 | 9.5 ± 0.9 | 0.19 |
| Phosphorus | 5.9 ± 1.5 | 8.5 ± 2.6 | 6.3 ± 1.7 | 5.8 ± 0.3 | 0.14 |
Values are presented as mean ± standard deviation
Figure 3.
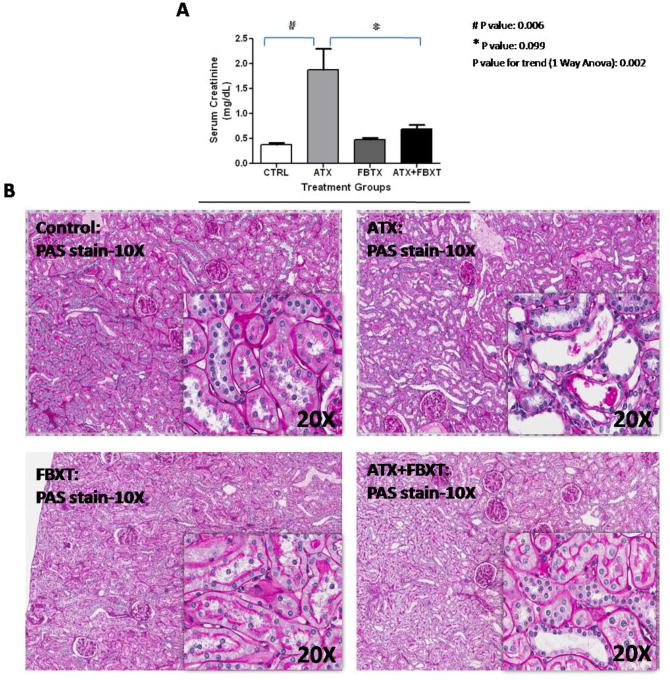
Allantoxanamide treatment was associated with increased serum creatinine and tubular dilatation. Serum creatinine for the hyperuricemic group was significantly higher than the control group (1.9±1.2 versus 0.4±0.1 mg/dL). The acute kidney injury was partially reversed by the xanthine oxidase inhibitor, febuxostat (creatinine 0.7±0.2 mg/dL). Figure 3A: Mean ± SD of serum creatinine (mg/dL) are shown in the different treatment groups, Figure 3B: Allantoxanamide was associated with acute tubular toxicity. CTRL: control, ATX: allantoxanamide, FBXT: febuxostat, and ATX + FBXT: allantoxanamide. + febuxostat.
Acute hyperuricemia significantly reduces 1-α hydroxylase mRNA and protein expression in human HK2 cells and inhibition of NFκB restores 1-α hydroxylase mRNA and protein expression
Figure 4A and 4B illustrate decreasing expression of 1-α hydroxylase mRNA and protein in HK2 tubular cells in response to increasing uric acid concentrations. The reduction in1-α hydroxylase protein was notably significant at 10 mg/dL of uric acid. Time course experiments revealed that 1-α hydroxylase mRNA was significantly suppressed at 6 hours (Figure 4D), whereas protein expression was significantly inhibited after 16 hours of treatment with uric acid (Figure 4C). Pretreatment of the HK2 cells with Bay 11-7082, an inhibitor of NFκB prevented uric acid - mediated suppression of 1-α hydroxylase mRNA and protein (Figures 4E and 4F). These findings suggest that uric acid suppresses 1-α hydroxylase mRNA and protein expression by activating NFκB. Protein expression of 24 hydroxylase was unaffected by uric acid in this cell model (data not shown). In addition, the percent of viable cells was 95, 94, 94, 95, and 95% for uric acid treatment groups: control, 2.5, 5, 7.5, and 10 mg/dL respectively. No significant differences were observed for all group comparisons.
Figure 4.
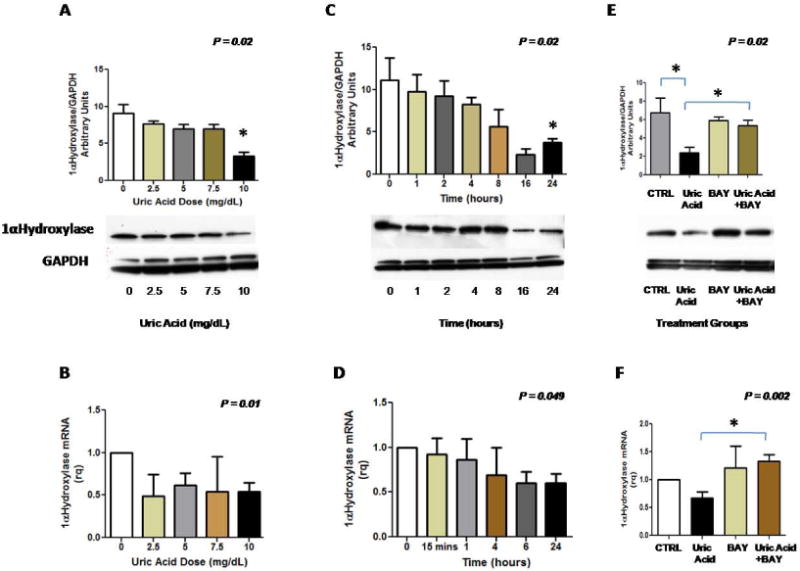
Uric acid suppresses 1-α hydroxylase mRNA and protein expression in human proximal tubular and inhibition of NFκB ameliorates the suppressive effect of uric acid on 1-α hydroxylase mRNA and protein. Figure 4A: 1- α hydroxylase protein expression is increasingly suppressed with increasing treatment dose of uric acid. Figure 4B: 1- α hydroxylase mRNA expression is suppressed with increasing treatment dose of uric acid. Figure 4C: 1-α hydroxylase protein expression is evident after 16 hours of treatment with uric acid (10mg/dL). Figure 4D: 1-α hydroxylase mRNA expression is significantly reduced after 6 hours of uric acid treatment (10mg/dL). Figure 4E: Inhibition of NFκB prevents the suppressive effect of uric acid on 1-α hydroxylase protein; Bay 11-7082 dose= 5 uM/mL, uric acid dose=10 mg/dL. Figure 4F: Inhibition of NFκB prevents the suppressive effect of uric acid on 1-α hydroxylase transcription. Results for each figure represent the findings of 3 independent experiments.
The relation between uric acid and PTH in humans
Characteristics of the participants according to PTH
Participants with high PTH>65 pg/mL (n=1338) were older and more likely to be of non- Hispanic Black ethnicity. Compared to the individuals with normal PTH, the participants with increased PTH had higher body mass index (BMI), and greater prevalence of hypertension and diabetes. High PTH was also associated with lower 25(OH)D levels and a lower MDRD- estimated GFR (Table 2). Additionally, participants with elevated PTH had higher serum uric acid levels (P < 0.0001).
Table 2. Clinical Characteristics of the Participants According to Parathyroid Hormone Levels.
| Characteristic | Parathyroid Hormone Level | p-value | |
|---|---|---|---|
| ≤65 pg/mL (n=8435) |
> 65pg/mL (n=1338) |
||
|
| |||
| Age (years) | 45 ± 20 | 55 ± 21 | < 0.0001 |
|
| |||
| Sex (%) | 0.28 | ||
| Male | 49 | 47 | |
| Female | 51 | 53 | |
|
| |||
| Race/Ethnicity (%) * | < 0.0001 | ||
| Non-Hispanic white | 50 | 42 | |
| Non-Hispanic black | 21 | 31 | |
| Mexican American | 25 | 23 | |
| Other | 4 | 4 | |
|
| |||
| BMI (kg/m2) | 28 ± 6 | 31 ± 8 | < 0.0001 |
|
| |||
| Diabetes (%) | 8.5 | 12 | < 0.0001 |
|
| |||
| Hypertension (%) | 28 | 46 | < 0.0001 |
|
| |||
| 25-hydroxyvitamin D (ng/mL) | 22 ± 10 | 17 ± 8 | < 0.0001 |
|
| |||
| Calcium (mg/dL) | 9.5 ± 0.4 | 9.4 ± 0.4 | < 0.0001 |
|
| |||
| Phosphorus (mg/dL) | 3.8 ±0.5 | 3.7 ± 0.6 | < 0.0001 |
|
| |||
| Serum bicarbonate (mmol/L) | 25 ± 2 | 25 ± 3 | 0.86 |
|
| |||
| Serum uric acid (mg/dL) | 5.2 ±1.4 | 5.9 ± 1.6 | < 0.0001 |
|
| |||
| Estimated GFR (mL/min/1.73m2) | 98 ± 27 | 82 ± 31 | < 0.0001 |
|
| |||
| Diuretic use (%) | 10% | 25% | <0.0001 |
| Loop diuretics | 2% | 12% | |
| Thiazide diuretics | 7% | 12% | |
Values are expressed as means ± standard deviation or %=percent of patients; BMI=body mass index; GFR=glomerular filtration rate
The definition of race/ethnicity can be found at: http://grants.nih.gov/grants/guide/notice-files/NOT-OD-01-053.html
Conversion units: uric acid: mg/dL × 59.48 = μmol/L; calcium: mg/dL × 0.25 = mmol/L; vitamin D: pg/mL × 2.5 = pmol/L; phosphorus: mg/dL × 0.32 = mmol/L.
Cross sectional association between serum uric acid and elevated PTH in all participating subjects (n=9773)
Mean serum uric acid was 5.3 ± 1.4 mg/dL. In the unadjusted analysis, the odds ratio for an elevated PTH >65 pg/mL was 1.32 (95% C.I. 1.26, 1.37; P<0.0001) for every 1 mg/dL increase in uric acid. After adjusting for age, sex, race/ethnicity, diabetes, hypertension, BMI, serum levels of 25(OH)D, calcium, phosphorus, and serum bicarbonate, MDRD- estimated GFR, and diuretic use, the odds of an elevated PTH level was 1.21 (95% C.I. 1.14, 1.28; P<0.0001) for every 1mg/dL increase in serum uric acid. These findings remained unchanged when subjects on diuretics or allopurinol were excluded. The association between uric acid and PTH >65 pg/mL remained significant in the following subgroups: calcium >9.5 and ≤9.5 mg/dL, and phosphorus >4.5 and ≤4.5 mg/dL (data not shown).
Linear regression analysis yielded a β estimate for log transformed PTH on uric acid of 0.031 (95% C.I. 0.028, 0.034; P<0.0001) in unadjusted analysis, and 0.030 (95% C.I. 0.027, 0.033; P<0.0001) in the multivariate model.
Cross sectional association between serum uric acid and PTH by chronic kidney disease status
768 of the 9773 participants (8%) were found to have CKD (defined as MDRD-estimated GFR< 60 mL/min/1.73 m2). In individuals without CKD (MDRD- estimated GFR ≥60 mL/min/1.73 m2), the odds ratios for an elevated PTH level of >65 pg/mL for every 1 mg/dL increase in uric acid were: 1.24 (95% C.I. 1.19, 1.30; P< 0.0001) in unadjusted analysis, and 1.15 (95% C.I. 1.08, 1.22; P< 0.0001) in the adjusted analysis. In individuals with CKD, the unadjusted analysis revealed an odds ratio of 1.36 (95% C.I. 1.23, 1.50; P< 0.0001), and the adjusted analysis revealed an odds ratio of 1.16 (95% C.I. 1.03, 1.31; P= 0.02).
On further examination of the relationship between uric acid and log transformed PTH across kidney function levels, serum uric acid was significantly correlated with log transformed PTH for the eGFR groups: ≥60, 45-59 and 30-44 mL/min/1.73 m2, with β estimates of 0.025 (95% C.I. 0.022,0.025; P<0.0001), 0.025 (95% C.I. 0.012,0.032; P<0.0001), 0.037 (95% C.I. 0.008,0.066; P=0.014) respectively. However, after adjusting for age, sex, race, diabetes, hypertension, 25(OH)D levels, and MDRD estimated GFR, serum uric acid and log PTH were significantly correlated only in eGFR groups ≥60 and 45-59 mL/min/1.73 m2, with estimates of 0.020 (95% C.I. 0.016,0.023; P<0.0001) and 0.020 (95% C.I. 0.006,0.034; P<0.0001) respectively. We found no correlation between uric acid and log PTH in eGFR groups 30-44 and 15-29 mL/min/1.73 m2. These findings are shown in Table 4. Characteristics of the subjects by GFR category are shown in Table 3.
Table 4. Linear regression analysis showing β estimates (95% CI) for the association between serum uric acid and log transformed PTH levels across stages of chronic kidney disease.
| Chronic Kidney Disease Stages MDRD- estimated GFR (mL/min/1.73m2) |
||||
|---|---|---|---|---|
| ≥60 N=9001 |
45- 59 N=537 |
30-44 N=166 |
15-29 N=48 |
|
| Unadjusted (95% CI) |
0.025 (0.022, 0.025) P<0.0001 |
0.025 (0.012, 0.032) P<0.0001 |
0.037 (0.008, 0.066) P=0.014 |
0.022 (-0.011, 0.055) P=0.19 |
| Adjusted * (95% CI) |
0.020 (0.016, 0.023) P<0.0001 |
0.02 (0.006, 0.034) P=0.003 |
0.02 (-0.009, 0.049) P=0.17 |
0.026 (-0.01, 0.065) P=0.22 |
Parsimonious model: age, sex, race/ethnicity, diabetes, hypertension, body mass index, 25(OH)D, and MDRD- estimated GFR.
Table 3. Clinical characteristics of the participants according to stages of chronic kidney disease.
| Characteristic | Chronic Kidney Disease Stages MDRD- estimated GFR (mL/min/1.73m2) |
p-value | |||
|---|---|---|---|---|---|
|
| |||||
| ≥60 N=9001 |
45- 59 N=537 |
30-44 N=166 |
15-29 N=48 |
||
|
| |||||
| Age (years) | 43 ± 17 | 70 ± 11 | 73 ± 9 | 70 ± 10 | < 0.0001 |
|
| |||||
| Sex (%) | <0.0001 | ||||
| Male | 48 | 35 | 36 | 43 | |
| Female | 52 | 65 | 64 | 57 | |
|
| |||||
| Race/Ethnicity (%) | < 0.0001 | ||||
| Non-Hispanic white | 48 | 73 | 69 | 50 | |
| Non-Hispanic black | 23 | 10 | 20 | 23 | |
| Mexican American | 25 | 13 | 6 | 23 | |
| Other | 4 | 4 | 5 | 4 | |
|
| |||||
| BMI (kg/m2) | 29 ± 7 | 29 ± 5 | 30 ± 6 | 31 ± 6 | 0.003 |
|
| |||||
| Diabetes (%) | 7 | 21 | 36 | 51 | < 0.0001 |
|
| |||||
| Hypertension (%) | 25 | 67 | 72 | 8 | < 0.0001 |
|
| |||||
| 25-hydroxyvitamin D (ng/mL) | 22 ± 10 | 22 ± 8 | 20 ± 7 | 18 ± 7 | 0.004 |
|
| |||||
| Estimated GFR (mL/min/1.73m2) | 99 ± 24 | 53 ± 4 | 38 ± 3 | 24 ± 3 | < 0.0001 |
|
| |||||
| Serum uric acid (mg/dL) | 5.2 ± 1.4 | 6.2 ± 1.3 | 7.2 ± 1.2 | 7.9 ± 2.3 | < 0.0001 |
|
| |||||
| % with PTH >65 pg/mL | 11 | 31 | 54 | 88 | < 0.0001 |
Values are expressed as means ± standard deviation or %=percent of patients; BMI=body mass index; GFR=glomerular filtration rate
Discussion
We report that experimental hyperuricemia suppresses 1-α hydroxylase activity in rats leading to lower 1,25(OH)2D levels. In addition, we found that increased serum uric acid is independently associated with increased odds of elevated PTH, defined as an iPTH >65 pg/mL, in a large number of NHANES participants. Further analysis revealed serum uric acid correlates positively with log PTH in individuals with MDRD- estimated GFR< 60 mL/min/1.73 m2. While these finding could potentially be attributed to reduced kidney function and reduced functioning nephron mass, our in vitro experiments suggest that uric acid itself suppresses 1-α hydroxylase mRNA and protein expression. This inhibitory effect appears to be mediated by NFκB.
Our findings are consistent with previous studies reporting uric acid to activate NFκB in a variety of cell culture models including proximal tubular cells [26-27], and the identification of NFκB binding element in the 1-α hydroxylase promoter [25]. The potential for a suppressive effect of hyperuricemia on vitamin D metabolism is further supported by reports of lower 1,25(OH)2D in patients with gout [18]. In one study of 114 males with gout, treatment of hyperuricemia with either a xanthine oxidase inhibitor (allopurinol) or with a uricosuric agent (benzbromarone) increased 1,25(OH)2D with no change in 25(OH)D levels [19]. The observation that lowering serum uric acid via a uricosuric agent increases 1,25(OH)2D levels in humans with gout suggests that uric acid inhibits 1-α hydroxylase activity.
In the general population, and in the absence of significant kidney disease, hyperparathyroidism is most commonly due to low 25- hydroxyvitamin D [31]. We, however, show a correlation between uric acid and elevated PTH that is independent of serum 25(OH)D, calcium, and phosphorus suggesting that other mechanisms may underlie this association. Although the exact mechanism underlying the association between high uric acid and high PTH cannot be elucidated from such a cross sectional analysis, our experimental findings suggest that uric acid inhibits 1-α hydroxylase activity by inhibiting 1-α hydroxylase protein expression. Inhibition of 1-α hydroxylase results in lower 1,25(OH)2D levels. As such the elevated PTH levels in our study population would be a surrogate marker for lower calcitriol levels.
Of interest is the association between uric acid and PTH in individuals with MDRD-estimated GFR< 60 mL/min/1.73 m2. This association is likely driven by the correlation between uric acid and PTH levels in the group with MDRD- eGFR 45-59 mL/min/1.73 m2. We found this correlation was independent of GFR, suggesting that hyperuricemia may affect vitamin D metabolism independently of renal dysfunction. The possibility of a link between uric acid and CKD-MBD was explored by Hsu et al. who showed that sodium urate suppressed the synthesis of 1,25(OH)2D when infused into normal rats [16]. Subsequently 9 patients with stable CKD were treated with allopurinol [17]. Daily treatment with allopurinol for 1 week lowered serum uric acid and increased 1,25(OH)2D, but had no effect on 25(OH)D levels. Collectively, such data suggest that lowering uric acid could modulate MBD in patients with CKD despite reduced functioning nephron mass.
Our study has several limitations. To induce hyperuricemia, we used the uricase inhibitor, allantoxanamide, and this approach resulted in some tubular injury and in abnormalities in calcium and phosphorus levels. This raises the possibility that the effects seen on vitamin D metabolites are due to the tubular damage rather than the hyperuricemia. However, treatment with febuxostat only partially reversed the biochemical and histological abnormalities in renal function, and yet completely restored 1-α hydroxylase protein expression. This complete restoration of 1-α hydroxylase protein expression coincided with the complete resolution of hyperuricemia in this model despite residual kidney injury. Changes in serum calcium levels were not statistically significant (possibly due to the small number of animals used), but it is plausible that hypercalcemia contributed to lower 1,25(OH)2D as higher calcium levels coincided with lower 1,25(OH)2D in the febuxostat group in the animal study. Although our in vitro data showed that uric acid suppressed 1-α hydroxylase mRNA and protein expression in dose dependent and time course experiments. These data suggest that uric acid itself may have a suppressive effect on vitamin D metabolism. Of note, there are also limitations with the epidemiological cross sectional analysis. Despite our data that uric acid suppresses 1-α hydroxylase experimentally, we cannot exclude other potential mechanisms may be involved in humans. For example, primary hyperparathyroidism has long been associated with hyperuricemia [32-33], and PTH has been shown to stimulate uric acid uptake by the renal cortical tubules of rabbits [34]. In addition, CKD-MBD involves complex interrelationships between calcium, phosphorus, PTH and other cofactors such as fibroblast growth factor -23 that were not characterized in our study. Other limitations include the small number of participants in the more advanced stages of CKD and we cannot be certain that there is no correlation between uric acid and PTH in the more advanced stages of CKD.
While our study and others [17] would suggest that treatment of hyperuricemia may improve vitamin D metabolism in CKD, some studies do not [35], and it is important to examine this question with properly designed studies in CKD. In addition, our study only examines the effect of uric acid on 1-α hydroxylase in the kidney and should not be generalized to extrarenal tissues. The regulation of 1-α hydroxylase protein expression and activity varies depending on the organ and the cell type [14] and some inflammatory pathways have been shown to upregulate 1-α hydroxylase in the endothelium and in monocytes [36-37]. If and how uric acid may modulate vitamin D in such tissues needs to be explored.
Notwithstanding these limitations, our study has several strengths including a combination of cell culture and animal studies supported by an epidemiological study of a large number of participants, where minorities (namely African Americans and Hispanics) are well represented.
In conclusion, acute hyperuricemia suppresses 1-α hydroxylase activity in vivo due to reduced 1-α hydroxylase mRNA and protein expression. Our in vitro studies suggest that this is mediated by NFκB. Consistent with these findings, increased uric acid is independently associated with an increased odds of abnormally elevated PTH level and correlates significantly with PTH in the general population and in patients with mild to moderate CKD (eGFR ≥45 mL/min/1.73 m2). Our results should prompt further investigation into the potential link between uric acid and CKD- MBD.
Acknowledgments
Funding: This work was supported by National Institutes of Health grants: 1K23DK088833 – 01, DK-5121, HL-68607, 1R01 DK081473-01A1, and 1R01DK078112-01A2. In this work has been made possible through ISN Fellowship (Dr. Wei Chen).The corresponding author, Dr. Diana Jalal, has a part time appointment in the Denver Veterans Administration Medical Center, and had full access to all of the data in the study and takes responsibility for the integrity of the data and the accuracy of the data analysis.
List of Abbreviations
- CKD
chronic kidney disease
- MBD
Mineral and bone disorder
- 1,25(OH)2D
1,25 dihydroxy-vitamin D
- 25(OH)D
25 hydroxyvitamin D
- PTH
parathyroid hormone
- IQR
inter-quartile range
- NHANES
National Health and Nutrition Examination Survey
- MDRD
Modification of Diet in Renal Disease
- GFR
glomerular filtration rate
- BMI
body mass index
- ATX
allantoxanamide
- FBXT
febuxostat
- NFκB
nuclear factor κ- B
Footnotes
Financial Disclosure: Dr. Richard Johnson is listed as an inventor on several patent applications on lowering uric acid as it relates to blood pressure and metabolic syndrome.
Author Contributions: Dr. Wei Chen wrote the first draft of the manuscript and conducted the in vitro studies along with Dr. Jalal as well as the in vivo studies along with Carlo Roncal. Dr. Lanaspa was instrumental in performing the renal imaging and IF. Dr. Johnson provided critical guidance for experimental design and the manuscript authorship. Dr. Chonchol's input was important in the statistical analysis plan and he provided important comments in the authorship of the manuscript. Dr. Smits conducted the statistical analysis. Dr. Jalal was responsible for the conception of the project, design and conduction of experiments, and final edits to the submission.
Publisher's Disclaimer: This is a PDF file of an unedited manuscript that has been accepted for publication. As a service to our customers we are providing this early version of the manuscript. The manuscript will undergo copyediting, typesetting, and review of the resulting proof before it is published in its final citable form. Please note that during the production process errors may be discovered which could affect the content, and all legal disclaimers that apply to the journal pertain.
References
- 1.Levey AS, Atkins R, Coresh J, et al. Chronic kidney disease as a global public health problem: approaches and initiatives - a position statement from Kidney Disease Improving Global Outcomes. Kidney Int. 2007;72(3):247–59. doi: 10.1038/sj.ki.5002343. [DOI] [PubMed] [Google Scholar]
- 2.Brantsma AH, Bakker SJ, Hillege HL, et al. Cardiovascular and renal outcome in subjects with K/DOQI stage 1-3 chronic kidney disease: the importance of urinary albumin excretion. Nephrol Dial Transplant. 2008;23(12):3851–8. doi: 10.1093/ndt/gfn356. [DOI] [PubMed] [Google Scholar]
- 3.Go AS, Chertow GM, Fan D, et al. Chronic kidney disease and the risks of death, cardiovascular events, and hospitalization. N Engl J Med. 2004;351(13):1296–305. doi: 10.1056/NEJMoa041031. [DOI] [PubMed] [Google Scholar]
- 4.McCullough PA, Jurkovitz CT, Pergola PE, et al. Independent components of chronic kidney disease as a cardiovascular risk state: results from the Kidney Early Evaluation Program (KEEP) Arch Intern Med. 2007;167(11):1122–9. doi: 10.1001/archinte.167.11.1122. [DOI] [PubMed] [Google Scholar]
- 5.McCullough PA, Li S, Jurkovitz CT, et al. Chronic kidney disease, prevalence of premature cardiovascular disease, and relationship to short-term mortality. Am Heart J. 2008;156(2):277–83. doi: 10.1016/j.ahj.2008.02.024. [DOI] [PubMed] [Google Scholar]
- 6.Weiner DE, Tighiouart H, Stark PC, et al. Kidney disease as a risk factor for recurrent cardiovascular disease and mortality. Am J Kidney Dis. 2004;44(2):198–206. doi: 10.1053/j.ajkd.2004.04.024. [DOI] [PubMed] [Google Scholar]
- 7.Muntner P, He J, Astor BC, et al. Traditional and nontraditional risk factors predict coronary heart disease in chronic kidney disease: results from the atherosclerosis risk in communities study. J Am Soc Nephrol. 2005;16(2):529–38. doi: 10.1681/ASN.2004080656. [DOI] [PubMed] [Google Scholar]
- 8.Agarwal R. Vitamin D, proteinuria, diabetic nephropathy, and progression of CKD. Clin J Am Soc Nephrol. 2009;4(9):1523–8. doi: 10.2215/CJN.02010309. [DOI] [PubMed] [Google Scholar]
- 9.Zhang Z, Sun L, Wang Y, et al. Renoprotective role of the vitamin D receptor in diabetic nephropathy. Kidney Int. 2008;73(2):163–71. doi: 10.1038/sj.ki.5002572. [DOI] [PubMed] [Google Scholar]
- 10.de Boer IH. Vitamin D and glucose metabolism in chronic kidney disease. Curr Opin Nephrol Hypertens. 2008;17(6):566–72. doi: 10.1097/MNH.0b013e32830fe377. [DOI] [PMC free article] [PubMed] [Google Scholar]
- 11.Zehnder D, Quinkler M, Eardley KS, et al. Reduction of the vitamin D hormonal system in kidney disease is associated with increased renal inflammation. Kidney Int. 2008;74(10):1343–53. doi: 10.1038/ki.2008.453. [DOI] [PMC free article] [PubMed] [Google Scholar]
- 12.Tan X, Wen X, Liu Y. Paricalcitol inhibits renal inflammation by promoting vitamin D receptor-mediated sequestration of NF-kappaB signaling. J Am Soc Nephrol. 2008;19(9):1741–52. doi: 10.1681/ASN.2007060666. [DOI] [PMC free article] [PubMed] [Google Scholar]
- 13.Lange U, Jung O, Teichmann J, et al. Relationship between disease activity and serum levels of vitamin D metabolites and parathyroid hormone in ankylosing spondylitis. Osteoporos Int. 2001;12(12):1031–5. doi: 10.1007/s001980170013. [DOI] [PubMed] [Google Scholar]
- 14.Ebert R, Schutze N, Adamski J, et al. Vitamin D signaling is modulated on multiple levels in health and disease. Mol Cell Endocrinol. 2006;248(1-2):149–59. doi: 10.1016/j.mce.2005.11.039. [DOI] [PubMed] [Google Scholar]
- 15.Levin A, Bakris GL, Molitch M, et al. Prevalence of abnormal serum vitamin D, PTH, calcium, and phosphorus in patients with chronic kidney disease: results of the study to evaluate early kidney disease. Kidney Int. 2007;71(1):31–8. doi: 10.1038/sj.ki.5002009. [DOI] [PubMed] [Google Scholar]
- 16.Hsu CH, Patel SR, Young EW, et al. Effects of purine derivatives on calcitriol metabolism in rats. Am J Physiol. 1991;260(4 Pt 2):F596–601. doi: 10.1152/ajprenal.1991.260.4.F596. [DOI] [PubMed] [Google Scholar]
- 17.Vanholder R, Patel S, Hsu CH. Effect of uric acid on plasma levels of 1,25(OH)2D in renal failure. J Am Soc Nephrol. 1993;4(4):1035–8. doi: 10.1681/ASN.V441035. [DOI] [PubMed] [Google Scholar]
- 18.Takahashi S, Yamamoto T, Moriwaki Y, et al. Decreased serum concentrations of 1,25(OH)2-vitamin D3 in patients with gout. Adv Exp Med Biol. 1998;431:57–60. doi: 10.1007/978-1-4615-5381-6_11. [DOI] [PubMed] [Google Scholar]
- 19.Takahashi S, Yamamoto T, Moriwaki Y, et al. Decreased serum concentrations of 1,25(OH)2-vitamin D3 in patients with gout. Metabolism. 1998;47(3):336–8. doi: 10.1016/s0026-0495(98)90267-0. [DOI] [PubMed] [Google Scholar]
- 20.Barrera CM, Hunter RE, Dunlap WP. Hyperuricemia and locomotor activity in developing rats. Pharmacol Biochem Behav. 1989;33(2):367–9. doi: 10.1016/0091-3057(89)90515-7. [DOI] [PubMed] [Google Scholar]
- 21.Church WH, Rappolt G. Nigrostriatal catecholamine metabolism in guinea pigs is altered by purine enzyme inhibition. Exp Brain Res. 1999;127(2):147–50. doi: 10.1007/s002210050784. [DOI] [PubMed] [Google Scholar]
- 22.Takano Y, Hase-Aoki K, Horiuchi H, et al. Selectivity of febuxostat, a novel non-purine inhibitor of xanthine oxidase/xanthine dehydrogenase. Life Sci. 2005;76(16):1835–47. doi: 10.1016/j.lfs.2004.10.031. [DOI] [PubMed] [Google Scholar]
- 23.Osada Y, Tsuchimoto M, Fukushima H, et al. Hypouricemic effect of the novel xanthine oxidase inhibitor, TEI-6720, in rodents. Eur J Pharmacol. 1993;241(2-3):183–8. doi: 10.1016/0014-2999(93)90201-r. [DOI] [PubMed] [Google Scholar]
- 24.Douard V, Asgerally A, Sabbagh Y, et al. Dietary fructose inhibits intestinal calcium absorption and induces vitamin D insufficiency in CKD. J Am Soc Nephrol. 2010;21(2):261–71. doi: 10.1681/ASN.2009080795. [DOI] [PMC free article] [PubMed] [Google Scholar]
- 25.Ebert R, Jovanovic M, Ulmer M, et al. Down-regulation by nuclear factor kappaB of human 25-hydroxyvitamin D3 1alpha-hydroxylase promoter. Mol Endocrinol. 2004;18(10):2440–50. doi: 10.1210/me.2002-0441. [DOI] [PubMed] [Google Scholar]
- 26.Kanellis J, Watanabe S, Li JH, et al. Uric acid stimulates monocyte chemoattractant protein-1 production in vascular smooth muscle cells via mitogen-activated protein kinase and cyclooxygenase-2. Hypertension. 2003;41(6):1287–93. doi: 10.1161/01.HYP.0000072820.07472.3B. [DOI] [PubMed] [Google Scholar]
- 27.Han HJ, Lim MJ, Lee YJ, et al. Uric acid inhibits renal proximal tubule cell proliferation via at least two signaling pathways involving PKC, MAPK, cPLA2, and NF-kappaB. Am J Physiol Renal Physiol. 2007;292(1):F373–81. doi: 10.1152/ajprenal.00104.2006. [DOI] [PubMed] [Google Scholar]
- 28.The National Helath and Nutrition Examination Survey Reference Manuals and Reports (2003-2006) National Center for Health Statistics; Bethesda: [Google Scholar]
- 29.Block GA, Klassen PS, Lazarus JM, et al. Mineral metabolism, mortality, and morbidity in maintenance hemodialysis. J Am Soc Nephrol. 2004;15(8):2208–18. doi: 10.1097/01.ASN.0000133041.27682.A2. [DOI] [PubMed] [Google Scholar]
- 30.Levey AS, Bosch JP, Lewis JB, et al. A more accurate method to estimate glomerular filtration rate from serum creatinine: a new prediction equation. Modification of Diet in Renal Disease Study Group. Ann Intern Med. 1999;130(6):461–70. doi: 10.7326/0003-4819-130-6-199903160-00002. [DOI] [PubMed] [Google Scholar]
- 31.Saleh F, Jorde R, Sundsfjord J, et al. Causes of secondary hyperparathyroidism in a healthy population: the Tromso study. J Bone Miner Metab. 2006;24(1):58–64. doi: 10.1007/s00774-005-0647-y. [DOI] [PubMed] [Google Scholar]
- 32.Ybarra J, Donate T, Jurado J, et al. Primary hyperparathyroidism, insulin resistance, and cardiovascular disease: a review. Nurs Clin North Am. 2007;42(1):79–85. vii. doi: 10.1016/j.cnur.2006.11.010. [DOI] [PubMed] [Google Scholar]
- 33.Vestergaard P, Mollerup CL, Frokjaer VG, et al. Cardiovascular events before and after surgery for primary hyperparathyroidism. World J Surg. 2003;27(2):216–22. doi: 10.1007/s00268-002-6541-z. [DOI] [PubMed] [Google Scholar]
- 34.Kippen I, Nakata N, Klinenberg JR. Uptake of uric acid by separated renal tubules of the rabbit. I. Characteristics of transport. J Pharmacol Exp Ther. 1977;201(1):218–25. [PubMed] [Google Scholar]
- 35.Kohri K, Takada M, Katoh Y, et al. Parathyroid hormone and electrolytes during long-term treatment with allopurinol and thiazide. Br J Urol. 1987;59(6):503–7. doi: 10.1111/j.1464-410x.1987.tb04863.x. [DOI] [PubMed] [Google Scholar]
- 36.Zehnder D, Bland R, Chana RS, et al. Synthesis of 1,25-dihydroxyvitamin D(3) by human endothelial cells is regulated by inflammatory cytokines: a novel autocrine determinant of vascular cell adhesion. J Am Soc Nephrol. 2002;13(3):621–9. doi: 10.1681/ASN.V133621. [DOI] [PubMed] [Google Scholar]
- 37.Stoffels K, Overbergh L, Giulietti A, et al. Immune regulation of 25-hydroxyvitamin-D3-1alpha-hydroxylase in human monocytes. J Bone Miner Res. 2006;21(1):37–47. doi: 10.1359/JBMR.050908. [DOI] [PubMed] [Google Scholar]