

Abstract
Purines are a class of small organic molecules that are essential for all cells. They play critical roles in neuronal differentiation and function. Their importance is highlighted by several inherited disorders of purine metabolism, such as the Lesch-Nyhan disease, which is caused by a deficiency of the purine salvage enzyme, hypoxanthine-guanine phosphoribosyltransferase (HGprt). Despite the known importance of purines in the nervous system, knowledge regarding their metabolism in neurons is limited. In the current studies, purine pools and their metabolism were examined in rat PC6-3 cells, a PC12 pheochromocytoma subclone that undergoes robust differentiation with nerve growth factor. The results were compared with five new independent PC6-3 subclones with defective purine recycling due to different mutations affecting HGprt enzyme activity. The results demonstrate an increase in most purines and in energy state following neuronal differentiation, as well as specific abnormalities when purine recycling is lost. The loss of HGprt-mediated purine recycling also is associated with significant loss of dopamine and related metabolites in the mutant PC6-3 lines, suggesting an important connection between purine and dopamine pathways. These results provide insights into how purine pools and metabolism change with neuronal differentiation, and how specific enzyme defects may cause neuronal dysfunction.
Keywords: Lesch-Nyhan disease, dopamine neurons, purine nucleotide, hypoxanthine-guanine phosphoribosyltransferase
Introduction
The purines are a class of small organic molecules that are essential for all cells. They include adenine nucleotides (ATP, ADP, AMP) and related molecules such as cAMP, NAD, adenosine, hypoxanthine, and adenine. They also include guanine nucleotides (GTP, GDP, GMP) as well as cGMP, guanosine, guanine, and xanthine. These molecules play central roles as building blocks for DNA and RNA during cell proliferation, they serve as cofactors for many enzymatic reactions, and they act as both intra-cellular and inter-cellular signaling messengers. Intracellular purine levels are tightly regulated through a complex interplay between synthesis, recycling and degradation.
An important role for purine recycling in neural development is highlighted by Lesch-Nyhan disease, which is caused by inherited deficiency of the salvage enzyme, hypoxanthine-guanine phosphoribosyltransferase (HGprt) (Jinnah & Friedmann 2001). Affected individuals suffer from a characteristics syndrome that includes difficulties with motor control, cognition and behavior (Schretlen et al. 2001, Schretlen et al. 2005, Jinnah et al. 2006). The loss of HGprt-mediated purine recycling is likely to affect many brain regions, but most of the clinical features of the disease have been linked with dysfunction of basal ganglia dopamine pathways (Visser et al. 2000, Baumeister & Frye 1985, Nyhan 2000, Saito & Takashima 2000). In fact, post-mortem biochemical studies of the brains of affected individuals have revealed a 60–80% loss of dopamine and related biochemical measures in the basal ganglia, while other brain regions and neurochemical pathways are spared (Lloyd et al. 1981, Saito & Takashima 2000). A similar regionally selective and neurochemically specific abnormality of basal ganglia dopamine pathways occurs in the HGprt-deficient (HGprt−) mouse (Jinnah et al. 1992, Jinnah et al. 1994, Jinnah et al. 1999, Egami et al. 2002). The loss of dopamine seems to be a cell-intrinsic defect, because HGprt− subclones of neuron-like cells in culture also have reduced dopamine levels (Egami et al. 2007, Lewers et al. 2008, Smith & Friedmann 2000, Bitler & Howard 1986). Although the mechanism by which HGprt deficiency causes dysfunction of dopamine neurons remains unclear, some studies have suggested that the loss of HGprt disrupts pathways responsible for neuronal differentiation (Egami et al. 2007, Lewers et al. 2008, Ceballos-Picot et al. 2009, Guibinga et al. 2010, Mastrangelo et al. 2012).
Because of the known role of HGprt in purine salvage, it is assumed that neuronal dysfunction results from some disturbance in purine metabolism, such as reduced purine levels. However, studies involving HGprt− cell models or the HGprt− mouse have not identified a consistent loss of purines (Jinnah et al. 1993, Shirley et al. 2007, Zoref-Shani et al. 1993, Pelled et al. 1999, Brosh et al. 2000). There are many potential reasons for the failure to identify the proposed loss of purines. As described in a previous review (Shirley et al. 2007), most prior studies were conducted with non-neuronal HGprt− cell models that may not suffer the same consequences as neuronal cell models. Other studies focused on neuronal models that may not be as vulnerable to the effects of HGprt deficiency as dopamine neurons. A few studies examined purine metabolism during differentiation, but all involved mixed populations of neural and non-neural primary cells or neuroblastoma lines with low potential for differentiation (Zoref-Shani et al. 1993, Shirley et al. 2007, Snyder et al. 1978, Lewers et al. 2008).
To address the role of HGprt in purine metabolism during differentiation of a cell with both neuronal and dopaminergic properties, we developed five independent HGprt− subclones of the PC6-3 cell line, which has high levels of dopamine and exhibits robust differentiation after exposure to nerve growth factor (NGF).
Methods
Cells and culture
The PC6-3 cell line was kindly provided by Pedro Gonzalez-Alegre at the University of Iowa. These cells are a subline of PC12, a line derived from a rat pheochromocytoma with high concentrations of dopamine (Greene & Tischler 1976). The PC6-3 line was selected for its robust and consistent ability to differentiate in response to nerve growth factor (NGF) (Pittman et al. 1993). The cells were grown at 37 °C in an atmosphere of 5% CO2 and 95% air in RPMI 1640 medium supplemented with 10% horse serum (Invitrogen, Carlsbad CA), 5% fetal bovine serum (Thermo Fisher Scientific, Logan UT), 2 mM L-glutamine, 1 U/mL penicillin, and 100 μg/mL streptomycin. Because serum may contain large amounts of purine metabolites, most samples for analysis were collected after the cells were grown in dialyzed horse (Valley Biomedical, Winchester VA) or fetal bovine serum (Thermo Fisher Scientific, Logan UT).
For studies involving differentiation of the PC6-3 cells with NGF, T75 cell culture flasks were coated with rat tail collagen type I (BD Biosciences, Bedford MA) by incubating empty flasks for 1 h at room temperature in a solution of 75 μg/mL dissolved in 20 mM acetic acid, yielding 5 μg collagen per cm2. Flasks were washed once with 10 mL phosphate-buffered saline (PBS), supplemented with 12 mL of culture medium and cells were seeded in presence or absence of 50 ng/mL 2.5S NGF from the submaxillary gland of male mice (Invitrogen, Carlsbad CA). Additional cell culture media and fresh NGF were supplemented every second day.
Establishment of HGprt− mutant cell lines
To establish HGprt− sublines, cells were plated at a density of 2×10⁴ cells/well in 96-well plates in culture medium containing 90 μM 6-thioguanine (6TG, Alfa Aesar, Ward Hill MA) according to established methods (Nelson et al. 1975, Wood et al. 1973). The medium containing 6TG was replaced every 3–4 days for 4 weeks until colonies became visible. Single colonies were picked, expanded separately in medium with 6TG, and frozen in aliquots for different studies. All subsequent studies were conducted after the cells had been grown in medium without 6TG, to match conditions for the control cells.
Characterization of HGprt mutations
Total mRNA was extracted from PC6-3 parent cells and HGprt− mutant sublines using the TRIZOL method (Rio et al. 2010). Briefly, 1 mL of TRI reagent (Invitrogen, Carlsbad CA) was added to one T75 flask containing cells at 70% confluency. Cells were homogenized by passing through a pipette 3 times and transferred to 1.5 mL vials. Next, 200 μL of chloroform was added, and samples were mixed and incubated for 3 min at room temperature. Samples then were centrifuged at 12,000 g for 15 min at 4 °C, and the upper aqueous phase containing RNA was transferred into 1.5 mL vials with 500 μL isopropanol to precipitate RNA. Samples were mixed, incubated for 10 min at room temperature and centrifuged at 12,000 g for 10 min at 4°C. The RNA pellet was washed once with 75% ethanol, air-dried for 5 min and dissolved in water pretreated with diethylpyrocarbonate.
HGprt mRNA was reverse-transcribed and amplified by the polymerase chain reaction (RT-PCR) using the Superscript III One-Step system (Invitrogen) with the forward primer, ACCTCCTCCGCCAGCTTC, and the reverse primer, TGCATTTAAAAGGAACGGTTG (Eurofins MWG Operon, Huntsville AL). The RT-PCR protocol consisted of reverse transcription at 46°C for 30 min, denaturation at 94°C for 2 min and 40 cycles involving denaturation at 94°C for 15s, annealing at 47°C for 30s, and elongation at 68°C for 78s. The RT-PCR reaction concluded with a final elongation step at 68°C for 5 min. PCR products were purified following resolution on a 1.5 % (m/v) agarose gel using the QIAquick Gel Extraction system (Qiagen, Valencia CA) and cDNA was sequenced (Genewiz, South Plainfield NJ) using the same primers.
Cell growth
Population doubling times were estimated according to established procedures (Shirley et al. 2007). Briefly, cells were plated in triplicate in 24-well plates at densities of 1×10⁴, 3×10⁴, 1×10⁵. Cells were counted at daily intervals with a hemocytometer after trypan blue staining. The population doubling times were estimated by linear regression during the exponential growth phase.
HGprt enzyme measurements
HGprt activity was measured in live cells by adapting previously established methods that involve the conversion of radiolabeled hypoxanthine into inosinic acid (IMP) and related nucleotides (Wood et al. 1973, Shirley et al. 2007). Briefly, each cell line was grown to ~70% confluency in T75 flasks. Cells were detached by trypsinization, pelleted by centrifugation at 1,000 × g for 5 min, and resuspended at a concentration of 2×10⁶ cells in 500 μL in two replicates with fresh medium supplemented with 20 μM [8-14C]-hypoxanthine (55 mCi/mmol, Vitrax, Placentia CA). Cells were mixed gently for 60 min at 37°C with continuous rotation to maintain suspension and then pelleted by centrifugation. The supernatant was discarded and the pellet rinsed by suspension in 750 μL ice-cold PBS. The pelleted cells then were disrupted by the addition of 50 μL of cold 0.1M perchloric acid and vortexed, and samples were then frozen at −80°C. After thawing, samples were sonified in a Branson 1210 bath for 20 min to ensure cell disruption, insoluble materials were pelleted by centrifugation at 12,000 × g for 10 min, and 2.5 μL of the supernatant was spotted onto microplates with diethylaminoethyl anion exchange filters (Millipore, Billerica MA) which avidly binds nucleotides such as [8-14C]-IMP. Samples were allowed to adsorb for 60 min and un-reacted [8-14C]-hypoxanthine was washed from the filters once with 300 μL H2O and three times with 50% methanol in H2O by vacuum filtration using a MultiScreen HTS Vacuum Manifold (Millipore, Billerica MA). The filters were counted using a LS 6500 Multi-Purpose Scintillation Counter (Beckman Coulter, Fullerton, CA). Raw data for HGprt activity were normalized to adjust for varying cell densities at harvest by measuring total protein concentrations with the Pierce BCA kit (Thermo Fisher Scientific, Rockford, IL) as previously described (Shirley et al. 2007).
De novo purine biosynthesis
The procedure for the assessment of de novo purine biosynthesis was adapted from previous studies (Shirley et al. 2007). Cells were grown and differentiated in collagen coated T25 flasks (Corning), detached by the addition of 1 mL of TrypLE Express (Invitrogen) and transferred to 2 mL vials. Cells were pelleted by centrifugation at 350 g for 10 min and then incubated with 250 μL cell culture medium free of non-labeled glycine (DMEM; US Biological, Swampscott MA) supplemented with 25 μM [14C(U)]-glycine (Moravek Biochemicals, Brea CA) for 90 min at 37°C with continuous gentle mixing to maintain suspension. Cells then were pelleted by centrifugation and rinsed in 750 μL ice-cold PBS. Further cell disruption and sample processing were carried out as described for HGprt enzyme activity determination. Raw data for de novo activity were normalized to adjust for varying cell densities at harvest by measuring total protein concentrations with the Pierce BCA kit (Thermo Fisher Scientific, Rockford, IL) as previously described (Shirley et al. 2007).
Purine measurements
For purine measurements, cells were harvested by removing the cell culture media and adding 600 μL of cold 100 mM formic acid (puriss. p.a., Sigma-Aldrich, St. Louis MO) in methanol (HPLC grade, Sigma-Aldrich), supplemented with 0.01% (m/v) ascorbic acid (EM Science, Gibbstown NJ). Cells were detached by scraping, transferred into 1.5 mL vials, and homogenized by sonication on ice for 30 sec (Branson Sonifier 450, Danbury CT). After centrifugation at 15,000 g for 10 min at 4°C, the supernatant was transferred into new 1.5 mL vials and the pellet was used for protein determination according to the BCA method (Thermo Fisher Scientific, Logan UT). For phospholipid removal, 600 μL of hexane was added to the supernatant and samples were agitated for 30 min at 4 °C. The methanol phase was transferred into new vials, vacuum dried (SpeedVac, Thermo Fisher Scientific) and the resultant pellet was dissolved in 150 μL water. Any remaining insoluble materials were removed by filtration through 0.45 μm PVDF microcentrifuge spin filters (Alltech, Deerfield IL).
Two different methods were used to quantify purines. The first method involved HPLC with photodiode array ultraviolet detection (HPLC-UV) as described previously (Shirley et al. 2007). In brief, a Waters HPLC system consisting of model 717-plus autosampler, model 1525 binary pump and model 2996 photodiode array detector was used. Analytes were separated using reverse-phase ion-pair chromatography on an Atlantis T3 column (3 μm particle size, 4.6 × 150 mm, Waters, Milford MA). Elution was conducted at 1 mL/min with a stepped gradient of buffer A (10 mM ammonium acetate and 2 mM tetrabutylammonium phosphate, pH 5.0) and buffer B (10 mM ammonium phosphate, 2 mM tetrabutylammonium phosphate, 25% acetonitrile, pH 7.0). The gradient consisted of the following sequence: 100% buffer A for 10 minutes; a linear gradient to 75% buffer B over 15 minutes, 10 minutes at 75% buffer B, a linear gradient to 100% buffer B over 5 minutes, and 100% buffer B for 10 minutes. The column was then re-equilibrated with 100% buffer A for 15 minutes prior to the next run. Purines were identified by comparing their retention times and spectral profiles to known standards, quantified at a detection wavelength of 254 nm. This method is capable of quantifying most abundant purines of biological relevance including ATP, ADP, AMP, adenosine, adenine, GTP, GDP, guanosine, guanine, hypoxanthine and xanthine (Lewers et al. 2008, Shirley et al. 2007). However, GMP and IMP co-elute as a single peak, and some low abundance purines fall below the level of detection.
The second method involved liquid chromatography followed by tandem mass spectrometry (LC-MS/MS). This method is more sensitive and is capable of resolving GMP and IMP, but does not provide results for nucleosides and bases. Purines were analyzed on an Agilent 1100 LC system (Agilent Technologies, Santa Clara CA) coupled to a 5500QTRAP ion trap system (AB Sciex, Framingham MA). An aliquot of 40 μL of each sample was combined with 40 μL of an internal standard solution (100 ng/mL Tenofovir) and transferred into glass test tubes. Separation was achieved with a hypercarb column (30 × 4.6 mm; 5 μm; Thermo scientific) connected to a C18 security guard (Phenomenex, Torrance CA) and a column saver. The mobile phases consisted of 10 mM ammonium acetate adjusted to pH 10 with ammonium hydroxide (mobile phase A) and acetonitrile (mobile phase B). Analyte separation was performed via an 8 min gradient from 96% of mobile phase A to 40% of mobile phase A at a 0.6 mL/min flow rate. Column re-equilibration was conducted for 4 min with 96% of mobile phase A. Mass spectrometry detection was performed on a 5500QTRAP system equipped with an electrospray ionization (ESI) interface operated in positive ion mode. Analyte specific mass transitions and linear detection ranges are given in Table 1. Further parameter settings were curtain gas (nitrogen; 30 psi), collision gas (nitrogen; level 9), ion spray voltage (4500 V), ion source temperature (600 °C), ion source gas 1 (nitrogen; 60 psi) and ion source gas 2 (nitrogen; 75 psi). Data processing was performed on Analist 1.5.1 software, multivariate statistical analysis was performed with the SPSS software (IBM, Armonk NY).
Table 1.
Analyte specific mass transitions and linear range for LC-MS/MS
| Analyte | Precursor ion [m/z] | Product ion [m/z] | Linear range [pmol/sample] |
|---|---|---|---|
| AMP | 347.9 | 136.0 | 0.18 – 200 |
| ADP | 427.9 | 135.9 | 0.09 – 200 |
| ATP | 507.9 | 135.9 | 0.09 – 200 |
| GMP | 363.9 | 152.0 | 0.09 – 200 |
| GDP | 444.0 | 151.9 | 0.09 – 200 |
| GTP | 524.1 | 152.0 | 0.39 – 200 |
| IMP | 348.9 | 139.9 | 0.09 – 200 |
| IDP | 429.0 | 137.0 | 0.09 – 200 |
| ITP | 508.8 | 136.9 | 0.09 – 200 |
| cAMP | 329.9 | 136.0 | 0.09 – 200 |
| cGMP | 345.9 | 134.9 | 0.09 – 200 |
Ions are characterized by their mass/charge [m/z] ratio.
Raw data for purine analytes were normalized in all experiments to adjust for varying cell densities at harvest. Two different procedures were applied. The first method involved measuring total protein concentrations in harvested materials with the Pierce BCA kit (Thermo Fisher Scientific, Rockford, IL). Although this is the simplest method and very commonly employed as normalization in tissue culture studies, differentiated cells are significantly larger than undifferentiated cells, so they may have more total protein. Therefore, a second method was used that involved counting cell numbers before harvest with NIH ImageJ software (Version 1.38, http://rsb.info.nih.gov/ij/). Both methods generally gave similar results, although the magnitude of changes varied.
Monoamine neurotransmitters
The concentrations of dopamine and related metabolites 3,4-dihyroxyphenylacetic acid (DOPAC), homovanillic acid (HVA), and L-3,4 dihydroxyphenylalanine (DOPA) were determined according to previously published methods using an ESA HPLC system with a model 542 autosampler, model 584 pump and CoulArray electrochemical detector (Jinnah et al. 1999, Visser et al. 2002). Analytes were separated using a C18 reverse-phase MD-150 column (ESA, Chelmsford MA). Elution was conducted at 0.6 mL/min with a mobile phase consisting of 1.7 mM 1-octanesulfonic acid sodium, 25 mM EDTA, 0.01% triethylamine and 8% acetonitrile in 75 mM sodium phosphate buffer at pH 2.9. Monoamines were identified by comparing their retention times and electrochemical profiles to known standards with the electrode array detector sensors set at −175, 100, 350 and 425 mV. Monoamine analytes were normalized to adjust for varying cell densities at harvest by measuring total protein concentrations with the Pierce BCA kit (Thermo Fisher Scientific, Rockford, IL) as previously described (Shirley et al. 2007).
Data analysis
The study design incorporated three levels of replication. The first level of replication involved technical replicates, in which each assay was conducted on 3 separate samples within an experiment. Every experiment had such technical replicates, and the variance is shown for each as SEM. The second level involved parallel study of 5 independent HGprt− sublines. All 5 sublines were studied in all experiments reported, meaning that there were 5 independent replicates for each result. We focused the analytical statistics on consistent overall effects due to HGprt status, rather than idiosyncratic differences among the clones. The third level of replication involved repeating entire experiments (including technical replicates and cell subline replicates). This level of replication was only conducted where experimental differences were small, most notably the measurements of purines. For this replication, it was not considered valid to combine results from experiments done at different times into a single large statistical analysis because between-run variance is relatively high compared to within-run variance for both GC-MS and HPLC-UV. Instead, these datasets were examined separately, and the direction of any changes was compared across experiments.
For experiments involving only one experimental variable (HGprt status), one-way ANOVA with post-hoc Tukey t-tests was used to compare results from the parent PC6-3 line with each of the 5 mutant lines. For experiments involving two variables (differentiation state and HGprt status), a two-way ANOVA was used. Since the goal of these studies was to discover the effect of differentiation or HGprt status, the overall effect of each factor was examined together with any interactions. Additional statistical testing to examine individual differences between the HGprt− sublines was not conducted.
Results
Generation of HGprt− PC6-3 sublines
A total of 21 PC6-3 sublines resistant to 6TG were isolated. RT-PCR of mRNA revealed 7 distinct HPRT1 mRNA mutations (Table 2). The c.223G>T substitution causing p.53V>F was found in 10 independent colonies. The c.634G>C substitution causing p.190G>R was identified in 4 other colonies, and has been reported previously as a disease-causing mutation in humans (Jinnah et al. 2000). A deletion of 17 bases at nucleotide positions 677-693 (c.677-693del17) predicting loss of coding sequences and frame shift was found twice. Insertion of 49 base pairs between G469 and A470 (inserted fragment: TCAGTTCTACATTTACTTTTGATATACTGTTTACAGTTTTCTAAATTGG) predicting addition of amino acids with frame shift was found twice. A c.295G>T causing p.77D>Y and c.278delG causing frame shift were found once each. Also found was c.732G>T, which is unusual because it is located in non-coding sequences a few bases after the stop codon. Only one cell line for each unique mutation was examined further.
Table 2.
HGprt mutations and residual enzyme activity
| Cell line | Mutation | HGprt activity | HGprt [% control] | PDT [h] |
|---|---|---|---|---|
| PC6-3 parent | none insertion of 49 | 1400.8 ± 93.5 | 100.00 ± 6.68 | 28.4 ± 0.7 |
| PC6-3469ins49 | bases between 469-470 | 5.9 ± 2.2* | 0.42 ± 0.16 | 70.4 ± 6.7* |
| PC6-3634G>C | 634G>C | 6.4 ± 0.8* | 0.46 ± 0.05 | 37.0 ± 2.0 |
| PC6-3278delG | 278delG | 5.8 ± 2.6* | 0.41 ± 0.19 | 40.1 ± 0.8 |
| PC6-3732G>T | 732G>T deletion of 17 | 3.1 ± 0.8* | 0.22 ± 0.06 | 88.4 ± 26.3* |
| PC6-3677del17 | bases from 677-693 | 3.0 ± 0.9* | 0.21 ± 0.07 | 36.5 ± 1.2 |
HGprt activity data reflect mean values ±SEM and are given in pmol IMP formed per mg protein per h. Population doubling times (PDT) are given as mean values ±SEM in h. Asterixes indicate significant differences from the control PC6-3 line using one-way ANOVA with Tukey’s t-tests.
HGprt activity
Loss of HGprt enzyme activity in the mutant lines was confirmed by determination of incorporation of 14C-hypoxanthine into IMP and derivative nucleotides. The parent cell line showed readily detectable HGprt enzyme activity (Table 2). Among the 7 mutant lines, 5 showed <1% residual HGprt enzyme activity. Two mutants, c.223G>T and c.295G>T were found to have ~3% residual HGprt enzyme activity. One-way ANOVA followed by Tukey’s multiple comparison test showed highly significant loss of HGprt activity in every mutant line (p<0.001), but only those with <1% activity were studied further.
Cell growth and morphology
The parent PC6-3 cell line and all 5 of the HGprt− sublines with <1% residual activity grew well in the undifferentiated state and appeared healthy without obvious morphological abnormalities (Figure 1, A–F). While there were some subtle morphological differences among the lines, none of them appeared to be consistent across the HGprt− sublines. The growth rates of the HGprt− sublines were compared with the parent line by determining the population doubling time during exponential growth. The doubling time for the parent line was 28.4±0.7 h (mean ±SEM), while the mutants all were lower and ranged from 36.5±1.2 h to 88.4±26.3 h (Table 2). Although all of the mutant lines appeared to have higher PDTs, one-way ANOVA followed by Tukey’s multiple comparison test showed statistically significant increases only for two of them (c.469ins49 and c.732G>T) as compared to parent cells (p<0.05). The PDTs for all other HGprt− mutants were not significantly different from the parent cells (p>0.05). These results demonstrate considerable variability in growth rates, consistent with prior studies showing random clonal variation among subclones of a single parent culture (Shirley et al. 2007), but they suggest that some of the mutant lines grow more slowly than the parent line.
Figure 1.
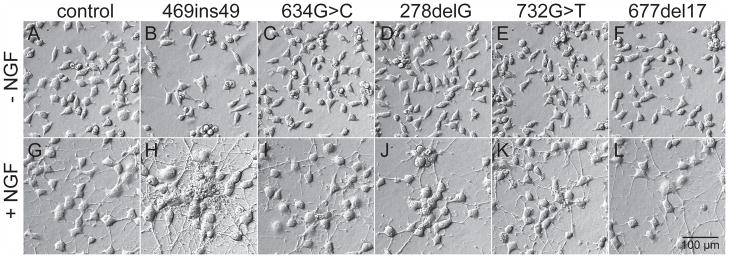
Cell morphology of parent PC6-3 and HGprt− mutants. Representative examples of parent cells (A, G) and HGprt− mutants (B–F, H–L) are shown in the undifferentiated state (top panels, A–F) and after exposure to 50 ng/mL NGF for 6 days (bottom panels, G–L).
The ability of the HGprt− sublines to differentiate after exposure to NGF also was compared with the parent line. After two days of exposure to NGF, all cultures showed typical signs of differentiation with enlargement of the soma and overt neurite outgrowth. These morphological signs were more pronounced after 4–6 days. In the differentiated state, the gross morphology for all HGprt− sublines (Figure 1, H–L) was similar to that of the parent line (Figure 1, G). There were no obvious abnormalities for neuron size, shape or neurite outgrowth. In keeping with prior studies (Shirley et al. 2007), there were some subtle differences across the HGprt− sublines. For example, the c.469ins49 and c.278delG mutants showed a greater tendency for cells to grow in clusters (Figure 1H, J). However, these morphological changes were not consistent across all the HGprt− sublines, again demonstrating random clonal variation. These results suggest that loss of HGprt has no consistent influence on the morphological features of differentiating PC6-3 cells.
Intracellular purine nucleotides
Since purine analytes may vary according to the growth conditions of the cells, pilot studies evaluated the influence of cell density at harvest. Cells were collected at different density levels, and the purine analytes were normalized to total cell numbers. Despite this normalization, cells collected at higher densities generally yielded higher levels of most purines per cell (Figure 2). These results suggest that cells maintain higher purine levels when they are grown at higher densities, and they emphasize the importance of ensuring approximately equal cell densities at harvest for subsequent experiments.
Figure 2.

Intracellular ATP and GTP as a function of cell density. Results for ATP per cell (A) and GTP per cell (B) were normalized to purine content per cell at the lowest cell density (100%) in parent PC6-3 cells. Cells were grown in the presence of 50 ng/mL NGF for 4 days. Purines were quantified via HPLC-PDA and results reflect mean values ±SEM. Similar data were obtained in at least three independent experiments.
Purine levels of all 5 HGprt− mutants with <1% HGprt activity next were compared to the PC6-3 parent line, both before differentiation, and after 6 days of differentiation (Figure 3, Table 3). Because of differences in growth rates, starting cultures were varied in density, to ensure approximately equal cell densities at harvest. In keeping with prior studies (Shirley et al. 2007), the major intracellular purines always were ATP and GTP, followed by their dephosphorylated relatives. IMP was detectable at lower concentrations. The second messenger molecule cyclic adenosine 3′:5′-monophosphate (cAMP) was detected at very low levels, but cGMP levels were about 40-fold lower and were not consistently detected.
Figure 3.

Intracellular purines before and after differentiation. Intracellular purines in parent PC6-3 cells (black bars) and HGprt− sublines (grey bars) prior to differentiation (top) and after 6 days of NGF-induced differentiation (bottom) normalized according to cell numbers reflect mean values ±SEM. Similar data were obtained in at least three independent experiments.
Table 3.
Multivariate Statistical Results for Purine Pools
| Analyte | Differentiation | HGprt status | Differentiation X HGprt status | |||
|---|---|---|---|---|---|---|
|
| ||||||
| F-value | p-value | F-value | p-value | F-value | p-value | |
| Intracellular purine nucleotides
| ||||||
| ATP | 4.9 | 0.03 | 0.2 | 0.7 | 1.4 | 0.3 |
| ADP | 0.5 | 0.5 | 0.9 | 0.4 | 0.2 | 0.7 |
| AMP | 9.4 | 0.004 | 11.1 | 0.002 | 8.9 | 0.005 |
| cAMP | 13.3 | 0.001 | 3.5 | 0.07 | 4.4 | 0.04 |
| GTP | 4.7 | 0.04 | 0.1 | 0.8 | 0.6 | 0.4 |
| GDP | 33.0 | 0.000 | 0.0 | 1.0 | 1.7 | 0.2 |
| GMP | 31.5 | 0.000 | 0.2 | 0.7 | 1.7 | 0.2 |
| IMP | 98.6 | 0.000 | 127.3 | 0.000 | 51.4 | 0.000 |
|
| ||||||
| Derived variables
| ||||||
| ANT | 4.7 | 0.04 | 0.1 | 0.8 | 1.6 | 0.2 |
| GNT | 10.2 | 0.003 | 0.1 | 0.8 | 1.1 | 0.3 |
| AEC | 4.2 | 0.049 | 2.3 | 0.1 | 0.04 | 0.9 |
| GEC | 5.0 | 0.03 | 0.1 | 0.8 | 0.3 | 0.6 |
|
| ||||||
| Extracellular purine bases and metabolites
| ||||||
| Hypoxanthine | 0.1 | 0.8 | 66.5 | 0.000 | 0.04 | 0.8 |
| Xanthine | 14.5 | 0.001 | 43.6 | 0.000 | 1.5 | 0.2 |
| Uric acid | 7.5 | 0.01 | 1.5 | 0.2 | 0.6 | 0.5 |
Data for intracellular nucleotides and extracellular metabolites were examined via separate multivariate ANOVAs because they were obtained from different sample sources using different analytical methods (HPLC-PDA vs LC-MS/MS). Data for the derived variables were examined via separate multivariate ANOVA because they are calculated variables from the original nucleotide measurements. Energy state values were calculated as the adenylate energy charge (AEC) using the formula: ([ATP]+0.5[ADP])/([ATP]+[ADP]+[AMP]) or guanylate energy charge (GEC) using the formula ([GTP]+0.5[GDP])/([GTP]+[GDP]+[GMP]). ANT = sum of adenine nucleotides (ATP+ADP+AMP); GNT = sum of guanine nucleotides (GTP+GDP+GMP).
Purine pools varied among the different cell lines before and after differentiation. This variation also is consistent with prior studies of purine pools in HGprt− M17 sublines (Shirley et al. 2007). To determine the most consistent changes, the entire dataset was subject to multivariate ANOVA with differentiation state and HGprt as explanatory variables. This analysis revealed significant main effects of differentiation for nearly all analytes, and significant main effects of HGprt for IMP and AMP (Table 3). There also were significant interactions between differentiation and HGprt for IMP, AMP and cAMP.
Most intracellular purine analytes increased after differentiation (Figure 3, Table 3). For example, ATP levels increased by ~35% from an overall mean of 992.4±65.8 to 1342.7±75.2 attomol per cell (mean ±SEM) when averaged across all 6 cell lines. Similarly, GTP levels increased by ~35% from mean values of 134.6±7.8 to 181.4±11.4 attomol per cell. In line with the increase in most purine nucleotides, the sum of all adenine nucleotides and the sum of all guanine nucleotides also increased with differentiation (Table 3).
The increase in adenine and guanine nucleotides could be an indirect consequence of increased cell sizes associated with differentiation. However, the energy charge of the differentiated cells also increased. The adenylate energy charge was calculated using the formula ([ATP] + 0.5 × [ADP])/([ATP] + [ADP] + [AMP]), which generates a value from 0 – 1 (Atkinson 1968). An increase in the AEC implies a greater proportion of more highly phosphorylated adenine nucleotides, a result that cannot be explained by an increase in total purine levels or an increase in cell size (Table 3). Similar results were obtained for the guanylate energy charge (Table 3). Compared to the parent line processed in parallel, the most consistent changes in the HGprt− subclones were low AMP levels in the undifferentiated stated and low IMP levels after differentiation (Figure 3). These results imply that HGprt affects specific purines more than others before and after differentiation.
Extracellular purines and metabolites
Extracellular medium taken from growing cells contained high levels of hypoxanthine, xanthine and uric acid (Figure 4). Consistent with findings for intracellular purine levels, multivariate ANOVA with differentiation and HGprt status as explanatory variables demonstrated significantly elevated xanthine and uric acid concentrations in extracellular medium from differentiated cells as compared to cells before differentiation, again consistent with a higher metabolism in differentiated cells (Table 3, Figure 4). With regard to HGprt deficiency, the levels of extracellular hypoxanthine were significantly increased in all of the mutants compared to the parent line (Table 3). This result is consistent with the loss of HGprt, which is required to recycle hypoxanthine to IMP. Guanine levels were below detectable limits, but significantly elevated levels of extracellular xanthine were found for all mutant lines. Uric acid was found at approximately equal levels in the parent and HGprt− lines. The metabolite pattern with non-detectable guanine levels combined with relatively high levels of xanthine imply that the parent and HGprt− sublines all have high levels of guanase, which rapidly metabolized the guanine to xanthine. The metabolite pattern with high xanthine and hypoxanthine combined with low uric acid levels also implies relatively low levels of xanthine oxidase in the parent and HGprt− sublines. However, guanase enzyme levels and xanthine oxidase enzyme levels were not directly measured. Overall, the marked increases in hypoxanthine and xanthine imply massive purine wasting in the absence of HGprt-mediated purine recycling.
Figure 4.

Extracellular purine bases and metabolites before and after differentiation. Extracellular purines in parent PC6-3 cells (black bars) and HGprt− sublines (grey bars) prior to differentiation (top) and after 6 days of NGF-induced differentiation (bottom) normalized according to cell numbers reflect mean values ±SEM. Similar data were obtained in at least three independent experiments.
Purine metabolism
Cellular purine levels are maintained by a balance between synthesis, recycling, and degradation. Because there is no published information on changes in these pathways during neuronal differentiation, the temporal pattern of HGprt-mediated purine salvage was examined in parent PC6-3 lines as they differentiated over 6 days, using a standard assay that involves incorporation of radiolabeled hypoxanthine into live cells (Shirley et al. 2007). Differentiation was associated with a reduction in HGprt activity, with undifferentiated cells having approximately twice the amount of HGprt as those after 6 days of differentiation (Figure 5). One-way ANOVA followed by Tukey’s multiple comparison test confirmed statistically significant reductions on days 4 and 6 of differentiation (p<0.001, each). HGprt-mediated purine recycling remained <1% of normal in each of the mutant lines, both before and after differentiation (not shown).
Figure 5.
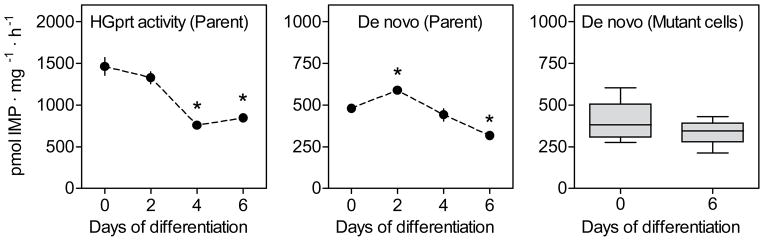
Purine metabolism in parent PC6-3 cells and HGprt− mutant subclones. HGprt activity and the rate of de novo purine biosynthesis were determined in parent and HGprt− PC6-3 cells before and after differentiation with results expressed as mean values ±SEM.
The rate of de novo purine biosynthesis also was measured in the PC6-3 parent line before and after differentiation, using a standard assay involving the incorporation of radiolabeled glycine into purines (Shirley et al. 2007). Following a slight increase in de novo synthesis after 2 days of differentiation, there was a slight decrease by 6 days of differentiation (Figure 5). One-way ANOVA plus Tukey’s multiple comparison test revealed significant differences for days 2 (p<0.05) and 6 (p<0.05) only. However, the magnitudes of these changes were small (~20–30%). These results suggest that differentiation has a big influence on HGprt activity in normal PC6-3 cells, but a less prominent influence on the rate of new purine synthesis. Comparing de novo purine biosynthesis in parent cells and HGprt− cells, two-way ANOVA analysis confirmed a significant impact of differentiation (p=0.039) and showed no significant influence of HGprt deficiency (p>0.05). In contrast to prior reports that the de novo synthetic pathway is accelerated in HGprt− cells (Becker et al. 1987, Martin & Maler 1976, Brosh et al. 1976, Reem 1973, Rosenbloom et al. 1968), it did not appear to be accelerated in the HGprt− PC6-3 lines, either before or after differentiation (Figure 5), providing no support for prior claims that increases in de novo purine synthesis compensate for the lack of HGprt-mediated purine salvage.
Monoamine neurotransmitters
Several prior studies have shown that most dopaminergic neuron-like cells that lack HGprt have markedly reduced levels of dopamine and related biochemical measures compared to the parent culture (Bitler & Howard 1986, Egami et al. 2007, Lewers et al. 2008, Smith & Friedmann 2000, Yeh et al. 1998). To determine if the same phenomenon might occur with the HGprt− PC6-3 subclones, monoamines and their metabolites were measured by HPLC-ECD. Dopamine and some of its metabolites were readily detectable in control cells before differentiation (Figure 6). Detectable levels of DOPAC imply the existence of monoamine oxidase in the cells. HVA was at or below levels of detection in most cases (not shown), suggesting low levels of catechol-O-methyltransferase. There also were relatively high levels of L-DOPA, implying low levels of amino acid decarboxylase limiting complete conversion to dopamine. NGF-mediated differentiation of the control PC6-3 cells resulted in lower levels of dopamine and DOPAC, but higher levels of L-DOPA (Figure 6).
Figure 6.

Dopamine and its metabolites in parent PC6-3 cells and HGprt− mutant subclones. Dopamine and its metabolites were measured in the parent and HGprt− PC6-3 cells before and after differentiation, with the results expressed as mean values ±SEM.
In the undifferentiated state, all HGprt− lines had significantly lower dopamine concentrations as compared to control, with the mutant line harboring the 469ins49 mutation having non-detectable amounts. The L-DOPA and DOPAC levels in the mutant lines also were relatively low compared to control cells, with DOPAC being too low to be detected in 3 of the lines. Differentiation of the HGprt− lines had effects similar to those seen in the controls, with lower levels of dopamine and DOPAC, but higher levels of L-DOPA. To reveal the most consistent and statistically significant changes, the entire dataset was subject to two-way ANOVA with differentiation and HGprt status as explanatory variable. There were significant effects of differentiation for dopamine (F=168.9, p<0.001) and DOPAC (F=104.8, p<0.001) but not for L-DOPA (F=3.0, p=0.09). There were significant effects of HGprt status for dopamine (F=196.5, p<0.001), DOPAC (F=138.5, p<0.001), and L-DOPA (F= 6.1, p=0.019). The interaction between differentiation and HGprt was significant for both dopamine (F=131.5, p<0.001) and DOPAC (F=92.7, p<0.001), but not for L-DOPA (F=1.1, p=0.3). These results confirm that loss of HGprt− is associated with a relatively robust and consistent loss of dopamine and some of its metabolites in PC6-3 cells, similar to other HGprt− dopaminergic neuron-like cells (Bitler & Howard 1986, Egami et al. 2007, Lewers et al. 2008, Smith & Friedmann 2000, Yeh et al. 1998).
Discussion
The results from these studies show how purine pools and purine metabolism change during differentiation of a cell line with neuronal properties and high levels of dopamine. On one hand, most purines and the energy charge increased during differentiation. On the other hand, both de novo purine synthesis and HGprt-mediated purine recycling decreased with differentiation. The results also reveal consequences of impaired HGprt-mediated purine recycling. A few specific intracellular purines were moderately decreased when HGprt was missing, but dopamine and its metabolites were more significantly decreased. The results point to potential mechanisms for underlying neuronal dysfunction in Lesch-Nyhan disease.
Purines and neuronal differentiation
Purines have been shown to influence many aspects of neuronal development and differentiation. A trophic effect has been demonstrated for multiple purines (Zimmermann 2011, Burnstock et al. 2011, Neary & Zimmermann 2009, Rathbone et al. 1999). Neurite outgrowth and remodeling of synaptic specializations is regulated through a large family of GTP-dependent GTPases such as Rac, Ras, and Rho (de Curtis 2008, Hall & Lalli 2010, Luo 2000). The G-protein signaling pathways also are purine dependent, with many operating through the purines cAMP or cGMP as second messengers.
The relevance of purines for neuronal differentiation and function is highlighted by several rare inherited disorders affecting purine metabolism (Nyhan 2005, Jinnah et al. 2013, Jurecka 2009, Camici et al. 2010). Abnormalities of HGprt-mediated purine recycling are associated with the unique neurobehavioral phenotype of Lesch-Nyhan disease, abnormalities of adenylosuccinate-lyase with global psychomotor retardation and autistic features, abnormalities of myoadenylate deaminase with myopathy, and abnormalities of phosphoribosylpyrophophate synthase with neuropathy or hearing or visual loss. Each of these disorders has a unique clinical phenotype, highlighting the selective vulnerability of different portions of the nervous system to defects in specific pathways.
Despite the known importance of purines in neuronal differentiation and function, no prior studies have provided a comprehensive assessment of changes in purine pools with neuronal differentiation. The current studies demonstrate that most purines increased with NGF-mediated differentiation of the PC6-3 neuroblastoma line. At the same time, both purine synthesis and recycling decreased. The increased purine levels despite decreased synthesis and salvage may reflect the post-mitotic state of differentiating neurons. Presumably, a higher intracellular purine content may be achieved because fewer purines are being consumed as building blocks for DNA and RNA synthesis required for cell division.
Consequences of HGprt deficiency for purine metabolism
Multiple prior studies have reported on purine levels in HGprt− cell models of Lesch-Nyhan disease. A review of these studies pointed to a lack of consistent changes, with different studies variably reporting either decreased or increased adenine or guanine nucleotides (Shirley et al. 2007). However, most of these studies found no significant change in purine pools when HGprt is lost. There are several potential reasons for these inconsistencies. One reason is that prior studies involved a variety of different cell types including erythrocytes, leukocytes, fibroblasts, glioma, neuroblastoma, and primary neuronal and glial cells. It seems likely that purine metabolism and the consequences of HGprt vary among different types of cells. Because the most serious clinical manifestations of Lesch-Nyhan disease involve neurobehavioral defects, the relevant changes in purine pools may manifest only in neuron-like cells. Indeed, the relevant purine changes may be limited to specific neuronal populations, because the different clinical syndromes resulting from defects in different purine pathways suggest selective neuronal vulnerability. Prior studies have implied that dopamine neurons are particularly vulnerable to the consequences of HGprt deficiency (Visser et al. 2000, Baumeister & Frye 1985, Nyhan 2000, Saito & Takashima 2000). Further, recent studies showing that HGprt deficiency impacts neuronal differentiation suggest that the relevant purine changes may be limited to certain stages in neuronal differentiation (Ceballos-Picot et al. 2009, Guibinga et al. 2010, Cristini et al. 2010). In view of these concerns, the current studies evaluated the effect of HGprt deficiency in a homogenous population of neuron-like cells with dopaminergic properties, both before and after differentiation.
Another reason for the conflicting results of prior studies of the consequences of HGprt deficiency on purine levels is that most evaluated only a single HGprt− cell line. Unfortunately, many parent cell cultures used to derive HGprt− sublines consist of mixed populations that arise as a consequence of random genetic drift during culture. It is well known that individual sublines derived from these mixed populations often exhibit random variations that differ from the parent line (Ciccarone et al. 1989, Clementi et al. 1992, Koike & Takashima 1984). Such random variation was evident in HGprt− sublines in prior studies of the MN9D and M17 lines (Lewers et al. 2008, Shirley et al. 2007). It also was evident in the current studies with PC6-3 lines for many important biological measures such as growth rates (Table 2), morphology (Figure 1), purine content (Figure 3–4), and dopamine or its metabolites (Figure 6). Thus the strategy of relying on a single HGprt− subline makes it difficult to know whether specific changes are related to random variation or the loss of HGprt. To ensure that the biological properties examined in the current studies reflect the effect of HGprt deficiency and not random variation, we used a previously developed strategy that involved searching for common defects across a battery of 5 independent HGprt− sublines, each with different mutations (Lewers et al. 2008, Shirley et al. 2007). This strategy, based on concurrent evaluation of multiple sublines, decreases the potential influence of idiosyncratic properties of a single subline, and identifies changes most consistently associated with the loss of HGprt. With this strategy, statistically significant differences across the whole group are more biologically relevant than idiosyncratic differences among the individual HGprt− sublines.
The results showed HGprt deficiency to be associated with a significant and consistent reduction in IMP, only after differentiation. This finding is not surprising, since IMP is a direct product of HGprt. There also was a reduction in AMP, an immediate downstream product of IMP, in the non-differentiated state. These results imply a small reduction in isolated purine nucleotides. However, these reductions could become limiting under periods of increased metabolic demand.
Although comparisons of prior studies reveal many inconsistencies, one frequent but not universal finding has been that HGprt− cells have an increase in de novo purine synthesis (Shirley et al. 2007). The increase in purine synthesis has been attributed to glutamine limitation, and therefore may be an artifact of culture conditions (Taylor et al. 1979, Hershfield & Seegmiller 1977, Raivio & Seegmiller 1973). In the current studies where glutamine was not limiting, the absence of HGprt had no effect on purine synthesis. Whether glutamine limitation occurs in vivo is unknown.
Consequences of HGprt deficiency for dopamine metabolism
Another frequent finding among prior studies has been a significant decrease in dopamine and related metabolites in HGprt− cell lines. Dopamine levels are significantly reduced in most HGprt− sublines of rat PC12, mouse MN9D, and primary midbrain dopamine neurons from the HGprt− mouse (Egami et al. 2007, Lewers et al. 2008, Smith & Friedmann 2000, Bitler & Howard 1986). However, the loss of dopamine is not universal, because HGprt− sublines of the human M17 neuroblastoma lines had normal dopamine levels (Shirley et al. 2007).
The current studies show a significant loss of dopamine in all 5 HGprt− sublines of PC6-3 (Figure 6), even in the undifferentiated state when changes in purines were minimal. There are several potential reasons why dopamine levels may be more profoundly reduced when purine levels seem less affected. First, steady-state purine levels may underestimate more serious but transient reductions in purines during specific physiological conditions, such as when a cell is dividing or depolarized. Borderline or transiently low purine levels also may result in chronic down-regulation of dopamine levels to protect the cells from toxic effects of dopamine. Second, extracellular purines released by the cells may exert autocrine effects to alter the regulation of steady-state dopamine levels. Finally, the selection process for HGprt− cells may coincidentally select sublines with very low dopamine levels, because the combination of HGprt-deficiency and high dopamine levels may be detrimental to survival. The mechanisms responsible for the loss of dopamine remain unclear, and further studies clearly are needed to understand the nature of the relationships between purine salvage and dopamine metabolism.
Limitations
Although the focus of the current studies on HGprt-mediated purine recycling in the differentiation of a dopamine-like neuron addresses some of the shortcomings of prior studies, several limitations still exist. One of the limitations is that it is difficult to know how findings from a cell culture model relate to the developing brain in vivo (Jinnah 2009). Unfortunately, it currently is not technically feasible to measuring purines in developing neurons in the living human brain. Another limitation is that the PC6-3 cell line has some dopaminergic features, but is not directly analogous to a midbrain dopamine neuron, the population that seems most affected by HGprt deficiency (Lewers et al. 2008, Shirley et al. 2007). In fact, there are no cell models that precisely mimic all aspects of a developing midbrain dopamine neuron in vitro in a homogenous preparation that allows discrimination from contaminating cell populations such as glia. A third limitation is that the rat PC6-3 line may not precisely model the human condition, because differences in purine metabolism exist among different species (Keebaugh et al. 2006). A final limitation is that the current studies do not address changes in purine pools in different neuronal compartments such as cell soma, dendrites and axons. It seems likely that purine concentrations and functions vary enormously in different microenvironments within the neuron (Mikolaenko et al. 2005). The development of methods to sample and measure purine pools in different cellular compartments would be useful in this regard.
The current studies scratch the surface of a very complex and poorly understood topic involving the regulation of purine levels in the nervous system. Considering the central importance of purines for so many different aspects of neuronal differentiation and function, and their relationship to multiple different neurological diseases, further studies are warranted. Such studies might help to unravel the highly characteristics neurological and behavioral syndromes associated with inherited defects of specific enzymes in purine metabolism.
Acknowledgments
This work was supported by a grant from the National Institutes of Health (R24 DK082840).
Abbreviations
- ANT
adenine nucleotide
- cAMP, cyclic adenosine 3′
5′-monophosphate
- GNT
guanine nucleotide
- HGprt
hypoxanthine-guanine phosphoribosyltransferase
- HX
hypoxanthine
- IMP
inosine 5′-monophosphate
- LND
Lesch-Nyhan Disease
- N/A
not available
Footnotes
The authors declare no conflict of interest.
References
- Atkinson DE. The energy charge of the adenylate pool as a regulatory parameter: interaction with feedback modifiers. Biochem. 1968;7:4030–4034. doi: 10.1021/bi00851a033. [DOI] [PubMed] [Google Scholar]
- Baumeister AA, Frye GD. The biochemical basis of the behavioral disorder in the Lesch-Nyhan syndrome. Neurosci Biobehav Rev. 1985;9:169–178. doi: 10.1016/0149-7634(85)90043-0. [DOI] [PubMed] [Google Scholar]
- Becker MA, Losman MJ, Kim M. Mechanisms of accelerated purine nucleotide synthesis in human fibroblasts with superactive phosphoribosylpyrophosphate synthetases. J Biol Chem. 1987;262:5596–5602. [PubMed] [Google Scholar]
- Bitler CM, Howard BD. Dopamine metabolism in hypoxanthine-guanine phosphoribosyltransferase-deficient variants of PC12 cells. J Neurochem. 1986;47:107–112. doi: 10.1111/j.1471-4159.1986.tb02837.x. [DOI] [PubMed] [Google Scholar]
- Brosh S, Boer P, Kupfer B, De Vries A, Sperling O. De novo synthesis of purine nucleotides in human peripheral blood leukocytes. J Clin Invest. 1976;58:289–297. doi: 10.1172/JCI108471. [DOI] [PMC free article] [PubMed] [Google Scholar]
- Brosh S, Boer P, Sperling O, Zoref-Shani E. Elevated UTP and CTP content in cultured neurons from HPRT-deficient transgenic mice. J Mol Neurosci. 2000;14:87–91. doi: 10.1385/JMN:14:1-2:087. [DOI] [PubMed] [Google Scholar]
- Burnstock G, Krugel U, Abbracchio MP, Illes P. Purinergic signalling: from normal behaviour to pathological brain function. Prog Neurobiol. 2011;95:229–274. doi: 10.1016/j.pneurobio.2011.08.006. [DOI] [PubMed] [Google Scholar]
- Camici M, Micheli V, Ipata PL, Tozzi MG. Pediatric neurological syndromes and inborn errors of purine metabolism. Neurochem Int. 2010;56:367–378. doi: 10.1016/j.neuint.2009.12.003. [DOI] [PubMed] [Google Scholar]
- Ceballos-Picot I, Mockel L, Potier MC, Dauphinot L, Shirley TL, Torero-Ibad R, Fuchs J, Jinnah HA. Hypoxanthine-guanine phosphoribosyl transferase regulates early developmental programming of dopamine neurons: implications for Lesch-Nyhan disease pathogenesis. Hum Mol Genet. 2009;18:2317–2327. doi: 10.1093/hmg/ddp164. [DOI] [PMC free article] [PubMed] [Google Scholar]
- Ciccarone V, Spengler BA, Meyers MB, Biedler JL, Ross RA. Phenotypic diversification in human neuroblastoma cells: expression of distinct neural crest lineages. Cancer Res. 1989;49:219–225. [PubMed] [Google Scholar]
- Clementi E, Racchetti G, Zacchetti D, Panzeri MC, Meldolesi J. Differential expression of markers and activities in a group of PC12 nerve cell clones. Eur J Neurosci. 1992;4:944–953. doi: 10.1111/j.1460-9568.1992.tb00121.x. [DOI] [PubMed] [Google Scholar]
- Cristini S, Navone S, Canzi L, et al. Human neural stem cells: a model system for the study of Lesch-Nyhan disease neurological aspects. Hum Mol Genet. 2010;19:1939–1950. doi: 10.1093/hmg/ddq072. [DOI] [PubMed] [Google Scholar]
- de Curtis I. Functions of Rac GTPases during neuronal development. Dev Neurosci. 2008;30:47–58. doi: 10.1159/000109851. [DOI] [PubMed] [Google Scholar]
- Egami K, Kasim S, Widnell K, Jinnah HA. Neuroanatomical basis for reduced striatal dopamine in a genetic mouse model for Lesch-Nyhan disease. Soc Neurosci Abstr 2002 [Google Scholar]
- Egami K, Yitta S, Kasim S, Lewers JC, Roberts RC, Lehar M, Jinnah HA. Basal ganglia dopamine loss due to defect in purine recycling. Neurobiol Dis. 2007;26:396–407. doi: 10.1016/j.nbd.2007.01.010. [DOI] [PMC free article] [PubMed] [Google Scholar]
- Greene LA, Tischler A. Establishment of a noradrenergic clonal line of rat adrenal pheochromocytoma cells with respond to nerve growth factor. Proc Natl Acad Sci (USA) 1976;73:2424–2428. doi: 10.1073/pnas.73.7.2424. [DOI] [PMC free article] [PubMed] [Google Scholar]
- Guibinga GH, Hsu S, Friedmann T. Deficiency of the housekeeping gene hypoxanthine-guanine phosphoribosyltransferase (HPRT) dysregulates neurogenesis. Mol Ther. 2010;18:54–62. doi: 10.1038/mt.2009.178. [DOI] [PMC free article] [PubMed] [Google Scholar]
- Hall A, Lalli G. Rho and Ras GTPases in axon growth, guidance, and branching. Cold Spring Harb Perspect Biol. 2010;2:a001818. doi: 10.1101/cshperspect.a001818. [DOI] [PMC free article] [PubMed] [Google Scholar]
- Hershfield MS, Seegmiller JE. Regulation of de novo purine synthesis in human lymphoblasts. J Biol Chem. 1977;252:6002–6010. [PubMed] [Google Scholar]
- Jinnah HA. Lesch-Nyhan disease: from mechanism to model and back again. Dis Model Mech. 2009;2:116–121. doi: 10.1242/dmm.002543. [DOI] [PMC free article] [PubMed] [Google Scholar]
- Jinnah HA, DeGregorio L, Harris JC, Nyhan WL, O’Neill JP. The spectrum of inherited mutations causing HPRT deficiency: 75 new cases and a review of 196 previously reported cases. Mutat Res. 2000;463:309–326. doi: 10.1016/s1383-5742(00)00052-1. [DOI] [PubMed] [Google Scholar]
- Jinnah HA, Friedmann T. Lesch-Nyhan disease and its variants. In: Scriver CR, Beaudet AL, Sly WS, Valle D, editors. The metabolic and molecular bases of inherited disease. McGraw-Hill; New York: 2001. pp. 2537–2570. [Google Scholar]
- Jinnah HA, Jones MD, Wojcik BE, Rothstein JD, Hess EJ, Friedmann T, Breese GR. Influence of age and strain on striatal dopamine loss in a genetic mouse model of Lesch-Nyhan disease. J Neurochem. 1999;72:225–229. doi: 10.1046/j.1471-4159.1999.0720225.x. [DOI] [PubMed] [Google Scholar]
- Jinnah HA, Langlais PJ, Friedmann T. Functional analysis of brain dopamine systems in a genetic mouse model of Lesch-Nyhan syndrome. J Pharmacol Exp Ther. 1992;263:596–607. [PubMed] [Google Scholar]
- Jinnah HA, Page T, Friedmann T. Brain purines in a genetic mouse model of Lesch-Nyhan disease. J Neurochem. 1993;60:2036–2045. doi: 10.1111/j.1471-4159.1993.tb03488.x. [DOI] [PubMed] [Google Scholar]
- Jinnah HA, Sabina RL, Van Den Berghe G. Metabolic disorders of purine metabolism affecting the nervous system. Handb Clin Neurol. 2013;113:1827–1836. doi: 10.1016/B978-0-444-59565-2.00052-6. [DOI] [PMC free article] [PubMed] [Google Scholar]
- Jinnah HA, Visser JE, Harris JC, et al. Delineation of the motor disorder of Lesch-Nyhan disease. Brain. 2006;129:1201–1217. doi: 10.1093/brain/awl056. [DOI] [PMC free article] [PubMed] [Google Scholar]
- Jinnah HA, Wojcik BE, Hunt MA, Narang N, Lee KY, Goldstein M, Wamsley JK, Langlais PJ, Friedmann T. Dopamine deficiency in a genetic mouse model of Lesch-Nyhan disease. J Neurosci. 1994;14:1164–1175. doi: 10.1523/JNEUROSCI.14-03-01164.1994. [DOI] [PMC free article] [PubMed] [Google Scholar]
- Jurecka A. Inborn errors of purine and pyrimidine metabolism. J Inherit Metab Dis. 2009;32:247–263. doi: 10.1007/s10545-009-1094-z. [DOI] [PubMed] [Google Scholar]
- Keebaugh AC, Sullivan RT, Thomas JW. Gene duplication and inactivation in the HPRT gene family. Genomics. 2006;89:134–142. doi: 10.1016/j.ygeno.2006.07.003. [DOI] [PubMed] [Google Scholar]
- Koike T, Takashima A. Clonal variability of PC12 pheochromocytoma cells with respect to catecholamine biosynthesis. J Neurochem. 1984;42:1472–1475. doi: 10.1111/j.1471-4159.1984.tb02812.x. [DOI] [PubMed] [Google Scholar]
- Lewers JC, Ceballos-Picot I, Shirley TL, Mockel L, Egami K, Jinnah HA. Consequences of impaired purine recycling in dopaminergic neurons. Neuroscience. 2008;152:761–772. doi: 10.1016/j.neuroscience.2007.10.065. [DOI] [PMC free article] [PubMed] [Google Scholar]
- Lloyd KG, Hornykiewicz O, Davidson L, Shannak K, Farley I, Goldstein M, Shibuya M, Kelley WN, Fox IH. Biochemical evidence of dysfunction of brain neurotransmitters in the Lesch-Nyhan syndrome. N Engl J Med. 1981;305:1106–1111. doi: 10.1056/NEJM198111053051902. [DOI] [PubMed] [Google Scholar]
- Luo L. Rho GTPases in neuronal morphogenesis. Nature Rev Neurosci. 2000;1:173–180. doi: 10.1038/35044547. [DOI] [PubMed] [Google Scholar]
- Martin DW, Maler BA. Phosphoribosylpyrophosphate synthetase is elevated in fibroblasts from patients with the Lesch-Nyhan syndrome. Science. 1976;193:408–411. doi: 10.1126/science.180603. [DOI] [PubMed] [Google Scholar]
- Mastrangelo L, Kim JE, Miyanohara A, Kang TH, Friedmann T. Purinergic signaling in human pluripotent stem cells is regulated by the housekeeping gene encoding hypoxanthine guanine phosphoribosyltransferase. Proc Natl Acad Sci U S A. 2012;109:3377–3382. doi: 10.1073/pnas.1118067109. [DOI] [PMC free article] [PubMed] [Google Scholar]
- Mikolaenko I, Rao LM, Roberts RC, Kolb B, Jinnah HA. A Golgi study of neuronal architecture in a genetic mouse model for Lesch-Nyhan disease. Neurobiol Dis. 2005;20:479–490. doi: 10.1016/j.nbd.2005.04.005. [DOI] [PubMed] [Google Scholar]
- Neary JT, Zimmermann H. Trophic functions of nucleotides in the central nervous system. Trends Neurosci. 2009;32:189–198. doi: 10.1016/j.tins.2009.01.002. [DOI] [PubMed] [Google Scholar]
- Nelson JA, Carpenter JW, Rose LM, Adamson DJ. Mechanisms of action of 6-thioguanine, 6-mercaptopurine, and 8-azaguanine. Cancer Res. 1975;35:2872–2878. [PubMed] [Google Scholar]
- Nyhan WL. Dopamine function in Lesch-Nyhan disease. Environ Health Persp. 2000;108:409–411. doi: 10.1289/ehp.00108s3409. [DOI] [PMC free article] [PubMed] [Google Scholar]
- Nyhan WL. Disorders of purine and pyrimidine metabolism. Mol Genet Metab. 2005;86:25–33. doi: 10.1016/j.ymgme.2005.07.027. [DOI] [PubMed] [Google Scholar]
- Pelled D, Sperling O, Zoref-Shani E. Abnormal purine and pyrimidine nucleotide content in primary astroglial cultures from hypoxanthine-guanine phosphoribosyltransferase-deficient mice. J Neurochem. 1999;72:1139–1145. doi: 10.1046/j.1471-4159.1999.0721139.x. [DOI] [PubMed] [Google Scholar]
- Pittman RN, Wang S, DiBenedetto AJ, Mills JC. A system for characterizing cellular and molecular events in programmed neuronal cell death. J Neurosci. 1993;13:3669–3680. doi: 10.1523/JNEUROSCI.13-09-03669.1993. [DOI] [PMC free article] [PubMed] [Google Scholar]
- Raivio KO, Seegmiller JE. Role of glutamine in purine synthesis and in guanine nucleotide formation in normal fibroblasts and in fibroblasts deficient in hypoxanthine phosphoribosyltransferase activity. Biochim Biophys Acta. 1973;299:283–292. doi: 10.1016/0005-2787(73)90351-1. [DOI] [PubMed] [Google Scholar]
- Rathbone MP, Middlemiss PM, Gysbers JW, Andrew C, Herman MAR, Reed JK, Ciccarelli R, Di Iorio P, Caciagli F. Trophic effects of purine in neurons and glial cells. Prog Neurobiol. 1999;59:663–690. doi: 10.1016/s0301-0082(99)00017-9. [DOI] [PubMed] [Google Scholar]
- Reem GH. Regulation of de novo purine synthesis in the Lesch-Nyhan syndrome. Adv Exp Med Biol. 1973;41:245–253. doi: 10.1007/978-1-4684-3294-7_30. [DOI] [PubMed] [Google Scholar]
- Rio DC, Ares M, Jr, Hannon GJ, Nilsen TW. Purification of RNA using TRIzol (TRI reagent) Cold Spring Harb Protoc. 2010 doi: 10.1101/pdb.prot5439. 2010pdb prot5439. [DOI] [PubMed] [Google Scholar]
- Rosenbloom FM, Henderson JF, Caldwell IC, Kelley WN, Seegmiller JE. Biochemical bases of accelerated purine biosynthesis de novo in human fibroblasts lacking hypoxanthine-guanine phosphoribosyltransferase. J Biol Chem. 1968;243:1166–1173. [PubMed] [Google Scholar]
- Saito Y, Takashima S. Neurotransmitter changes in the pathophysiology of Lesch-Nyhan syndrome. Brain Dev. 2000;22(Suppl 1):S122–S131. doi: 10.1016/s0387-7604(00)00143-1. [DOI] [PubMed] [Google Scholar]
- Schretlen DS, Harris JC, Park KS, Jinnah HA, Ojeda del Pozo N. Neurocognitive functioning in Lesch-Nyhan disease and partial hypoxanthine-guanine phosphoribosyltransferase deficiency. J Int Neuropsychol Soc. 2001;7:805–812. doi: 10.1017/s135561770177703x. [DOI] [PubMed] [Google Scholar]
- Schretlen DS, Ward J, Meyer SM, Yun J, Puig JG, Nyhan WL, Jinnah HA, Harris JC. Behavioral aspects of Lesch-Nyhan disease and it variants. Dev Med Child Neurol. 2005;47:673–677. doi: 10.1017/S0012162205001374. [DOI] [PubMed] [Google Scholar]
- Shirley TL, Lewers JC, Egami K, Majumdar A, Kelly M, Ceballos-Picot I, Seidman MM, Jinnah HA. A human neuronal tissue culture model for Lesch-Nyhan disease. J Neurochem. 2007;101:841–853. doi: 10.1111/j.1471-4159.2007.04472.x. [DOI] [PubMed] [Google Scholar]
- Smith D, Friedmann T. Characterization of the dopamine defect in primary cultures of dopaminergic neurons from hypoxanthine phosphoribosyltransferase knockout mice. Mol Ther. 2000;1:486–491. doi: 10.1006/mthe.2000.0057. [DOI] [PubMed] [Google Scholar]
- Snyder FF, Cruikshank MK, Seegmiller JE. A comparison of purine metabolism and nucleotide pools in normal and hypoxanthine-guanine phosphoribosyltransferase-deficient neuroblastoma cells. Biochem Biophys Acta. 1978;543:556–569. doi: 10.1016/0304-4165(78)90310-0. [DOI] [PubMed] [Google Scholar]
- Taylor MW, Tokito M, Gupta KC. Lack of enhanced purine biosynthesis in HGPRT- and Lesch-Nyhan cells. Hum Hered. 1979;29:187–192. doi: 10.1159/000153039. [DOI] [PubMed] [Google Scholar]
- Visser JE, Baer PR, Jinnah HA. Lesch-Nyhan syndrome and the basal ganglia. Brain Res Rev. 2000;32:449–475. doi: 10.1016/s0165-0173(99)00094-6. [DOI] [PubMed] [Google Scholar]
- Visser JE, Smith DW, Moy SS, Breese GR, Friedmann T, Rothstein JD, Jinnah HA. Oxidative stress and dopamine deficiency in a genetic mouse model of Lesch-Nyhan disease. Dev Brain Res. 2002;133:127–139. doi: 10.1016/s0165-3806(02)00280-8. [DOI] [PubMed] [Google Scholar]
- Wood AW, Becker MA, Minna JD, Seegmiller JE. Purine metabolism in normal and thioguanine-resistant neuroblastoma. Proc Natl Acad Sci (USA) 1973;70:3880–3883. doi: 10.1073/pnas.70.12.3880. [DOI] [PMC free article] [PubMed] [Google Scholar]
- Yeh J, Zheng S, Howard BD. Impaired differentiation of HPRT-deficient dopaminergic neurons: a possible mechanism underlying neuronal dysfunction in Lesch-Nyhan syndrome. J Neurosci Res. 1998;53:78–85. doi: 10.1002/(SICI)1097-4547(19980701)53:1<78::AID-JNR8>3.0.CO;2-G. [DOI] [PubMed] [Google Scholar]
- Zimmermann H. Purinergic signaling in neural development. Semin Cell Dev Biol. 2011;22:194–204. doi: 10.1016/j.semcdb.2011.02.007. [DOI] [PubMed] [Google Scholar]
- Zoref-Shani E, Bromberg Y, Brosh S, Sidi Y, Sperling O. Characterization of alterations in purine nucleotide metabolism in hypoxanthine-guanine phosphoribosyltransferase-deficient rat neuroma cell line. J Neurochem. 1993;61:457–463. doi: 10.1111/j.1471-4159.1993.tb02146.x. [DOI] [PubMed] [Google Scholar]