

Introduction
Optic nerve is part of the central nervous system (CNS) and the pathway to transfer visual information from retina to brain. Optic nerve disorders during the developmental period may lead to partial or complete loss of sight. Developmental anomalies of optic nerve are the leading cause of infant blindness (Garcia-Filion et al., 2008). Also, damaged optic nerve can result in glaucoma (Beck, 2001) and causes photophobia, lacrimation or blepharospasm (deLuise and Anderson, 1983; Ho and Walton, 2004).
Diffusion tensor imaging (DTI) (Le Bihan et al., 2001; Zhou, 2004) is a non-invasive magnetic resonance imaging (MRI) technique and has been used widely to investigate white matter development and integrity in human brains (Alexander et al., 2007; Hermoye et al., 2006; Huppi and Dubois, 2006; Pavuluri et al., 2009; Thomason and Thompson, 2011). Fractional anisotropy (FA) and mean diffusivity (MD) are general measures used to quantitatively characterize the microstructural changes in white matter fiber bundles. Meanwhile, axial diffusivity (λ∥) and radial diffusivity (λ⊥) can provide additional information regarding tissue microstructure and axon and myelin pathology (Counsell et al., 2006; Naismith et al., 2010; Song et al., 2003; Sun et al., 2006). DTI has been explored recently in the optic nerve examination of adult patients (Kolbe et al., 2009; Salmela et al., 2010; Trip et al., 2006; Wheeler-Kingshott et al., 2006; Xu et al., 2008), children (Filippi et al., 2012; Nickerson et al., 2010), monkeys (Coimbra et al., 2009), rats (Song et al., 2003) and mice (Xu et al., 2008), demonstrating that DTI can be an effective means to evaluate the optic nerve abnormalities non-invasively.
Optic nerve development has been studied previously by using light and electron microscopic methods on specimens of humans (Dolman et al., 1980; Magoon and Robb, 1981), monkeys (Morrison et al., 1990; Sandell and Peters, 2001) and rats (Horsburgh and Sefton, 1986; Kuwabara, 1975). However, In vivo investigation of optic nerve is hindered by difficulties to access it non-invasively except for the intraocular part (optic nerve head). In recent years, DTI has been exploited increasingly to assess the optic nerve abnormality in adult and child patients. However, its application in the developmental examination of human and animal optic nerve after birth remains to be explored.
In comparison with the rodent models of optic nerve diseases, non-human primates (NHP) resemble almost all aspects of human eyes including the visual pathway, functionality, and brain anatomical structure. It is an ideal model for investigating the developmental disorders of visual pathway, aging and neuropathology (Levkovitch-Verbin, 2004; Morrison et al., 1990; Sandell and Peters, 2001, 2002; Yang et al., 2009). The aim of the present study was to examine the diffusion property changes during the optic nerve development of NHPs from birth to adulthood by using DTI.
Material and Methods
Animals and preparations
Forty healthy rhesus monkeys aged from two weeks old to 6 years (72 months) old were divided into 8 different age groups with 5 animals in each group (Table 1).
Table 1.
Demographics of rhesus monkeys in each age group (n=5).
| Age group | 2w | 3m | 6m | 12m | 20m | 30m | 44m | 72m |
|---|---|---|---|---|---|---|---|---|
| Mean age | 14.6 d | 2.80 m | 5.6 m | 12.0 m | 19.7 m | 30.5 m | 43.7 m | 72.1 m |
| SD | 0.9 d | 0.04 m | 0.2 m | 0.2 m | 1.0 m | 0.6 m | 2.0 m | 0.9 m |
D: day, w: week, m: month
The animals were initially anesthetized with ketamine (5-10 mg/kg, IM), then orally intubated. An IV catheter was placed for delivering lactated ringers solution (3.5-10 ml/kg/hr) in the scanner. Animals were anesthetized with 1-1.5% isoflurane mixed with 100% O2 during scanning. The body temperature was maintained at 37.5°C by a feedback-regulated circulating warm-water blanket. The anesthetized spontaneously-breathing animals were immobilized with a custom-made head holder and placed in the “supine” position in the scanner. Et-CO2, inhaled CO2, O2 saturation, blood pressure, the mean arterial pressure (MAP), heart rate, respiration rate, and body temperature were monitored continuously and maintained in addition to visual inspection of animals every 30 minutes. All procedures were approved by the Institutional Animal Care and Use Committee (IACUC) of Emory University in accordance with the NIH Guide for Care and Use of Laboratory Animals.
MRI
MRI scans were performed on a Siemens Trio 3T scanner (Siemens Medical Solutions, PA, USA) with an 8-channel phase-array volume coil (INVIVO, Orlando, FL). A double-spin echo single-shot echo-planar imaging (EPI) sequence with GRAPPA (Acceleration factor R = 3) was utilized with the acquisition parameters: TR = 5000 ms / TE = 86 ms, FOV = 83 mm × 83 mm, data matrix = 64 × 64, 1.3 mm isotropic resolution, b-value = 0, 1000 s/mm2, 60 gradient directions, 10 averages. The total DTI acquisition time is about 60 minutes. High-resolution T1-weighted images were acquired with the 3D MPRAGE sequence for the structural identification of optic nerve. The acquisition parameters were: TR = 3000 ms, TE = 3.3 ms, TI = 950ms, FOV = 116 mm × 116 mm, data matrix = 192 × 192, 0.6 mm isotropic resolution.
Data analysis
DTI data from each animal was motion- and eddy-current corrected and then averaged for generating MD, FA, λ∥ and λ⊥ maps by using FSL 4.1.3 (http://www.fmrib.ox.ac.uk/fsl/). Meanwhile, all the maps were interpolated by a factor of 2 in all the three dimensions. By using MRIcro 1.4 (http://www.mricro.com), regions of interests (ROIs) were selected manually on the coronal MD maps (Fig. 1(d), bottom image), and consisted of a set of consecutive pixels (~4 pixels in infants and ~7 pixels in adults) in the central optic nerve, across all slices located between the anterior and posterior quarters of each optic nerve (Fig. 1(d), top image). Also, the ROIs were cross-verified visually in the three-dimensional views of corresponding b0 images and FA maps. As no significant difference was observed between the left and right optic nerves in each age group(see Results section for more details), the values of MD, FA, λ∥ and λ⊥ in each ROI were calculated and averaged across both optic nerves of each animal for further analysis The interpolation and mean value calculation were implemented with home-developed Matlab (The MathWorks, Inc.) scripts.
Fig. 1.
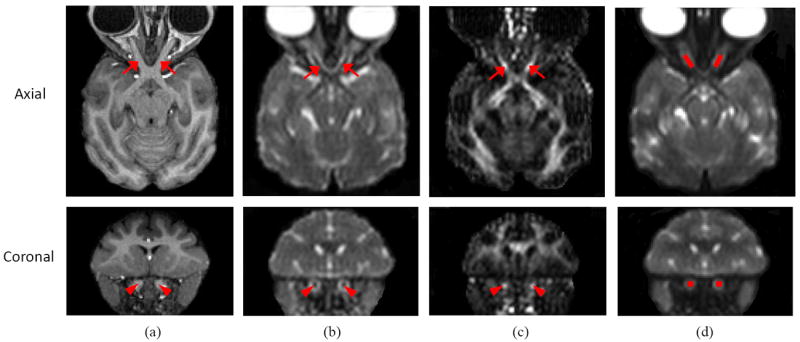
Structural anatomical images of the optic nerves and brain of a 6-year-old rhesus monkey. (a) T1-weighted images with 0.6 mm isotropic resolution. The optic nerves are marked with arrows on axial image and arrow heads on coronal image. (b) mean diffusivity (MD) map and (c) fractional anisotropy (FA) map (both in 0.65 mm isotropic resolution after interpolation). (d) Regions of interest (ROIs) overlaid on the B0 images. The ROIs were selected manually in the section between the anterior and posterior quarters of the optic nerve, only including the central pixel of the optic nerve cross-section on each selected coronal slice.
Numerical fitting of each DTI parameter was performed with the equation (Lebel et al., 2008):
where t is a time constant, indicating the time for a DTI parameter to reach 63.2% of its amplitude parameter A and representing the evolutionary rate of the DTI parameter during optic nerve maturation. C is the maximal or minimal allowed value - the asymptotic value of MD, FA, λ∥ or λ⊥ in adulthood (Lebel et al., 2008). In addition, the time to maturity is defined as the time to reach 90% of the amplitude A of a parameter, for comparison purpose. The curve fitting of each DTI parameter was carried out with OriginPro 8.5.0 SR1 (OriginLab Corporation, Northampton, MA, USA).
Paired T-tests were performed in each group to compare the FA and diffusivity parameters between the left and right optic nerves to assure the dependence. One-way ANOVA followed by Tukey’s post hoc test was carried out by using SPSS Statistics 17.0 (IBM Acquires SPSS Inc., Chicago, IL, USA).
Results
Paired T-test analysis showed that no significant difference in MD, FA, λ∥ or λ⊥ was seen between the left and right optic nerves in each age group (data not shown).
As illustrated in Fig 2, the progressive changes in MD, FA, λ∥, and λ⊥ were well fitted into an exponential pattern. The time constants (t) for MD, FA, λ∥, and λ⊥, derived from the exponential curve fitting of each parameter, were 16, 14, 18 and 15 months after birth, respectively. The corresponding times to maturation for MD, FA, λ∥, and λ⊥ were 36, 33, 42 and 34 months (or 3, 2.8, 3.5, 2.8 years), respectively. At about 6 years (72 months) of age, MD, FA, λ∥ and λ⊥ reached 0.65 × 10⁻³ mm2/s, 0.48, 1.07 × 10⁻³ mm2/s and 0.44 × 10⁻³ mm2/s, respectively.
Fig. 2.
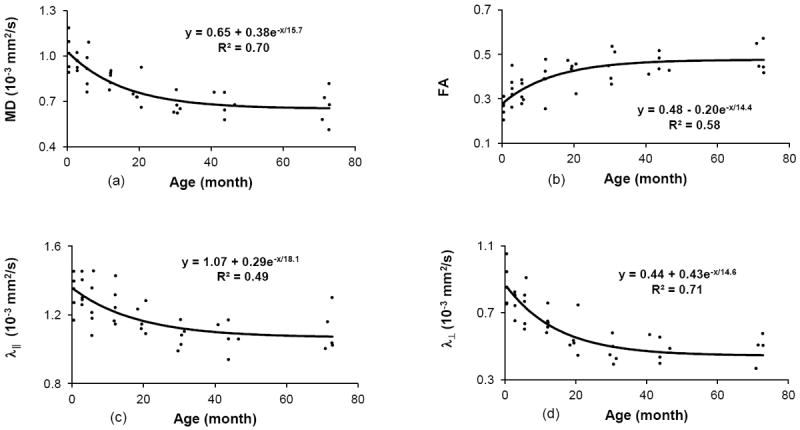
The changes of (a) MD, (b) FA, (c) λ∥ and (d) λ⊥ values of the rhesus monkey optic nerve with age were fitted into an exponential function (MD (or FA, λ∥, λ⊥) = C + Ae-age/t). The time constants (t) of MD, FA, λ∥ and λ⊥ were 16, 14, 18, 15 months, respectively, and the time to maturation of MD, FA, λ∥ and λ⊥ was 36, 33, 42 and 34 months, respectively. MD, FA, λ∥ and λ⊥ reached 0.65 × 10⁻³ mm2/s, 0.48, 1.07 × 10⁻³ mm2/s and 0.44 × 10⁻³ mm2/s, respectively, at their maximum development.
The statistical results of MD, FA, λ∥, and λ⊥ changes over time are presented in Fig. 3. Significant changes in MD and FA, compared with younger age groups, were observed at 20 months of age and older, meanwhile, significant changes in λ⊥ and λ∥ were observed at 12 and 30 months of age and older, respectively. The significant differences between any two age groups are marked on the elder group (Fig 3). FA increased by 87% from 2 weeks to 72 months, whereas MD, λ∥ and λ⊥ decreased by 35%, 17% and 49%, respectively.
Fig. 3.
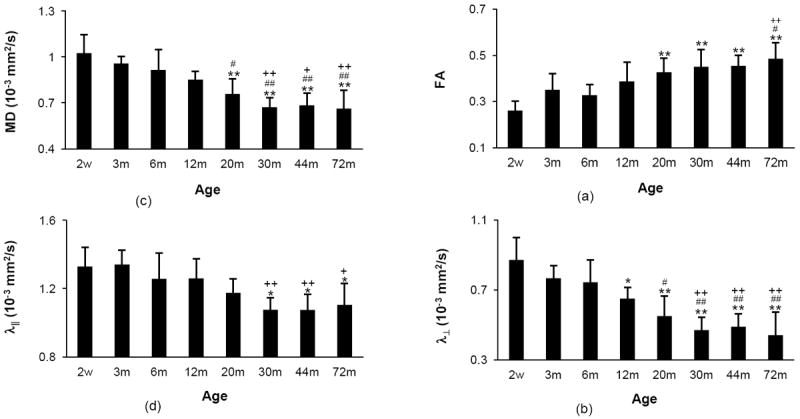
(a) MD, (b) FA, (c) λ∥ and (d) λ⊥ values of rhesus monkey optic nerves at different ages. All the significant differences between every 2 groups obtained from one-way ANOVA analysis was marked on the relatively elder age group. *, # and + are significant difference in comparison with groups at the ages of 2 weeks, 3 months and 6 months, respectively. No significant difference was found between any 2 groups at the ages of 12, 20, 30, 40 and 72 months. Single symbol: p < 0.05; double symbols: p < 0.01. Error bars represent standard deviation.
Also, three monkeys from each age group were used for the inter-rater reliability assessment (by YY and SP). The coefficients of reproducibility for MD, FA, λ∥ and λ⊥ were 5.6%, 9.9%, 2.4% and 9.5%, respectively. The Bland-Altman analysis shows that the inter-rater differences of the DTI measures are generally within mean bias ± 2× standard deviation (data not shown), demonstrating excellent inter-rater reliability.
Discussion
Development of optic nerve has been investigated systemically on specimens of fetuses and postnatally developing albino rats by light microscopy (Kuwabara, 1975). Also, similar ex vivo examination has been performed in human and monkey optic nerves (Dolman et al., 1980; Magoon and Robb, 1981; Morrison et al., 1990; Sandell and Peters, 2001). To our knowledge, comparable in vivo examination of optic nerve development in either humans or animals after birth has not been reported.
As shown in Fig 2, the progressive changes of FA and diffusivity parameters exhibited an exponential pattern during myelin maturation after birth, consistent with the findings in human brain white matter in early life (Hermoye et al., 2006; Lebel et al., 2008). The results indicate that the optic nerve myelination has the similar developing pattern as seen in most brain white matter structures including corpus callosum, internal capsule, fornix, etc.
The time constants of MD, FA, λ∥ and λ⊥, which represents the growth rate during the optic nerve development, are 16, 14, 18 and 15 months respectively (Table 2). Accordingly, the time to maturation is 36, 33, 42 and 34 months, respectively, indicating these DTI parameters reached 90% of their maximum development in 2.8 to 3.5 years of age in macaque monkeys. Also, MD changes slightly lagged behind FA, consistent with that seen in the development of most brain white matter (Lebel et al., 2008).
Table 2.
Correlation coefficients (R2), time constant t, the time to maturation (to reach 90% of the maximum development) T, absolute and relative changes of MD, FA, λ and λ⊥ in optic nerve of rhesus monkeys aged from 2 weeks to 72 months old.
| Parameters | R2 | t(m) | T (m) | absolute change | % change |
|---|---|---|---|---|---|
| MD | 0.70 | 15.7 | 36.0 | -0.36 × 10⁻³ mm2/s | -35 |
| FA | 0.58 | 14.4 | 33.2 | 0.23 | 87 |
| λ∥ | 0.49 | 18.1 | 41.7 | -0.22 × 10⁻³ mm2/s | -17 |
| λ⊥ | 0.71 | 14.6 | 33.7 | -0.43 × 10⁻³ mm2/s | -49 |
m: month
Generally, the aging in rhesus monkey proceeds about three times faster than in humans (Morrison et al., 1990; Tigges et al., 1988). Based upon this assumption, the time constant of the progression of MD and FA will be 3.9 and 3.6 human years. The converted time constant of FA in optic nerve is longer than those seen in some brain white matter structures (Lebel et al., 2008), including inferior longitudinal fasciculus, splenium of the corpus callosum, genu and superior fronto-occipital fasciculus, but shorter than that in other white matter structures. On the other hand, the time constant of MD in optic nerve is longer than that seen in inferior fronto-occipital fasciculus but shorter than those in other brain structures.
For comparison purpose, the linear fitting was conducted as well (figures not shown). The coefficient of determination (R2) of MD, FA, λ∥ and λ⊥ were 0.52, 0.45, 0.36 and 0.53, respectively, lower than those seen in the exponential fitting (in which R2 = 0.70, 0.58, 0.49 and 0.71, respectively). The result suggests that the progression of the FA and diffusivity parameters are well presented in the exponential pattern during the optic nerve maturation, in agreement with the prior findings of human brain white matter development (Lebel et al., 2008).
Also, as shown in Table 2 and Fig. 3, λ⊥, λ∥, and MD decreased 49%, 17%, 35% from 2 weeks to 6 years old, respectively. Meanwhile, FA increased as much as 87%. The results indicated that the FA increase was primarily due to the λ⊥ reduction, in agreement with the findings in the brain white matter of humans and animals, in which the λ⊥ decreases, accompanied by either a modest decrease or no change in λ∥ indicating the myelination may be the main cause of λ⊥ decrease (Lebel et al., 2008; Song et al., 2005). Prior studies have also shown that FA increase during the development period is primarily driven by decreasing λ⊥ (Giorgio et al., 2008; Snook et al., 2005). As λ⊥ represents the water diffusion perpendicular to axonal fiber tracts and indicates mainly myelin status, and λ∥ represents the water diffusion parallel to axonal fiber tracts and indicates primarily axonal status, the evident λ⊥ change indicates the predominant myelination of optic never from infant to adulthood. The finding has been generally seen in previous brain development studies (Giorgio et al., 2008; Lebel et al., 2008; Snook et al., 2005). In contrast, λ∥ has a modest decrease, indicating the mild change in axonal maturation after birth. Also, as seen in Fig 3 and indicated by the time constants, the time to maturation of λ⊥ is longer than that of λ∥, consistent with what seen in the developing brain(Gao et al., 2009).
One-way ANOVA analysis showed that the significant changes in MD and FA occurred at 20 months of age and older, and those of λ⊥ and λ∥ were at 12 and 30 months of age and older, respectively, suggesting that λ⊥, indicator of myelination progression, could be a more sensitive imaging marker than MD, FA and λ∥ in evaluating optic nerve development in newborn babies.
Furthermore, in the previous histology study of monkey optic nerve, the neural area appeared to increase between the ages of 2 years (n=1) and 7 years (n=1), and significantly lower axon density were observed in monkeys older than 2 years of age (Morrison et al., 1990). These changes in neural area and fiber density may result from the maturational changes of the optic nerve, as indicated by Morrison et al (Morrison et al., 1990).
This study demonstrates that DTI can be utilized to evaluate the progressive changes during optic nerve maturation after birth. Current high-field MRI scanners (3T or higher) and parallel imaging technique offer improved sensitivity on DTI measurement and become increasingly popular in clinic, greatly facilitating the examination of optic nerve in child patients. In addition, the monkey DTI measurement and analysis are translational and the data could be used as baseline reference in clinical study, as DTI investigation of optic nerve in children at very early age could be invasive because an invasive procedure, sedation, is required for children under 4 years old to reduce motion artifacts during scanning (Barb et al., 2011).
Conclusions
DTI was employed to evaluate the optic nerve development from birth to adulthood in normal rhesus monkeys. FA and diffusivity parameters exhibit the exponential trend during optic nerve maturation after birth, consistent with the findings in the white matter development of major human brain structures. The time constant of MD, FA, λ∥ and λ⊥ is 16, 14, 18 and 15 months after birth, respectively. Accordingly, the corresponding time to maturation of each parameter is 36, 33, 42 and 34 months (or 2.8-3.5 years), respectively. The results may be used as baseline reference in for examining optic nerve abnormalities or injury in children or preclinical studies.
DTI was used to evaluate the optic nerve maturation of non-human primates.
Progressive changes in DTI parameters follow an exponential pattern during maturation
Optic nerve maturation exhibits similar developing pattern seen in human brain
DTI might be a robust approach to examine optic nerve abnormalities in children
Acknowledgments
The authors are grateful to Wendy Williamson Coyne and Ruth Connelly for animal handling and Dr. Leonard Howell for helpful discussions. All animal protocols were approved by the Institutional Animal Care and Use Committee of Emory University. This work was supported by NIMH MH079100, MH078105, ARRA MH078105-S1, NICHD HD055255 and was funded by the National Center for Research Resources P51RR000165 and is currently supported by the Office of Research Infrastructure Programs / OD P51OD011132.
Footnotes
Financial Disclosures: The authors have no financial disclosures.
Publisher's Disclaimer: This is a PDF file of an unedited manuscript that has been accepted for publication. As a service to our customers we are providing this early version of the manuscript. The manuscript will undergo copyediting, typesetting, and review of the resulting proof before it is published in its final citable form. Please note that during the production process errors may be discovered which could affect the content, and all legal disclaimers that apply to the journal pertain.
References
- Alexander AL, Lee JE, Lazar M, Field AS. Diffusion tensor imaging of the brain. Neurotherapeutics. 2007;4:316–329. doi: 10.1016/j.nurt.2007.05.011. [DOI] [PMC free article] [PubMed] [Google Scholar]
- Barb SM, Rodriguez-Galindo C, Wilson MW, Phillips NS, Zou P, Scoggins MA, Li Y, Qaddoumi I, Helton KJ, Bikhazi G, Haik BG, Ogg RJ. Functional neuroimaging to characterize visual system development in children with retinoblastoma. Invest Ophthalmol Vis Sci. 2011;52:2619–2626. doi: 10.1167/iovs.10-5600. [DOI] [PMC free article] [PubMed] [Google Scholar]
- Beck AD. Diagnosis and management of pediatric glaucoma. Ophthalmol Clin North Am. 2001;14:501–512. doi: 10.1016/s0896-1549(05)70248-0. [DOI] [PubMed] [Google Scholar]
- Coimbra A, Ogidigben M, Peiffer R, O’Neil-Davis L, Holahan M, Cook J, Williams D. Using MRI to Quantify Optic Nerve Injury in Monkeys with Experimental Glaucoma: Atrophy and Diffusivity Effects. Proc Intl Soc Mag Reson Med. 2009;17:1074. [Google Scholar]
- Counsell SJ, Shen Y, Boardman JP, Larkman DJ, Kapellou O, Ward P, Allsop JM, Cowan FM, Hajnal JV, Edwards AD, Rutherford MA. Axial and radial diffusivity in preterm infants who have diffuse white matter changes on magnetic resonance imaging at term-equivalent age. Pediatrics. 2006;117:376–386. doi: 10.1542/peds.2005-0820. [DOI] [PubMed] [Google Scholar]
- deLuise VP, Anderson DR. Primary infantile glaucoma (congenital glaucoma) Surv Ophthalmol. 1983;28:1–19. doi: 10.1016/0039-6257(83)90174-1. [DOI] [PubMed] [Google Scholar]
- Dolman CL, McCormick AQ, Drance SM. Aging of the optic nerve. Arch Ophthalmol. 1980;98:2053–2058. doi: 10.1001/archopht.1980.01020040905024. [DOI] [PubMed] [Google Scholar]
- Filippi CG, Bos A, Nickerson JP, Salmela MB, Koski CJ, Cauley KA. Magnetic resonance diffusion tensor imaging (MRDTI) of the optic nerve and optic radiations at 3T in children with neurofibromatosis type I (NF-1) Pediatr Radiol. 2012;42:168–174. doi: 10.1007/s00247-011-2216-y. [DOI] [PubMed] [Google Scholar]
- Gao W, Lin W, Chen Y, Gerig G, Smith JK, Jewells V, Gilmore JH. Temporal and spatial development of axonal maturation and myelination of white matter in the developing brain. AJNR Am J Neuroradiol. 2009;30:290–296. doi: 10.3174/ajnr.A1363. [DOI] [PMC free article] [PubMed] [Google Scholar]
- Garcia-Filion P, Epport K, Nelson M, Azen C, Geffner ME, Fink C, Borchert M. Neuroradiographic, endocrinologic, and ophthalmic correlates of adverse developmental outcomes in children with optic nerve hypoplasia: a prospective study. Pediatrics. 2008;121:e653–659. doi: 10.1542/peds.2007-1825. [DOI] [PubMed] [Google Scholar]
- Giorgio A, Watkins KE, Douaud G, James AC, James S, De Stefano N, Matthews PM, Smith SM, Johansen-Berg H. Changes in white matter microstructure during adolescence. Neuroimage. 2008;39:52–61. doi: 10.1016/j.neuroimage.2007.07.043. [DOI] [PubMed] [Google Scholar]
- Hermoye L, Saint-Martin C, Cosnard G, Lee SK, Kim J, Nassogne MC, Menten R, Clapuyt P, Donohue PK, Hua K, Wakana S, Jiang H, van Zijl PC, Mori S. Pediatric diffusion tensor imaging: normal database and observation of the white matter maturation in early childhood. Neuroimage. 2006;29:493–504. doi: 10.1016/j.neuroimage.2005.08.017. [DOI] [PubMed] [Google Scholar]
- Ho CL, Walton DS. Primary congenital glaucoma: 2004 update. J Pediatr Ophthalmol Strabismus. 2004;41:271–288. doi: 10.3928/01913913-20040901-11. quiz 300-271. [DOI] [PubMed] [Google Scholar]
- Horsburgh GM, Sefton AJ. The early development of the optic nerve and chiasm in embryonic rat. J Comp Neurol. 1986;243:547–560. doi: 10.1002/cne.902430409. [DOI] [PubMed] [Google Scholar]
- Huppi PS, Dubois J. Diffusion tensor imaging of brain development. Semin Fetal Neonatal Med. 2006;11:489–497. doi: 10.1016/j.siny.2006.07.006. [DOI] [PubMed] [Google Scholar]
- Kolbe S, Chapman C, Nguyen T, Bajraszewski C, Johnston L, Kean M, Mitchell P, Paine M, Butzkueven H, Kilpatrick T, Egan G. Optic nerve diffusion changes and atrophy jointly predict visual dysfunction after optic neuritis. Neuroimage. 2009;45:679–686. doi: 10.1016/j.neuroimage.2008.12.047. [DOI] [PubMed] [Google Scholar]
- Kuwabara T. Development of the optic nerve of the rat. Invest Ophthalmol. 1975;14:732–745. [PubMed] [Google Scholar]
- Le Bihan D, Mangin JF, Poupon C, Clark CA, Pappata S, Molko N, Chabriat H. Diffusion tensor imaging: concepts and applications. J Magn Reson Imaging. 2001;13:534–546. doi: 10.1002/jmri.1076. [DOI] [PubMed] [Google Scholar]
- Lebel C, Walker L, Leemans A, Phillips L, Beaulieu C. Microstructural maturation of the human brain from childhood to adulthood. Neuroimage. 2008;40:1044–1055. doi: 10.1016/j.neuroimage.2007.12.053. [DOI] [PubMed] [Google Scholar]
- Levkovitch-Verbin H. Animal models of optic nerve diseases. Eye (Lond) 2004;18:1066–1074. doi: 10.1038/sj.eye.6701576. [DOI] [PubMed] [Google Scholar]
- Magoon EH, Robb RM. Development of myelin in human optic nerve and tract. A light and electron microscopic study. Arch Ophthalmol. 1981;99:655–659. doi: 10.1001/archopht.1981.03930010655011. [DOI] [PubMed] [Google Scholar]
- Morrison JC, Cork LC, Dunkelberger GR, Brown A, Quigley HA. Aging changes of the rhesus monkey optic nerve. Invest Ophthalmol Vis Sci. 1990;31:1623–1627. [PubMed] [Google Scholar]
- Naismith RT, Xu J, Tutlam NT, Trinkaus K, Cross AH, Song SK. Radial diffusivity in remote optic neuritis discriminates visual outcomes. Neurology. 2010;74:1702–1710. doi: 10.1212/WNL.0b013e3181e0434d. [DOI] [PMC free article] [PubMed] [Google Scholar]
- Nickerson JP, Salmela MB, Koski CJ, Andrews T, Filippi CG. Diffusion tensor imaging of the pediatric optic nerve: intrinsic and extrinsic pathology compared to normal controls. J Magn Reson Imaging. 2010;32:76–81. doi: 10.1002/jmri.22228. [DOI] [PubMed] [Google Scholar]
- Pavuluri MN, Yang S, Kamineni K, Passarotti AM, Srinivasan G, Harral EM, Sweeney JA, Zhou XJ. Diffusion tensor imaging study of white matter fiber tracts in pediatric bipolar disorder and attention-deficit/hyperactivity disorder. Biol Psychiatry. 2009;65:586–593. doi: 10.1016/j.biopsych.2008.10.015. [DOI] [PMC free article] [PubMed] [Google Scholar]
- Salmela MB, Cauley KA, Nickerson JP, Koski CJ, Filippi CG. Magnetic resonance diffusion tensor imaging (MRDTI) and tractography in children with septo-optic dysplasia. Pediatr Radiol. 2010;40:708–713. doi: 10.1007/s00247-009-1478-0. [DOI] [PubMed] [Google Scholar]
- Sandell JH, Peters A. Effects of age on nerve fibers in the rhesus monkey optic nerve. J Comp Neurol. 2001;429:541–553. doi: 10.1002/1096-9861(20010122)429:4<541::aid-cne3>3.0.co;2-5. [DOI] [PubMed] [Google Scholar]
- Sandell JH, Peters A. Effects of age on the glial cells in the rhesus monkey optic nerve. J Comp Neurol. 2002;445:13–28. doi: 10.1002/cne.10162. [DOI] [PubMed] [Google Scholar]
- Snook L, Paulson LA, Roy D, Phillips L, Beaulieu C. Diffusion tensor imaging of neurodevelopment in children and young adults. Neuroimage. 2005;26:1164–1173. doi: 10.1016/j.neuroimage.2005.03.016. [DOI] [PubMed] [Google Scholar]
- Song SK, Sun SW, Ju WK, Lin SJ, Cross AH, Neufeld AH. Diffusion tensor imaging detects and differentiates axon and myelin degeneration in mouse optic nerve after retinal ischemia. Neuroimage. 2003;20:1714–1722. doi: 10.1016/j.neuroimage.2003.07.005. [DOI] [PubMed] [Google Scholar]
- Song SK, Yoshino J, Le TQ, Lin SJ, Sun SW, Cross AH, Armstrong RC. Demyelination increases radial diffusivity in corpus callosum of mouse brain. Neuroimage. 2005;26:132–140. doi: 10.1016/j.neuroimage.2005.01.028. [DOI] [PubMed] [Google Scholar]
- Sun SW, Liang HF, Le TQ, Armstrong RC, Cross AH, Song SK. Differential sensitivity of in vivo and ex vivo diffusion tensor imaging to evolving optic nerve injury in mice with retinal ischemia. Neuroimage. 2006;32:1195–1204. doi: 10.1016/j.neuroimage.2006.04.212. [DOI] [PubMed] [Google Scholar]
- Thomason ME, Thompson PM. Diffusion imaging, white matter, and psychopathology. Annu Rev Clin Psychol. 2011;7:63–85. doi: 10.1146/annurev-clinpsy-032210-104507. [DOI] [PubMed] [Google Scholar]
- Tigges J, Gordon TP, McClure HM, Hall EC, Peters A. Survival rate and life span of rhesus monkeys at the Yerkes Regional Primate Research Center. American Journal of Primatology. 1988;15:263–273. doi: 10.1002/ajp.1350150308. [DOI] [PubMed] [Google Scholar]
- Trip SA, Wheeler-Kingshott C, Jones SJ, Li WY, Barker GJ, Thompson AJ, Plant GT, Miller DH. Optic nerve diffusion tensor imaging in optic neuritis. Neuroimage. 2006;30:498–505. doi: 10.1016/j.neuroimage.2005.09.024. [DOI] [PubMed] [Google Scholar]
- Wheeler-Kingshott CA, Trip SA, Symms MR, Parker GJ, Barker GJ, Miller DH. In vivo diffusion tensor imaging of the human optic nerve: pilot study in normal controls. Magn Reson Med. 2006;56:446–451. doi: 10.1002/mrm.20964. [DOI] [PubMed] [Google Scholar]
- Xu J, Sun SW, Naismith RT, Snyder AZ, Cross AH, Song SK. Assessing optic nerve pathology with diffusion MRI: from mouse to human. NMR Biomed. 2008;21:928–940. doi: 10.1002/nbm.1307. [DOI] [PMC free article] [PubMed] [Google Scholar]
- Yang H, Downs JC, Burgoyne CF. Physiologic intereye differences in monkey optic nerve head architecture and their relation to changes in early experimental glaucoma. Invest Ophthalmol Vis Sci. 2009;50:224–234. doi: 10.1167/iovs.08-2464. [DOI] [PMC free article] [PubMed] [Google Scholar]
- Zhou XJ. Diffusion tensor imaging: techniques and clinical applications. Conf Proc IEEE Eng Med Biol Soc. 2004;7:5223–5225. doi: 10.1109/IEMBS.2004.1404460. [DOI] [PubMed] [Google Scholar]