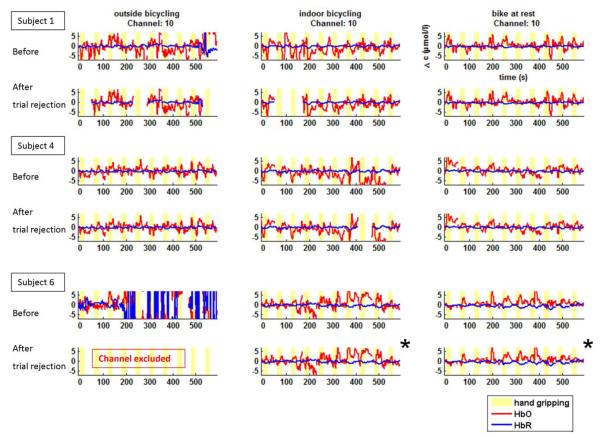
Fig. 3.
Continuous time courses of relative HbO2 and HbR changes before and after artifact rejection while outdoor bicycling (left), stationary bicycling (middle), and sitting still (right) for three representative subjects. Each trial is baseline corrected to (−10 – 0) s before each hand gripping onset (yellow bars: 20-s hand gripping activation periods). Trials and channels exceeding our noise limits were removed from the data time series and excluded from further analysis. For a valid statistical comparison across the three conditions, we considered only those channels which met the defined quality criteria in all three conditions within a subject. As a result, data denoted by (*) were also excluded from the further analysis. Oscillations of physiological origin are generally more pronounced in the ΔHbO2 data compared to the ΔHbR Signals. Nevertheless, the prototypical neuro-activation response is seen in many instances, even without event-related averaging.

