

Summary
Despite evidence for the impact of insulin on intestinal epithelial physiology and pathophysiology, the expression patterns, roles, and regulation of insulin receptor (IR) and IR isoforms in the intestinal epithelium are not well characterized. IR-A is thought to mediate the proliferative effects of insulin or insulin growth factors (IGFs) in fetal or cancer cells. IR-B is considered to be the metabolic receptor for insulin in specialized tissues. This study used a novel Sox9-EGFP reporter mouse that permits isolation of intestinal epithelial stem cells (IESCs), progenitors, enteroendocrine cells and differentiated lineages, the ApcMin/+ mouse model of precancerous adenoma and normal human intestinal and colorectal cancer (CRC) cell lines. We tested the hypothesis that there is differential expression of IR-A or IR-B in stem and tumor cells versus differentiated intestinal epithelial cells (IECs) and that IR-B impacts cell proliferation. Our findings provide evidence that IR-B expression is significantly lower in highly proliferative IESCs and progenitor cells versus post-mitotic, differentiated IECs and in subconfluent and undifferentiated versus differentiated Caco-2 cells. IR-B is also reduced in ApcMin/+ tumors and highly tumorigenic CRC cells. These differences in IR-B were accompanied by altered levels of mRNAs encoding muscleblind-like 2 (MBNL2), a known regulator of IR alternative splicing. Forced IR-B expression in subconfluent and undifferentiated Caco-2 cells reduced proliferation and increased biomarkers of differentiation. Our findings indicate that the impact of insulin on different cell types in the intestinal epithelium might differ depending on relative IR-B∶ IR-A expression levels and provide new evidence for the roles of IR-B to limit proliferation of CRC cells.
Key words: Colon cancer, Differentiation, Insulin receptor isoform B, Intestinal stem cell, Proliferation
Introduction
Insulin acts through the insulin receptor (IR) to regulate nutrient uptake and storage in its major ‘metabolic’ target tissues: liver, muscle and adipose tissue. IR exists as two structurally distinct isoforms, IR-A and IR-B. These isoforms differ by the exclusion (IR-A) or inclusion (IR-B) of exon 11, which encodes a 12 amino acid region located in the C-terminus of the ligand-binding α-subunit of the IR (Belfiore et al., 2009). Previous work suggests that exon 11 splicing is regulated by RNA binding proteins. The muscleblind-like (MBNL) proteins and serine arginine rich splicing factor 3 (SRSF3) are splicing enhancers that promote exon 11 inclusion and favor IR-B expression. The CUG-triplet repeat RNA binding protein 1 (CUGBP1) is a splicing silencer that facilitates exon 11 exclusion, favoring IR-A expression (Sen et al., 2010; Sen et al., 2009). Downregulation or inactivation of MBNL1 and upregulation of CUGBP1 is associated with reduced IR-B levels and insulin resistance of skeletal muscle in patients with myotonic dystrophy (Cruz Guzmán et al., 2012; Dansithong et al., 2005; Paul et al., 2006), demonstrating a crucial role for these RNA-binding proteins in both IR-B expression and insulin sensitivity.
IR-B has high affinity for insulin and much lower affinity for the structurally related ligands, insulin-like growth factors 1 and 2 (IGF1 and IGF2). IR-A binds insulin and IGF2 with high affinity, whereas it binds IGF1 with an ∼tenfold lower affinity (Belfiore et al., 2009; Frasca et al., 1999). Previous studies demonstrated that IR-B is highly expressed and predominates over IR-A in specialized adult tissues, such as liver, skeletal muscle, adipose tissue, pancreas and kidney, where it mediates metabolic effects of insulin on nutrient uptake, handling or storage (Lin et al., 2013; Moller et al., 1989; Mosthaf et al., 1990). IR-A is thought to play a role in fetal growth because it is highly expressed during embryogenesis and can mediate the growth-promoting effects of IGF2 (Belfiore et al., 2009). Upregulation of IR-A has been reported in breast, ovarian, colon and thyroid cancer cell lines and/or human tumors (Belfiore et al., 2009; Frasca et al., 1999; Jones et al., 2006; Kalla Singh et al., 2011; Kalli et al., 2002; Sciacca et al., 1999; Vella et al., 2002). Because IR-A can bind both insulin and the IGFs, which are typically linked to cell proliferation and survival, these findings support current views that IR-A may mediate cancer cell proliferation or survival in response to insulin or the IGFs (Belfiore et al., 2009; Belfiore and Malaguarnera, 2011; Cohen and LeRoith, 2012; Frasca et al., 1999; Jones et al., 2006; Kalla Singh et al., 2011; Kalli et al., 2002; Sciacca et al., 1999; Vella et al., 2002). Increasing attention is being focused on IR-A as a potential mediator of anti-IGF1R therapy evasion in cancer cells (Buck et al., 2010; Ulanet et al., 2010). Less is known about expression profiles and physiological roles of IR-B versus IR-A in normal, highly proliferative adult tissues, such as the intestinal epithelium.
The intestinal epithelium is not traditionally considered to be a major target of the metabolic actions of insulin, although it is the first organ exposed to digested nutrients. A need for a better understanding of the role of insulin and IRs in the intestinal epithelium is highlighted by recent studies linking obesity, hyperinsulinemia and insulin resistance, or insulin therapies used in diabetes mellitus, to risk of gastrointestinal cancers (Gough et al., 2011; Kant and Hull, 2011; Keku et al., 2005; Wong et al., 2012; Yuhara et al., 2011). Epidemiological studies have linked elevated plasma insulin and reduced spontaneous apoptosis in normal colonic epithelium to risk of precancerous colorectal adenomas (Keku et al., 2005). A small but mounting body of evidence suggests that obesity and type-2 diabetes are associated with insulin resistance at the level of the enterocyte, which might promote aberrant lipid handling and exacerbate dyslipidemia, (Federico et al., 2006; Haidari et al., 2002; Hayashi et al., 2011). Despite this evidence for potential roles of insulin in aberrant cell growth, survival or dysfunction of differentiated enterocytes, little is known about the expression or specific functions of the IR, and particularly IR-A and IR-B isoforms in the intestinal epithelium.
The small intestinal epithelium is the most proliferative tissue in the body, with constant renewal of the epithelium every three to ten days, depending on the species, region and cell type (Cheng and Leblond, 1974; Williamson, 1982). Renewal depends on proliferating, intestinal epithelial stem cells (IESCs) at the base of the crypt (Barker et al., 2008; Garrison et al., 2009; Zeki et al., 2011). These IESCs divide to self-renew and generate more rapidly proliferating, transit-amplifying progenitor cells that undergo cell cycle arrest and differentiate as they migrate along the crypt axis (Barker et al., 2008; Simons and Clevers, 2011; van der Flier and Clevers, 2009). The differentiated intestinal epithelial cells (IECs) include secretory enteroendocrine, goblet cells or Paneth cells (small intestine), and absorptive enterocytes. In the small intestine, enterocytes represent the majority of terminally differentiated cells, which are marked by expression of sucrase isomaltase (SI).
In this study, we tested the hypothesis that IR-A and IR-B show distinct expression patterns in small IESCs, progenitors and differentiated lineages, and that elevated relative levels of IR-B versus IR-A limit proliferation or enhance differentiation biomarker expression. Our studies used a novel Sox9-EGFP BAC transgenic reporter mouse that allows isolation and analyses of IESCs, progenitors and differentiated IECs based on distinct levels of Sox9-EGFP (Formeister et al., 2009; Gracz et al., 2010; Van Landeghem et al., 2012). Sox9-EGFPLow cells are highly enriched for Lgr5 and other biomarkers of what have been termed ‘actively cycling crypt base columnar IESCs’ and exhibit functional properties of IESCs, including survival in Matrigel culture systems and multipotency for all IEC lineages (Muñoz et al., 2012; Van Landeghem et al., 2012). Sox9-EGFPSublow cells lie in the region of highly proliferative, transit-amplifying progenitor cells and are enriched for genes associated with active proliferation. Sox9-EGFPHigh cells are dramatically enriched for enteroendocrine cell (EEC) biomarkers, but also enriched for reported biomarkers of a quiescent IESC population (Gracz et al., 2010; Van Landeghem et al., 2012). Sox9-EGFPNegative cells on the villi are enriched for markers of post-mitotic, differentiated cells, including biomarkers of enterocytes, goblet and Paneth cells (Van Landeghem et al., 2012). The ability to FACS isolate these distinct cell populations that have been validated by functional studies and gene-expression profiling, provides a useful system to analyze Ir isoform expression in different IEC subtypes. The ApcMin/+ model of precancerous intestinal adenomas was used to examine the association between relative expression of IR-A and IR-B isoforms, and the levels of mRNAs encoding regulators of Ir isoform splicing, during early tumorigenesis. Non-transformed IECs and colorectal cancer (CRC) cell lines were used to examine the association between relative IR-B and IR-A expression levels, isoform splicing regulators, and proliferation or expression of differentiation biomarkers. A stable CRC cell line with enhanced IR-B expression was generated to directly test the functional impact of IR-B on proliferation and differentiation biomarkers. Although a large majority of studies in other organs have emphasized functional consequences of IR-A overexpression in promoting proliferation and survival (Frasca et al., 1999; Harrington et al., 2012; Heidegger et al., 2012; Malaguarnera et al., 2011; Sciacca et al., 2002), we, for the first time, report the impact of enhanced IR-B expression on CRC cells. Our studies provide novel evidence for gradients of IR-A and IR-B expression in normal, highly proliferative IESCs versus post-mitotic, differentiated lineages, tumor versus normal tissue and functional effects of IR-B to limit CRC cell proliferation. These findings indicate that relative levels of IR-B and IR-A in distinct cell populations within a heterogeneous tissue, such as the intestinal epithelium, will dictate cell-specific outcomes of insulin signaling.
Results
Insulin receptor isoform expression exists in a gradient from proliferative stem and progenitor cells (IR-A predominant) to post-mitotic, differentiated lineages (IR-B predominant)
Single-cell suspensions were prepared from the jejunal epithelium of Sox9-EGFP reporter mice (Formeister et al., 2009; Gracz et al., 2010; Van Landeghem et al., 2012) and the four IEC populations were isolated by FACS based on distinct expression levels of Sox9-EGFP (Fig. 1A). These correspond to Sox9-EGFPLow cells with a validated IESC phenotype, Sox9-EGFPSublow progenitors, Sox9-EGFPHigh cells enriched for EEC, but also containing cells with a facultative/quiescent stem cell phenotype and Sox9-EGFPNegative cells enriched for biomarkers of terminally differentiated enterocytes, goblet and Paneth cells (Formeister et al., 2009; Gracz et al., 2010; Van Landeghem et al., 2012). Evaluation of total Ir mRNA by qRT-PCR revealed approximately equal levels of total Ir expression in each cell population with a modest, but significant enrichment of Ir mRNA in Sox9-EGFPHigh cells versus other cell populations (Fig. 1B). RT-PCR with primers spanning exon 11 was performed and yielded two products corresponding in size to IR-A (210 bp) and IR-B (246 bp) isoforms, which were verified by DNA sequencing. As illustrated in Fig. 1C, there were clear differences in Ir isoform expression across the Sox9-EGFP populations, with IR-B predominating in Sox9-EGFPNegative differentiated IEC (a greater than twofold increase in IR-B∶ IR-A ratio versus Sox9-EGFPLow IESC and Sox9-EGFPSublow progenitors) and IR-A predominating in Sox9-EGFPLow active IESCs and Sox9-EGFPSublow progenitors. Interestingly, Sox9-EGFPHigh cells, which encompass EEC and facultative and quiescent IESCs, expressed about equal amounts of the two isoforms. Because IR-B is linked to metabolic or differentiated function in other organs and IR-A mediates proliferative responses to insulin or IGF2, these differences between Ir isoform expression in stem or progenitor cells versus post-mitotic differentiated lineages, provide evidence that the outcome of insulin signaling might differ in highly proliferative IESCs or progenitors versus post-mitotic differentiated IECs.
Fig. 1.
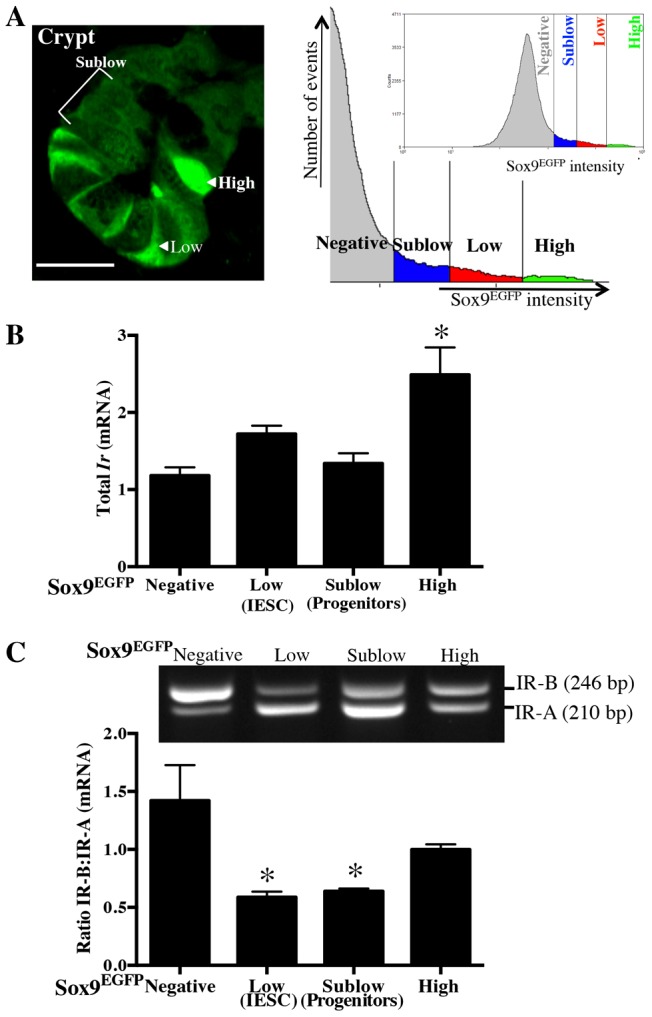
Insulin receptor isoform expression in intestinal epithelial cells exhibits a gradient from proliferative stem cells (IR-A predominant) to post-mitotic differentiated lineages (IR-B predominant). (A) Immunofluorescence image of jejunal crypt and FACS histogram with representative gates generated from Sox9-EGFP reporter mouse illustrating distinct Sox9-EGFP expression levels in intestinal epithelium. Prior studies (Van Landeghem et al., 2012) validated the Sox9-EGFPLow as IESCs, Sox9-EGFPSublow as progenitors, Sox9-EGFPHigh as EECs, and Sox9-EGFPNegative as enterocytes and other differentiated lineages. Labels indicate representative cells. Scale bar: 20 µm. (B) Levels of total Ir mRNA assayed by qRT-PCR on different Sox9-EGFP populations isolated from jejunum by FACS as previously reported (Van Landeghem et al., 2012). n≧3 animals. (C) Representative gel from RT-PCR assesses the ratio of IR-B∶ IR-A mRNAs (top) using primers spanning exon 11 of the Ir (present only in IR-B) and quantitative data across independent animals (n = 6). Data in B and C represent mean ± s.e.m. *P<0.05 compared with Sox9-EGFPNegative cells; ANOVA, Sidak's Test.
Decreased total Ir expression in tumors from ApcMin/+ mice is associated with reduced IR-B expression and predominance of IR-A
Total Ir levels and relative IR-B∶ IR-A mRNA expression were compared in small intestine and colonic tumors dissected from ApcMin/+ mice and size-matched mucosal punch biopsies of normal small intestine and colon tissue from wild-type mice. Total Ir mRNA levels were significantly lower in jejunal and colon tumors of ApcMin/+ mice relative to normal tissue (Fig. 2A).
Fig. 2.

Decreased total Ir expression in tumors from ApcMin/+ mice is associated with reduced IR-B expression and altered levels of other insulin–IGF axis mRNAs. qRT-PCR measured (A) total Ir, (C) Igf1, (D) Igf1r, (E) Irs2 and (F) Irs1 mRNA in small intestine and colonic tumors from ApcMin/+ mice compared with normal small intestine and colon tissue from wild-type animals (WT). (B) RT-PCR was carried out to measure the ratio of IR-B∶IR-A mRNA expression using primers spanning exon 11 of the Ir in small intestine and colon tumor tissue compared with normal tissue. All qRT-PCR data are normalized to ribosomal protein S6, invariant control. Data represent mean ± s.e.m. (n≧5); *P≤0.05 in ApcMin/+ tumor versus WT normal tissue; unpaired t-test.
As shown in Fig. 2B, the Ir isoform profile differed in tumor versus normal tissue such that IR-B predominates in normal tissue and IR-A predominates in tumors. Quantitative densitometry confirmed a significant decrease in the IR-B∶ IR-A ratio in ApcMin/+ tumors from small intestine or colon compared with normal tissue. Thus, even though total Ir mRNA is decreased in ApcMin/+ tumors, IR-A expression is preserved or enhanced whereas IR-B expression is reduced. Because IR-A is known to mediate proliferation in response to insulin or IGF2 (Frasca et al., 1999), this switching to a predominance of IR-A in ApcMin/+ tumors might favor proliferative responses to insulin or IGFs.
Evaluation of other components of the insulin–IGF axis in ApcMin/+ tumors versus normal intestine or colon revealed that the predominance of IR-A in tumors is accompanied by significant upregulation of Igf1 mRNA, downregulation of Igf1r and Irs2 mRNAs, but maintained Irs1 mRNA levels (Fig. 2C–F). These findings, together with our data showing loss of IR-B in ApcMin/+ tumors, led us to consider whether IR-B is downregulated in human CRC cells, if IR-B can limit proliferation, or if IR-B is associated with altered expression of differentiation biomarkers.
IR-B expression is enhanced in cell lines with normal IEC phenotype or ability to differentiate vs tumorigenic CRC cell lines
IR isoform expression was examined in a panel of human cell lines with differing capacity for tumorigenicity or differentiation. A non-transformed human intestinal epithelial cell line (HIECs), derived from fetal small intestine (Perreault and Beaulieu, 1996) and Caco-2 cells, a CRC cell line capable of spontaneous differentiation to an enterocyte phenotype, exhibited expression of IR-B and IR-A at approximately equal levels. By contrast, HT-29, HCT116 and SW480 CRC cell lines, which have high tumorigenicity in xenograft models and limited capacity for differentiation, showed significantly lower IR-B∶ IR-A mRNA levels, such that IR-A was the predominant isoform and IR-B was barely detectable (Fig. 3).
Fig. 3.
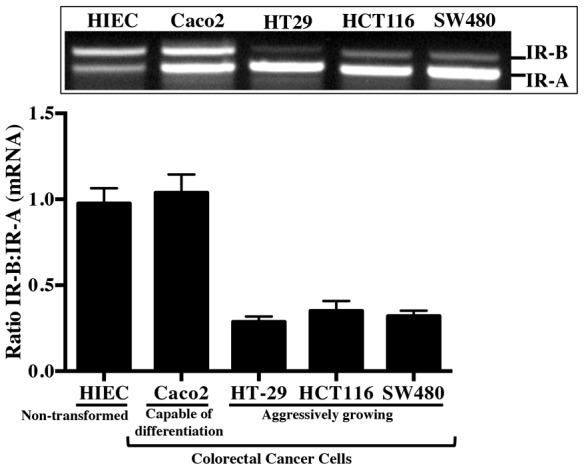
IR-B expression is enhanced in a non-transformed human intestinal epithelial cell line (HIECs) and Caco-2 cells with the capacity to spontaneously differentiate versus tumorigenic colorectal cancer (CRC) cell lines. RT-PCR using primers spanning exon 11 evaluated ratio of IR-B∶IR-A mRNA expression in subconfluent, actively dividing non-transformed HIEC, Caco-2 CRC cells capable of spontaneous differentiation, and HT-29, HCT116, and SW480 CRC lines. Note the low expression of IR-B in HT-29, HCT116, and SW480 in representative blot and after quantification of band intensity. Histogram represents mean ± s.e.m. (n≧2).
Post-confluent differentiation of Caco-2 cells is associated with increased IR-B expression and enhanced IR signaling
Caco-2 cells were grown on Transwell filters and studied either at 2 days when they were subconfluent, highly proliferative and undifferentiated or at 21 days post confluence, a time when proliferation is reduced and cells differentiate (Chantret et al., 1988; Miller et al., 2004; Pinto et al., 1983), as verified here by enhanced expression of the differentiation marker and brush border enzyme SI (21-fold increase in SI mRNA and 180-fold increase in SI protein) (Fig. 4A). Post-confluent, differentiated Caco-2 cells showed dramatic increases in total IR at the protein and mRNA levels (Fig. 4B). This was associated with an IR isoform switch to predominantly IR-B at the mRNA and protein levels (Fig. 4C) and enhanced, insulin-stimulated phosphorylation of IR-B and AKT (Fig. 4D,E).
Fig. 4.

Spontaneous, post-confluent differentiation is associated with increased IR-B mRNA and protein expression, and signaling. Caco-2 cells were grown on Transwell filters or plastic for 2 days (subconfluent) or Transwell filters for 21 days post confluence (differentiated). qRT-PCR and western blot to measure (A) differentiation biomarker and brush border enzyme sucrase isomaltase (SI) mRNA and protein, (B) total insulin receptor (IR) mRNA and protein. (C) RT-PCR evaluated the ratio of IR-B∶IR-A mRNA and IR-B protein levels were measured by western blot. All qRT-PCR data were normalized to invariant control, ribosomal phosphoprotein P0. Data represent mean ± s.e.m. (n = 5). Immunoprecipitation and western blot to measure tyrosine phosphorylation of (D) IR-B and (E) downstream mediator AKT in serum-deprived cells at 5 minutes after treatment with insulin (Ins; 200 ng/ml) or serum-free medium (SFM) alone. Data represent mean ± s.e.m. (n = 2 in duplicate). All western blots use β-actin as the loading control. β-actin image shown corresponds to p-AKT blot. Loading was identical for total AKT. *P<0.05 differentiated versus undifferentiated Caco-2 cells, unpaired t-test.
IR isoform switching in post-confluent differentiated Caco-2 cells and in ApcMin/+ tumors is associated with altered expression of IR splicing enhancers and silencer
Levels of mRNAs encoding the pre-mRNA splicing regulators MBNL2, SRSF3 and CUGBP1 were examined in subconfluent, undifferentiated and post-confluent, differentiated Caco-2 cells or in ApcMin/+ tumors versus normal tissue. In skeletal muscle or in vitro settings, MBNL2 and SRSF3 have previously been shown to enhance the inclusion of exon 11 and generation of IR-B mRNA, whereas CUGBP1 silences exon 11 splicing to favor IR-A mRNA expression (Fig. 5A) (Cruz Guzmán et al., 2012; Dansithong et al., 2005; Paul et al., 2006; Sen et al., 2010; Sen et al., 2009). Consistent with the increased IR-B∶IR-A ratio in post-confluent differentiated Caco-2 cells (Fig. 4C), these cells exhibited increased MBNL2 mRNA, decreased CUGBP1 mRNA and resultant increases in the MBNL2∶CUGBP1 mRNA ratio (Fig. 5B). Conversely, jejunal and colon tumors from ApcMin/+ mice showed significant reductions in Mbnl2 mRNA with a significantly decreased Mbnl2∶Cugbp1 ratio in the colon tumor tissue (Fig. 5C,D). Srsf3 was also significantly downregulated in jejunal tumors versus wild-type (WT) tissue (tumor, 1.10±0.12 versus WT, 1.89±0.3; mean ± s.e.m.; P<0.05), but not in colon tumors. Thus, altered relative expression of IR-B∶IR-A in post-confluent Caco-2 cells or in tumors is associated with altered expression of IR splicing enhancers or silencer.
Fig. 5.

IR isoform switching in post-confluent, differentiated Caco-2 cells and ApcMin/+ tumors is associated with altered expression of mRNAs encoding IR splicing enhancers and silencer. (A) Schematic summarizing prior in vitro work indicating RNA binding proteins that regulate IR isoform splicing from IR pre-mRNA. Splicing enhancers MBNL1, MBNL2 and SRSF3 promote exon 11 inclusion, favoring IR-B expression and silencer CUGBP1 promotes exon 11 exclusion, favoring IR-A (Sen et al., 2010; Sen et al., 2009). (B) qRT-PCR data showing levels of CUGBP1, MBNL2 and the ratio of MBNL2∶CUGBP1 expression in Caco-2 cells grown on Transwell plates for 2 days (undifferentiated/subconfluent) or 21 days post-confluence (differentiated). Data represent mean ± s.e.m. (n = 5); *P<0.05 versus subconfluent Caco-2 cells, paired t-test. (C, D) qRT-PCR measured Cugbp1, Mbnl2 and the ratios of Mbnl2∶Cugbp1 mRNA levels in small intestine (C) and/or colon (D) tumors from ApcMin/+ mice versus mucosal punch biopsies from normal small intestine and colon of wild-type (WT) mice. Data represent mean ± s.e.m. (n≧5); *P≤0.05 ApcMin/+ tumor versus WT tissue, unpaired t-test.
Stable overexpression of IR-B enhances IR signaling
Because our data indicated a possible correlation between elevated IR-B or IR-B∶IR-A ratio and reduced proliferation or differentiation of CRC cells, we used lentiviral particles (Fig. 6A) to generate subconfluent Caco-2 cells stably expressing high levels of IR-B mRNA and protein (IR-B-Caco-2; Fig. 6B). Enhanced IR-B levels in subconfluent IR-B-Caco-2 cells approximated, but did not achieve the elevated levels of IR-B found in post-confluent spontaneously differentiated Caco-2 cells (Fig. 6C). Compared with the vector control, subconfluent IR-B-Caco-2 cells exhibited increases in total and tyrosine-phosphorylated IR-B, as well as significantly increased, insulin-induced phosphorylation of AKT, demonstrating that overexpressed IR-B is functional (Fig. 6D,E).
Fig. 6.

Stable overexpression of IR-B in subconfluent Caco-2 cells attenuates cell proliferation. (A) Lentiviral constructs were used to generate Caco-2 and SW480 cells with stable, predominance of IR-B expression (IR-B) or empty vector control (V). The remaining viral components of the vector were the long terminal repeats (LTR), virus packaging signal (Ψ) and the polypurine tract (cPPT). Expression of viral vector components was mediated by the 5′ CMV promoter and polyadenylation signal. The expression cassette contained a CMV promoter, human insulin receptor isoform B (IR-B) gene (in IR-B only), and internal ribosomal entry site (IRES) mediating expression of green fluorescent protein fused to a blasticidin-resistance gene (GFP-BSDR) and Woodchuck hepatitis virus post-transcriptional regulatory element (WPRE). The U3-deleted self-inactivating sequence (ΔU3) was in the 3′LTR. Vector backbone was previously described (Titus et al., 2012). (B) RT-PCR with primers spanning exon 11 confirms stable, predominant IR-B expression at the mRNA level. Western blot for total IR and IR-B in subconfluent vector and IR-B cells confirm enhanced IR-B protein levels. Similar β-actin levels confirm equal loading. (C) Western blot confirms lentivirus-induced IR-B expression levels in subconfluent IR-B-Caco-2 cells approximate, but do not exceed, endogenous increases in total IR or IR-B that occur following differentiation. Samples were all run on the same gel and normalized to β-actin. (D) Immunoprecipitation and western blot to assess tyrosine phosphorylation of IR-B in serum-deprived, subconfluent Vector-Caco-2 and IR-B-Caco-2 cells following treatment for 5 minutes with 200 ng/ml insulin or serum-free medium (SFM) alone. Data represent images of two independent blots. (E) Western blot to assess phosphorylation of AKT following a 5-minute treatment with 200 ng/ml insulin or SFM alone in Vector-Caco-2 and IR-B-Caco-2 cells. β-actin confirmed equal loading and image shown corresponds to p-AKT blot. Loading was identical for total AKT. Samples were run in triplicate. (F) [3H]thymidine incorporation measured DNA synthesis at 72 hours post plating in Vector or IR-B (Caco-2 or SW480) cells. Date represent mean ± s.e.m. of two independent experiments with six replicates each. *P≤0.05 versus Vector, paired t-test. (G) Cell number was assessed at 72 hours post-plating in Vector versus IR-B-Caco-2 cells. Data represent mean ± s.e.m. for two independent experiments performed in triplicate. *P≤0.05 versus Vector-Caco-2, unpaired t-test. (H) Western blotting with whole cell and nuclear extracts measured total and nuclear β-catenin levels in subconfluent Vector and IR-B-Caco-2 cells. Data represent at least two independent experiments performed in duplicate; *P≤0.05 versus Vector-Caco-2, unpaired t-test.
IR-B reduces CRC cell proliferation, DNA synthesis and nuclear β-catenin
Elevated IR-B expression significantly reduced [3H]thymidine incorporation and cell number, as well as whole cell and nuclear β-catenin protein levels in subconfluent IR-B-Caco-2 cells compared with empty vector controls (Fig. 6F–H), indicating anti-proliferative effects of IR-B. To further confirm effects of IR-B expression on proliferation, we generated SW480 cells with enhanced IR-B expression (Fig. 6B). IR-B expression resulted in a significant 23.07±0.08% reduction in [3H]thymidine incorporation, versus empty vector control (Fig. 6F).
IR-B accelerates/enhances epithelial barrier function
We next investigated whether IR-B impacts differentiation biomarkers and intestinal epithelial barrier functions by assessing IR-B effects on: (1) the brush border enzyme SI; (2) the tight junction protein zonula occludens-1 (TJP1); and (3) intestinal epithelial barrier paracellular permeability. Subconfluent IR-B-expressing Caco-2 cells exhibited a significant, fourfold increase in SI mRNA versus empty vector controls, which expressed little to no SI mRNA. SI mRNA was also modestly, but non-significantly, enriched in post-confluent, differentiated IR-B-expressing cells (at 20-days post-plating) compared with controls (Fig. 7A). Consistent with IR-B accelerating expression of the differentiation marker SI, TJP1 protein was also enriched in IR-B-expressing Caco-2 cells versus controls (Fig. 7B). Importantly, paracellular permeability of IR-B-expressing Caco-2 cell monolayers was significantly reduced compared with monolayers of Caco-2 cells transduced with empty vector (Fig. 7C). Together, these results provide new evidence that IR-B decreases CRC cell proliferation, accelerates expression of differentiation biomarkers and enhances the barrier function of differentiated Caco-2 cells.
Fig. 7.
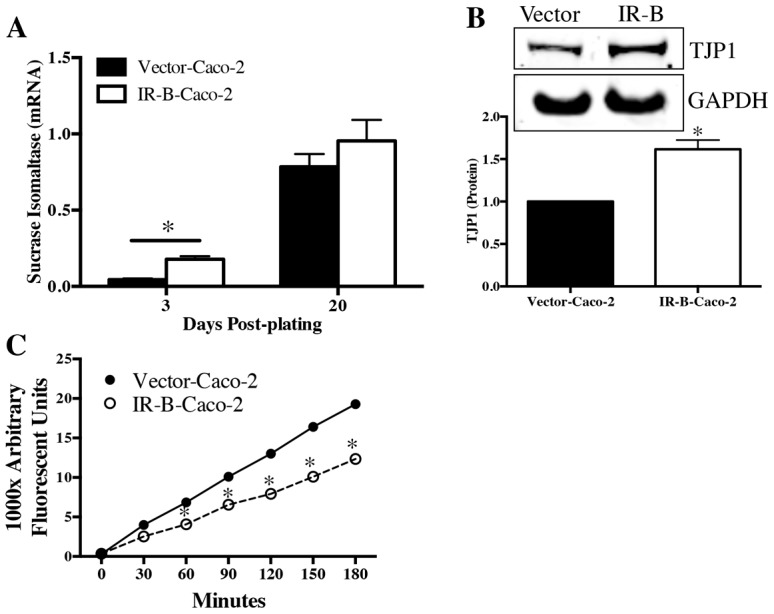
IR-B-Caco-2 cells exhibit accelerated sucrase isomaltase expression, enhanced TJP1 protein levels and improved barrier function. IR-B-Caco-2 and empty vector controls (Vector-Caco-2) were grown on Transwell filters for 3 days (undifferentiated) or 20 days (differentiated). (A) qRT-PCR was carried out to measure the differentiation biomarker sucrase isomaltase. Data represent mean ± s.e.m. of two independent experiments performed in triplicate; *P≤0.05 versus Vector-Caco-2; unpaired t-test. (B) Western blot was carried out to measure tight junction protein TJP1 in subconfluent Vector and IR-B-Caco-2 cells. Data represent three independent experiments; *P≤0.05 versus Vector-Caco-2, unpaired t-test. (C) Basolateral translocation of fluorescein-5-(and-6)-sulfonic acid was used to assess paracellular permeability, as a measure of junction function, every 30 minutes for 3 hours in Vector versus IR-B-Caco-2 cells grown on Transwell filters for 20 days. Data represent mean ± s.e.m. for two independent experiments performed in triplicate; *P<0.05 versus Vector-Caco-2, two-way ANOVA and Sidak's multiple comparisons test.
Discussion
The present study provides novel evidence for cell-type-specific differences in IR isoform expression and functions in the intestinal epithelium. Within different cell types of the normal intestinal epithelium the Ir isoforms were expressed in a gradient, which was correlated with proliferative capacity. IR-A was the predominant isoform in the undifferentiated, cycling IESCs and rapidly dividing progenitors in the crypt, whereas IR-B expression was increased in Sox9-EGFPHigh cells enriched for post-mitotic EEC and Sox9-EGFPNegative IECs enriched for other post-mitotic, differentiated lineages, including enterocytes. Our findings are consistent with studies in other tissues where IR-A levels were higher in progenitor cells, including white pre-adipocytes, osteoblast precursors and neural progenitors compared with differentiated cells (Avnet et al., 2012; Serrano et al., 2005; Ziegler et al., 2012).
Previous studies have also reported elevation of IR-A expression in various cancers; therefore, studies on the IR isoforms in cancer cells have primarily focused on IR-A (Frasca et al., 1999; Frittitta et al., 1999; Harrington et al., 2012; Heni et al., 2012; Huang et al., 2011; Malaguarnera et al., 2011; Sciacca et al., 1999; Vella et al., 2002). Here, we provide novel evidence for loss of IR-B in spontaneous small intestinal and colon adenomas in ApcMin/+ mice, and in aggressively growing, poorly differentiated human CRC cell lines. This is consistent with recent work showing that IR-B mRNA is also decreased, without much change in IR-A, in breast cancer tissue (Huang et al., 2011) and supports an emerging concept that maintaining IR-B expression or signaling might limit tumor formation or growth. Selective reductions in IR-B could also explain the enhanced IR-A∶ IR-B levels found in other cancer tissues (Frasca et al., 1999; Harrington et al., 2012; Heni et al., 2012; Huang et al., 2011; Kalli et al., 2002; Malaguarnera et al., 2011; Sciacca et al., 1999; Vella et al., 2002). In intestinal tumors from ApcMin/+ mice, which represent precancerous adenomas, we observed that decreases in IR-B were accompanied by decreased Irs2 expression, which was recently implicated in CDX2-dependent differentiation of IECs (Modica et al., 2009). Increases in Igf1 mRNA and decreases in Igf1r mRNA found here in small intestine and colon tumors from ApcMin/+ mice are also consistent with findings in human CRC (Allison et al., 2007; Tricoli et al., 1986; Wong et al., 2012). Decreased IGF1R expression has also been associated with cellular dedifferentiation in human colorectal tumors (Allison et al., 2007). Significant downregulation of Igf1r mRNA in ApcMin/+ tumors, coincident with maintained IR-A mRNA expression, increases the potential for IR-A as a mediator of proliferative effects of insulin or IGF signaling in tumors.
To further investigate the role of IR-B in IEC proliferation, differentiation and cancer, we studied Caco-2 cells (Chantret et al., 1988; Pinto et al., 1983). Although derived from a colorectal adenocarcinoma, post-confluent Caco-2 cells reduce proliferation and spontaneously express biomarkers of differentiated small intestinal enterocytes (Miller et al., 2004), including sucrase-isomaltase and tight junction proteins such as TJP1, and show enhanced intestinal barrier function (Chantret et al., 1988; Pinto et al., 1983). Our findings that post-confluent differentiated Caco-2 cells exhibit dramatic increases in total IR mRNA and protein compared with undifferentiated Caco-2 cells, are in agreement with recent work by Esposito and colleagues (Esposito et al., 2012). Importantly, our studies provide novel information that the increase in total IR reflects a significant and predominant increase in levels of IR-B mRNA and protein. This is consistent with other studies in breast, bone and adipose tissue showing that IR-B expression is enhanced following differentiation of progenitors or progenitor cell lines (Avnet et al., 2012; Berlato and Doppler, 2009; Entingh et al., 2003; Rowzee et al., 2009; Serrano et al., 2005). The increased level of IR-B in post-confluent differentiated Caco-2 cells is functional, as indicated by enhanced insulin-mediated IR-B tyrosine phosphorylation.
Our findings that elevated IR-B expression, mediated by lentiviral transduction in subconfluent undifferentiated Caco-2 cells, as well as in more aggressively growing SW480 cells, is sufficient to reduce thymidine incorporation into DNA and reduce cell proliferation provide novel evidence that high IR-B expression is sufficient to reduce CRC cell proliferation. Forced IR-B expression in Caco-2 cells also reduced levels of total and nuclear β-catenin, which normally promotes proliferation and is a crucial mediator of the oncogenic properties of colon cancer cells (van de Wetering et al., 2002).
Expression of differentiation markers such as SI typically occurs in Caco-2 cells only after at least 10–14 days of post-confluent culture (Jumarie and Malo, 1991), but enhanced IR-B expression prematurely increased SI expression as early as 3 days post-plating when cells were still subconfluent. IR-B-transduced Caco-2 cells also exhibited increased levels of TJP1 protein, indicating an increased potential to form tight junctions, which is another biomarker of differentiation. IR-B also enhanced barrier function in differentiated Caco-2 cells, as demonstrated by our data showing decreased paracellular permeability in Caco-2 cells expressing IR-B compared with controls. Overall, these results suggest that elevated IR-B expression in Caco-2 cells is sufficient to limit proliferation. IR-B also accelerates differentiation biomarker expression, but additional studies will be required to verify whether this is a direct consequence of IR-B or secondary to reduced proliferation. Future work will more directly assess the role of IR-B in differentiation using shRNA-mediated knockdown of IR-B. In other tissues, there is conflicting evidence about the ability of IR-B to induce differentiation (Avnet et al., 2012; Berlato and Doppler, 2009; Entingh et al., 2003). This could be due to differences in the overexpression systems used or the resulting levels of expression. Our IR-B expression system led to levels of IR-B in undifferentiated Caco-2 cells that approximated, but did not exceed, the levels found in post-confluent differentiated Caco-2 cells.
Recently, there has been interest in the potential for IR-A to compensate for IGF1R inhibition in tumor cells (Brierley et al., 2010; Buck et al., 2010; Ulanet et al., 2010). Our finding that IR-B expression can reduce proliferation of aggressively growing SW480 CRC cells, as well as Caco-2 cells, indicate that it will be of considerable interest to test the impact of IR-B overexpression on in vivo tumorigenicity of CRC cells that normally express primarily IR-A in xenograft assays, as well as their responsiveness to IGF1R inhibitors. The cell lines generated in this study provide tools to pursue such experiments. Similarly, selective and stable knockdown of IR-B or overexpression of IR-A in Caco-2 cells would complement our current findings and strengthen the evidence for selective anti-proliferative or pro-differentiative roles of IR-B. Knockdown of IR-B requires identification of efficient and specific shRNA constructs against the small, alternatively spliced exon 11 to stably knockdown IR-B, which poses a challenge but represents an area of future emphasis. Overexpression of IR-A in Caco-2 cells is also a future goal, but our finding that a predominance of IR-A in aggressively growing poorly-differentiated CRC cells and in normal IESCs and progenitors provides indirect evidence against anti-proliferative or pro-differentiation roles of IR-A.
Our observed gradient of low-to-high expression of IR-B in proliferating IESCs and progenitors versus post-mitotic differentiated IECs, reduced IR-B in ApcMin/+ tumors and the anti-proliferative effects of IR-B in CRC cells all support a new concept whereby maintaining IR-B expression and signaling in small intestinal and colonic epithelium could be crucial for normal homeostasis between proliferative cells and post-mitotic differentiated lineages and could potentially reduce the risk of tumor development or growth. Furthermore, decreased IR-B expression in small intestinal or colonic epithelium might also provide an early indicator of aberrant cell proliferation or risk of tumor development. Future work will examine the effects of enhanced IR-B expression on xenograft tumor growth to directly address the anti-tumorigenic effects of IR-B.
It is known that increases in circulating insulin correlate with colorectal adenoma risk in human patients (Keku et al., 2005), but it is still not known whether or which IR isoforms might mediate pro-tumorigenic effects of elevated insulin. Our findings that IR-B is downregulated in early ApcMin/+ adenomas resulting in a predominance of IR-A, indicate that it will be of great interest to assess whether loss of IR-B accompanies or occurs in colon or colon adenomas of humans with hyperinsulinemia.
Our results in sorted Sox9-EGFP cells, as well as in post-confluent, differentiated Caco-2 cells support a model that IR isoform switching occurs in the normal intestinal epithelium along the stem-cell–progenitor–differentiated lineage axis (Fig. 8). Previous work implies a role for the MBNL family of proteins in differentiation in Drosophila and other mammalian tissues (adipose, muscle) (Begemann et al., 1997; He et al., 2009; Pascual et al., 2006; Shang et al., 2002), but to our knowledge, these factors have not been examined or linked to differentiated lineages in the intestine. Our data indicate that expression of the IR-B splicing enhancer MBNL2 mirrors increased IR-B expression in Caco-2 cells following differentiation, suggesting a putative role for this enhancer in modulating IR isoform expression during intestinal epithelial differentiation. A role for MBNL2 in promoting IR-B expression is also supported by findings that relative levels of Mbnl2 were higher in normal mouse jejunum and colon compared with jejunal and colonic tumors in ApcMin/+ mice, paralleling the higher levels of IR-B in normal intestine and loss of IR-B in tumors. Although Cugbp1 mRNA expression was unchanged or decreased in ApcMin/+ tumor tissue, this splicing silencer was significantly decreased during Caco-2 cell differentiation, suggesting a role for decreased CUGBP1 in IR isoform switching during differentiation of Caco-2 cells, but a less clear role during tumorigenesis in mouse small intestine or colon (Fig. 8). Recently, Shapiro and co-workers found that MBNL1, MBNL2 and CUGBP1 might be involved in gene splicing changes that occur during epithelial-to-mesenchymal transition in breast cancer tissue (Shapiro et al., 2011). On the basis of studies in other systems and our current findings, we propose a model for the roles of these splicing regulators in IR isoform switching in IESCs and progenitors compared with post-mitotic differentiated lineages and early tumorigenesis (Fig. 8). Modulation of expression of these splicing enhancers or silencers by overexpression or knockdown represents a useful future direction to test this model further.
Fig. 8.
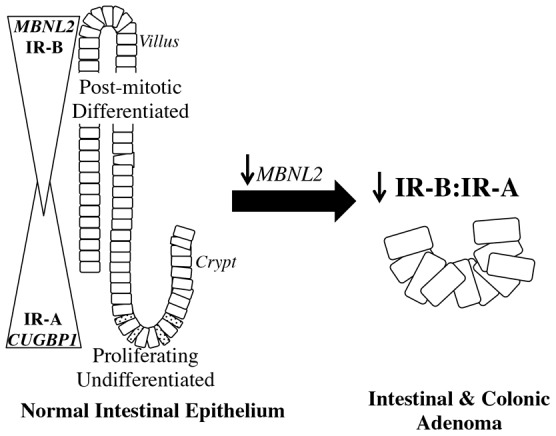
Model of IR isoform switching along the axis of proliferating crypt stem and progenitors to post-mitotic differentiated lineages and in adenoma formation. Our results support a model where IR-A expression is enriched in IESCs and progenitors (crypt), whereas IR-B expression is enhanced in post-mitotic, differentiated lineages (villus). IEC differentiation involves increased expression of exon 11 splicing enhancer MBNL2 and decreased expression of CUGBP1, exon 11 splicing silencer. These changes parallel the increase in IR-B in post-mitotic, differentiated IECs. During tumor formation, we propose that MBNL2 levels decrease, promoting a parallel decrease in IR-B expression. CUGBP1, CUG triplet repeat RNA-binding protein 1; MBNL2, muscleblind-like 2.
Overall, these results indicate a novel, predominant role for IR-A over IR-B in IESCs and progenitors, and suggest that maintaining IR-B expression and signaling in the small intestinal and colonic epithelia limits proliferation and protects against tumor cell growth or dedifferentiation. Importantly, elevated IR-B expression is sufficient to reduce proliferation in SW480 and Caco-2 CRC cells.
Materials and Methods
Sox9-EGFP and ApcMin/+ mice
Mice were maintained in our specific-pathogen free facility and provided water and food ad libitum. Sox9-EGFP mice (CD-1 background) were maintained as heterozygotes by breeding with wild-type CD-1 mice, and genotyping was carried out as described (Formeister et al., 2009). ApcMin/+ mice on a C57BL/6 background were purchased from the Jackson Laboratory (Bar Harbor, ME), maintained, and genotyped as described (Newton et al., 2010). All animal studies were approved by the Institutional Animal Care and Use Committee (IACUC) at the University of North Carolina at Chapel Hill.
Immunofluorescence
Immunofluorescent staining was performed as described (Van Landeghem et al., 2012) using anti-GFP (1∶500, chicken; Aves Labs, Tigard, OR). The secondary antibodies were Alexa-Fluor-488-labeled chicken IgG (1∶500, goat; Jackson ImmunoResearch Laboratories, West Grove, PA). Slides were imaged using an Olympus FluoView FV1000MPE Confocal microscope and FluoView Imaging Software (Hickville, NY).
Tissue harvest and FACS of small intestinal epithelial cells from Sox9-EGFP mice
Single-cell suspensions were generated from the jejunum of 6- to 10-week-old Sox9-EGFP mice after euthanasia by a lethal dose of Nembutal, as described (Van Landeghem et al., 2012). FACS was performed on a MoFlo XDP FACS machine (Dako/Cytomation, Carpinteria, CA). Summit v4.3 software was used to identify and isolate the distinct cell populations (Sox9-EGFPHigh, Sox9-EGFPLow, Sox9-EGFPSublow and Sox9-EGFPNegative) for RNA isolation, as outlined previously (Van Landeghem et al., 2012). Forward side-scatter gating excluded dead and immune cells and forward-scatter and side-scatter height–width plots were used to exclude doublets. qRT-PCR and gene microarray (Van Landeghem et al., 2012) was used to validate distinct profiles of Sox9-EGFP and enrichment of different populations for appropriate phenotypic biomarkers.
ApcMin/+ tissue harvest and tumor dissection
Animals were 14–17 weeks old. Tumors were harvested from small intestine and distal colons of ApcMin/+ mice for RNA isolation. Histology confirmed that tumors contained predominantly tumor epithelial cells with some underlying lamina propria. For comparison, normal small intestine and colonic mucosal punch biopsies were collected from wild-type animals. Wild-type tissue was used to avoid confounding effects from microadenomas, which could be present in apparently normal tissue from ApcMin/+ animals. Punch biopsies ensured sampling of epithelium and a small amount of underlying lamina propria as for tumors.
Cell lines and culture conditions
Colorectal cancer cell lines (Caco-2, HT-29, HCT116, SW480) were purchased from American Type Culture Collection (Manassas, VA). The human intestinal epithelial cell line (HIECs) was provided by J. F. Beaulieu (University of Sherbrooke, Quebec, Canada) and were characterized previously (Pageot et al., 2000; Perreault and Beaulieu, 1996). Caco-2, HT-29 and HCT116 cells were maintained in DMEM High Glucose (4.5 g/mL) (Gibco, Grand Island, NY) and the SW480 cells were maintained in RPMI 1640 with L-glutamine (Cellgro, Manassas, VA). CRC medium was supplemented with fetal bovine serum (FBS, 10% v/v) (Gemini, Sacramento, CA) and 50 U/ml penicillin, 50 µg/ml streptomycin (Gibco). Caco-2 medium also contained 10 mM glutamine (Gibco). HIEC cells were maintained in Opti-MEM (Gibco) supplemented with 5% FBS, Glutamax-1 (Gibco), 5 ng/ml recombinant human epidermal growth factor (EGF, Invitrogen, Grand Island, NY) and 50 U/ml penicillin, 50 µg/ml streptomycin.
Expression constructs and cloning
The pBluescript-IR-B expression construct was provided by Charles Roberts (Oregon Health Sciences University, Portland, OR). IR-B cDNA was excised and cloned into the HpaI site upstream of an internal ribosomal entry site (IRES) for a green fluorescent protein fused to a blasticidin-resistance gene (GFP-BSDR) in the HIV-based vector pTK642 to generate pTK642-IR-B. The orientation and sequence were confirmed by restriction digestion and sequencing. Empty vector pTK642 was used as a control.
Lentiviruses and lentiviral transduction
The pTK642 (Vector) and pTK642-IR-B (IR-B) vector constructs were packaged into self-inactivating HIV-1-based vectors with a VSV-G envelope by the University of North Carolina Vector Core Facility. Caco-2 or SW480 cells were incubated overnight with medium containing virus with empty vector or IR-B-containing vector. Stably expressing cells were selected and maintained using blasticidin (25 µg/ml (Caco-2) or 10 µg/ml (SW480), Invitrogen). Overexpression of IR-B was confirmed by RT-PCR and western blot. All subsequent experiments were conducted in medium containing half the dose of blasticidin used for selection.
Transwell differentiation assays
Caco-2 cells were plated on Transwell inserts (Costar, Fisher, Pittsburgh, PA) and harvested 48 hours after plating to study subconfluent cells and at 21 days after reaching confluence for differentiated cells. IR-B-Caco-2 or Vector-Caco-2 cells were harvested at 3 days or 20 days (post-confluent) after plating.
RNA isolation
RNA was isolated from cultured or sorted cells using RNeasy mini kit, on-column DNase digestion (Qiagen, Valencia, CA). RNA purity and integrity were confirmed by electrophoresis in agarose gels containing ethidium bromide. RNA was isolated from tissue using an RNeasy mini kit after homogenization in Lysing Matrix D tubes (MP Biomedicals, Santa Ana, CA) containing RLT buffer and 1% β-mercaptoethanol (Gibco) and a Precellys24 (Bertin Technologies, Rockville, MD).
RT-PCR for IR isoforms
cDNA synthesis was performed using 0.5–1.0 µg RNA and the High Capacity cDNA Reverse Transcription kit, including RNase inhibitor (Applied Biosystems, Carlsbad, CA). For mouse tissue, IR-A and IR-B mRNA expression was examined using primers located 5′ and 3′ to exon 11 such that IR-B (exon 11 included) and IR-A (exon 11 excluded) are amplified in the same reaction. PCR conditions modified from Ulanet and co-workers (Ulanet et al., 2010) were: denaturation for 5 minutes at 95°C, 30 cycles at 95°C for 30 seconds, annealing at 52°C for 40 seconds, and extension at 72°C for 30 seconds, concluding with 5 minutes at 72°C. Primers were forward, 5′-AATCAGAGTGAGTATGACGAC-3′ and reverse, 5′-ACCATTGTGCCCACAAGTC-3′. Fragments 210 bp (IR-A) and 246 bp (IR-B) were resolved on 2.5% agarose gels. For human cells, IR-A and IR-B mRNAs were examined using primers 5′ and 3′ to exon 11 (present in IR-B) and modified from a published protocol (Brierley et al., 2010): denaturation for 5 minutes at 92°C, 30 cycles of 92°C for 30 seconds, annealing at 60°C for 30 seconds, and extension at 72°C for 30 seconds. Primers were forward in exon 10, 5′-GAATGCTGCTCCTGTCCAAA-3′ and reverse in exon 12, 5′-TCGTGGGCACGCTGGTCGAG-3′. Fragments 214 bp (IR-A) and 250 bp (IR-B) were resolved on 2.5% agarose gels. Densitometry for IR-B to IR-A ratios was performed using ImageJ software, available from the National Institutes of Health (http://rsbweb.nih.gov/ij/).
Quantitative (qRT-PCR)
Quantitative real-time polymerase chain reaction (qRT-PCR) was performed using Platinum Quantitative PCR 2X Supermix-UDG (Invitrogen) and Taqman primer/probe sets (Applied Biosystems). Reactions were run using the Rotor-Gene 3000, software version 6.0.23 (Qiagen). Gene expression values were determined using a standard curve of pooled samples. All samples were run in triplicate and expression values reflect an average of replicates with <0.5 Ct of variation. All expression values were normalized to an invariant control gene as indicated. Primer/probe sets used for human genes include: ribosomal phosphoprotein P0 (RPLP0) Hs99999902_m1 (invariant control); CUG triplet repeat RNA binding protein 1 (CUGBP1) Hs00198069_m1; insulin receptor (INSR) Hs00961550_m1; muscleblind-like 2 (MBNL2) Hs01058996_m1; sucrase isomaltase (SI) Hs00356112_m1. Primer/probe sets used for mouse genes include: ribosomal protein S6 (Rps6) Mm02342456_g1 (invariant control); CUG triplet repeat RNA binding protein 1 (Cugbp1) Mm0133499_m1; insulin-like growth factor 1 (Igf1) Mm00439561_m1; insulin-like growth factor receptor (Igf1r) Mm00802831_m1; insulin receptor (Insr) Mm01211881_m1; insulin receptor substrate 1 (Irs1) Mm01278327_m1; insulin receptor substrate 2 (Irs2) Mm03038438_m1; muscleblind-like 2 (Mbnl2) Mm00614679_m1; serine arginine rich splicing factor 3 (Srsf3) Mm00786953_s1.
Western blotting
Cells were lysed in Laemmli lysis buffer (200 mM Tris-HCl, pH 6.8, 20% glycerol, 5% β-mercaptoethanol, 4% sodium dodecyl sulfate, 0.03% Bromophenol Blue). Lysates were boiled, sonicated, and resolved on NuPAGE 4–12% Bis-Tris 1.5 mm gels (Invitrogen) and transferred to a PVDF membrane (0.45 µm pore; Millipore, Billerica, MA). Membranes were blocked in Blocker Casein in PBS (Thermo Scientific, Fisher). Primary antibodies were incubated overnight at 4°C and were as follows: anti-AKT rabbit polyclonal (1∶1000, Cell Signaling Technology, Danvers, MA); anti-phospho-AKT (Ser473) rabbit monoclonal (1∶1000, D7F10, Cell Signaling Technology); anti-β-actin mouse monoclonal (1∶250, ACTBD11D7, Santa Cruz), as invariant control; β-catenin (1∶1000, R&D Systems, Minneapolis, MN); anti-insulin receptor-β rabbit polyclonal (1∶250; C-19, Santa Cruz Biotechnology, Santa Cruz, CA); anti-insulin receptor isoform B (rabbit, 1∶250) (provided by Giorgio Sesti, Universita Magna Graecia, Catanzaro, Italy) (Sesti et al., 1994); anti-sucrase-isomaltase goat polyclonal (1∶500, A-17, Santa Cruz); anti-zonula occludens-1 rabbit monoclonal (1∶1000; #8193, Cell Signaling Technology). Secondary antibodies were incubated at room temperature for 2 hours and conjugated to Dylight800 (goat anti-rabbit IgG, goat anti-mouse IgG, donkey anti-goat IgG) or Dylight680 (goat anti-mouse) (1∶20,000, Pierce, ThermoScientific Rockford, IL). Membranes were imaged using a LI-COR Odyssey infrared imaging system (Version 3, LI-COR, Lincoln, NE). Quantification was performed using ImageJ software.
Immunoprecipitation
Whole-cell extracts were prepared by scraping adherent cells into lysis buffer [50 mM Tris-HCl, pH 7.4, 150 mM NaCl, 1% nonylphenoxypolyethoxyethanol (NP-40), 0.25% sodium deoxycholate, 1 mM EDTA, 1 mM NaF, 1 µg/ml aprotinin, 1 mM PMSF and 1 mM vanadate]. Extracts were centrifuged and supernatants collected. Protein concentration was measured by BCA assay (bicinchoninic acid, Pierce, ThermoFisher Scientific, Rockford, IL) and protein integrity verified by PAGE followed by Coomassie Blue staining. IR-B was immunoprecipitated from 500 µg of cell lysate using 1 µg of anti-insulin receptor isoform B, rabbit (provided by Giorgio Sesti), followed by 50% slurry of Protein A (Sigma-Aldrich). Immunoprecipitates were disrupted in gel loading buffer (10% glycerol, 1% SDS, 30 mM Tris-HCl, pH 6.8, 2.5% β-mercaptoethanol), then size-fractionated on an 8.5% SDS-polyacrylamide gel, transferred onto an Immobilon-FL (Millipore) membrane, and blocked. Antibody details listed above.
Nuclear extracts
Nuclear extracts were prepared as described previously (Smith et al., 2001).
Cell Counting assay
Vector-Caco-2 and IR-B-Caco-2 cells were plated at 70,000 cells/cm2 in a 24-well plate and grown for 72 hours. Live cells were quantified using Trypan Blue (Sigma).
[3H]thymidine incorporation assay
Vector and IR-B cells (Caco-2 or SW480) were plated and adhered overnight. Subconfluent cells were then serum deprived overnight. Forty-eight hours after plating, [3H]thymidine was added and incorporation was measured 24 hours later, as previously described (Simmons et al., 1995).
Paracellular permeability assay
Vector-Caco-2 and IR-B-Caco-2 cells were grown on Transwell filters for 16 days after confluence. Paracellular permeability was quantified by recording the rate of fluorescein-5-(and-6)-sulfonic acid (final concentration, 0.1 mg/ml; Life Sciences, Grand Island, NY) translocation to the basolateral compartment using a Biotek Synergy HT plate reader (Biotek, Winooski, VT) with Gen5 software (Biotek), excitation, 485 nm; emission, 528 nm. Fluorescence was measured before the addition of sulfonic acid (baseline) and then every 30 minutes for 3 hours. Medium was returned to the basolateral compartment after each measurement to ensure constant volume.
Statistical analysis
All data represent means ± s.e.m. Specific n values are listed in legends. Data were analyzed using one-way or two-way ANOVA or Student's t-test, as appropriate. P<0.05 was considered statistically significant. Analyses were performed on GraphPad Prism 6.
Acknowledgments
The authors thank Dr Jean-Francois Beaulieu (University of Sherbrooke, Quebec, Canada) for the HIEC cells, Dr Charles Roberts (Oregon Health Sciences University, OR) for the original IR-B construct, Dr Giorgio Sesti (Universita Magna Graecia, Catanzaro, Italy) for the IR-B specific antibody, the UNC Viral Vector Core (University of North Carolina, NC) for packaging the vector and IR-B-vector constructs into lentiviruses, the Center for Gastrointestinal Biology and Disease (CGIBD) Histology Core and Kirk McNaughton for histology (University of North Carolina), and Dr Alan Fanning and the Intestinal Stem Cell Group (University of North Carolina) for insightful discussions and use of equipment.
Footnotes
Author contributions
S.F.A. designed, conducted, analyzed majority of experiments, wrote manuscript; J.S. designed, conducted, analyzed western blot experiments; A.T.M. designed, conducted, analyzed Sox9-EGFP sorted cell experiments; M.A.S. designed, conducted and analyzed experiment on panel of human cells; L.V.L. provided intellectual guidance and study design, and contributed to experiments; P.K.L. oversaw all studies and data analysis, contributed to writing manuscript, and provided intellectual guidance throughout study. All authors reviewed and approved the manuscript.
Funding
This work was supported by the National Institutes of Health [grant number F31-AG040943 to S.F.A. and 5-R01-DK040247-19 to P.K.L.]; the National Cancer Council to L.V.L.; and the Center for Gastrointestinal Biology and Disease [grant number P30-DK034987]. Deposited in PMC for release after 12 months.
References
- Allison A. S., McIntyre M. A., McArdle C., Habib F. K. (2007). The insulin-like growth factor type 1 receptor and colorectal neoplasia: insights into invasion. Hum. Pathol. 38, 1590–1602 10.1016/j.humpath.2007.03.013 [DOI] [PubMed] [Google Scholar]
- Avnet S., Perut F., Salerno M., Sciacca L., Baldini N. (2012). Insulin receptor isoforms are differently expressed during human osteoblastogenesis. Differentiation 83, 242–248 10.1016/j.diff.2012.02.002 [DOI] [PubMed] [Google Scholar]
- Barker N., van de Wetering M., Clevers H. (2008). The intestinal stem cell. Genes Dev. 22, 1856–1864 10.1101/gad.1674008 [DOI] [PMC free article] [PubMed] [Google Scholar]
- Begemann G., Paricio N., Artero R., Kiss I., Pérez-Alonso M., Mlodzik M. (1997). muscleblind, a gene required for photoreceptor differentiation in Drosophila, encodes novel nuclear Cys3His-type zinc-finger-containing proteins. Development 124, 4321–4331 [DOI] [PubMed] [Google Scholar]
- Belfiore A., Malaguarnera R. (2011). Insulin receptor and cancer. Endocr. Relat. Cancer 18, R125–R147 10.1530/ERC-11-0074 [DOI] [PubMed] [Google Scholar]
- Belfiore A., Frasca F., Pandini G., Sciacca L., Vigneri R. (2009). Insulin receptor isoforms and insulin receptor/insulin-like growth factor receptor hybrids in physiology and disease. Endocr. Rev. 30, 586–623 10.1210/er.2008-0047 [DOI] [PubMed] [Google Scholar]
- Berlato C., Doppler W. (2009). Selective response to insulin versus insulin-like growth factor-I and -II and up-regulation of insulin receptor splice variant B in the differentiated mouse mammary epithelium. Endocrinology 150, 2924–2933 10.1210/en.2008-0668 [DOI] [PubMed] [Google Scholar]
- Brierley G. V., Macaulay S. L., Forbes B. E., Wallace J. C., Cosgrove L. J., Macaulay V. M. (2010). Silencing of the insulin receptor isoform A favors formation of type 1 insulin-like growth factor receptor (IGF-IR) homodimers and enhances ligand-induced IGF-IR activation and viability of human colon carcinoma cells. Endocrinology 151, 1418–1427 10.1210/en.2009-1006 [DOI] [PubMed] [Google Scholar]
- Buck E., Gokhale P. C., Koujak S., Brown E., Eyzaguirre A., Tao N., Rosenfeld-Franklin M., Lerner L., Chiu M. I., Wild R. et al. (2010). Compensatory insulin receptor (IR) activation on inhibition of insulin-like growth factor-1 receptor (IGF-1R): rationale for cotargeting IGF-1R and IR in cancer. Mol. Cancer Ther. 9, 2652–2664 10.1158/1535-7163.MCT-10-0318 [DOI] [PubMed] [Google Scholar]
- Chantret I., Barbat A., Dussaulx E., Brattain M. G., Zweibaum A. (1988). Epithelial polarity, villin expression, and enterocytic differentiation of cultured human colon carcinoma cells: a survey of twenty cell lines. Cancer Res. 48, 1936–1942 [PubMed] [Google Scholar]
- Cheng H., Leblond C. P. (1974). Origin, differentiation and renewal of the four main epithelial cell types in the mouse small intestine. V. Unitarian Theory of the origin of the four epithelial cell types. Am. J. Anat. 141, 537–561 10.1002/aja.1001410407 [DOI] [PubMed] [Google Scholar]
- Cohen D. H., LeRoith D. (2012). Obesity, type 2 diabetes, and cancer: the insulin and IGF connection. Endocr. Relat. Cancer 19, F27–F45 10.1530/ERC-11-0374 [DOI] [PubMed] [Google Scholar]
- Cruz Guzmán O. R., Chávez García A. L., Rodríguez-Cruz M. (2012). Muscular dystrophies at different ages: metabolic and endocrine alterations. Int. J. Endocrinol. 2012, 485376 10.1155/2012/485376 [DOI] [PMC free article] [PubMed] [Google Scholar]
- Dansithong W., Paul S., Comai L., Reddy S. (2005). MBNL1 is the primary determinant of focus formation and aberrant insulin receptor splicing in DM1. J. Biol. Chem. 280, 5773–5780 10.1074/jbc.M410781200 [DOI] [PubMed] [Google Scholar]
- Entingh A. J., Taniguchi C. M., Kahn C. R. (2003). Bi-directional regulation of brown fat adipogenesis by the insulin receptor. J. Biol. Chem. 278, 33377–33383 10.1074/jbc.M303056200 [DOI] [PubMed] [Google Scholar]
- Esposito D. L., Aru F., Lattanzio R., Morgano A., Abbondanza M., Malekzadeh R., Bishehsari F., Valanzano R., Russo A., Piantelli M. et al. (2012). The insulin receptor substrate 1 (IRS1) in intestinal epithelial differentiation and in colorectal cancer. PLoS ONE 7, e36190 10.1371/journal.pone.0036190 [DOI] [PMC free article] [PubMed] [Google Scholar]
- Federico L. M., Naples M., Taylor D., Adeli K. (2006). Intestinal insulin resistance and aberrant production of apolipoprotein B48 lipoproteins in an animal model of insulin resistance and metabolic dyslipidemia: evidence for activation of protein tyrosine phosphatase-1B, extracellular signal-related kinase, and sterol regulatory element-binding protein-1c in the fructose-fed hamster intestine. Diabetes 55, 1316–1326 10.2337/db04-1084 [DOI] [PubMed] [Google Scholar]
- Formeister E. J., Sionas A. L., Lorance D. K., Barkley C. L., Lee G. H., Magness S. T. (2009). Distinct SOX9 levels differentially mark stem/progenitor populations and enteroendocrine cells of the small intestine epithelium. Am. J. Physiol. 296, G1108–G1118 10.1152/ajpgi.00004.2009 [DOI] [PMC free article] [PubMed] [Google Scholar]
- Frasca F., Pandini G., Scalia P., Sciacca L., Mineo R., Costantino A., Goldfine I. D., Belfiore A., Vigneri R. (1999). Insulin receptor isoform A, a newly recognized, high-affinity insulin-like growth factor II receptor in fetal and cancer cells. Mol. Cell. Biol. 19, 3278–3288 [DOI] [PMC free article] [PubMed] [Google Scholar]
- Frittitta L., Sciacca L., Catalfamo R., Ippolito A., Gangemi P., Pezzino V., Filetti S., Vigneri R. (1999). Functional insulin receptors are overexpressed in thyroid tumors: is this an early event in thyroid tumorigenesis? Cancer 85, 492–498 [DOI] [PubMed] [Google Scholar]
- Garrison A. P., Helmrath M. A., Dekaney C. M. (2009). Intestinal stem cells. J. Pediatr. Gastroenterol. Nutr. 49, 2–7 10.1097/MPG.0b013e3181ad3021 [DOI] [PubMed] [Google Scholar]
- Gough S. C., Belda-Iniesta C., Poole C., Weber M., Russell-Jones D., Hansen B. F., Mannucci E., Tuomilehto J. (2011). Insulin therapy in diabetes and cancer risk: current understanding and implications for future study: In Proceedings From a Meeting of a European Insulin Safety Consensus Panel, convened and sponsored by Novo Nordisk, Tuesday October 5, 2010 at The Radisson Edwardian Heathrow Hotel, Hayes, Middlesex, UK. Adv. Ther. 28, Suppl. 51–18 10.1007/s12325-011-0047-8 [DOI] [PubMed] [Google Scholar]
- Gracz A. D., Ramalingam S., Magness S. T. (2010). Sox9 expression marks a subset of CD24-expressing small intestine epithelial stem cells that form organoids in vitro. Am. J. Physiol. 298, G590–G600 10.1152/ajpgi.00470.2009 [DOI] [PMC free article] [PubMed] [Google Scholar]
- Haidari M., Leung N., Mahbub F., Uffelman K. D., Kohen-Avramoglu R., Lewis G. F., Adeli K. (2002). Fasting and postprandial overproduction of intestinally derived lipoproteins in an animal model of insulin resistance. Evidence that chronic fructose feeding in the hamster is accompanied by enhanced intestinal de novo lipogenesis and ApoB48-containing lipoprotein overproduction. J. Biol. Chem. 277, 31646–31655 10.1074/jbc.M200544200 [DOI] [PubMed] [Google Scholar]
- Harrington S. C., Weroha S. J., Reynolds C., Suman V. J., Lingle W. L., Haluska P. (2012). Quantifying insulin receptor isoform expression in FFPE breast tumors. Growth Horm. IGF Res. 22, 108–115 10.1016/j.ghir.2012.04.001 [DOI] [PMC free article] [PubMed] [Google Scholar]
- Hayashi A. A., Webb J., Choi J., Baker C., Lino M., Trigatti B., Trajcevski K. E., Hawke T. J., Adeli K. (2011). Intestinal SR-BI is upregulated in insulin-resistant states and is associated with overproduction of intestinal apoB48-containing lipoproteins. Am. J. Physiol. 301, G326–G337 10.1152/ajpgi.00425.2010 [DOI] [PubMed] [Google Scholar]
- He F., Dang W., Abe C., Tsuda K., Inoue M., Watanabe S., Kobayashi N., Kigawa T., Matsuda T., Yabuki T. et al. (2009). Solution structure of the RNA binding domain in the human muscleblind-like protein 2. Protein Sci. 18, 80–91 [DOI] [PMC free article] [PubMed] [Google Scholar]
- Heidegger I., Ofer P., Doppler W., Rotter V., Klocker H., Massoner P. (2012). Diverse functions of IGF/insulin signaling in malignant and noncancerous prostate cells: proliferation in cancer cells and differentiation in noncancerous cells. Endocrinology 153, 4633–4643 10.1210/en.2012-1348 [DOI] [PubMed] [Google Scholar]
- Heni M., Hennenlotter J., Scharpf M., Lutz S. Z., Schwentner C., Todenhöfer T., Schilling D., Kühs U., Gerber V., Machicao F. et al. (2012). Insulin receptor isoforms A and B as well as insulin receptor substrates-1 and -2 are differentially expressed in prostate cancer. PLoS ONE 7, e50953 10.1371/journal.pone.0050953 [DOI] [PMC free article] [PubMed] [Google Scholar]
- Huang J., Morehouse C., Streicher K., Higgs B. W., Gao J., Czapiga M., Boutrin A., Zhu W., Brohawn P., Chang Y. et al. (2011). Altered expression of insulin receptor isoforms in breast cancer. PLoS ONE 6, e26177 10.1371/journal.pone.0026177 [DOI] [PMC free article] [PubMed] [Google Scholar]
- Jones H. E., Gee J. M., Barrow D., Tonge D., Holloway B., Nicholson R. I. (2006). Inhibition of insulin receptor isoform-A signalling restores sensitivity to gefitinib in previously de novo resistant colon cancer cells. Br. J. Cancer 95, 172–180 10.1038/sj.bjc.6603237 [DOI] [PMC free article] [PubMed] [Google Scholar]
- Jumarie C., Malo C. (1991). Caco-2 cells cultured in serum-free medium as a model for the study of enterocytic differentiation in vitro. J. Cell. Physiol. 149, 24–33 10.1002/jcp.1041490105 [DOI] [PubMed] [Google Scholar]
- Kalla Singh S., Brito C., Tan Q. W., De León M., De León D. (2011). Differential expression and signaling activation of insulin receptor isoforms A and B: A link between breast cancer and diabetes. Growth Factors 29, 278–289 10.3109/08977194.2011.616200 [DOI] [PMC free article] [PubMed] [Google Scholar]
- Kalli K. R., Falowo O. I., Bale L. K., Zschunke M. A., Roche P. C., Conover C. A. (2002). Functional insulin receptors on human epithelial ovarian carcinoma cells: implications for IGF-II mitogenic signaling. Endocrinology 143, 3259–3267 10.1210/en.2001-211408 [DOI] [PubMed] [Google Scholar]
- Kant P., Hull M. A. (2011). Excess body weight and obesity – the link with gastrointestinal and hepatobiliary cancer. Nat. Rev. Gastroenterol Hepatol 8, 224–238 10.1038/nrgastro.2011.23 [DOI] [PubMed] [Google Scholar]
- Keku T. O., Lund P. K., Galanko J., Simmons J. G., Woosley J. T., Sandler R. S. (2005). Insulin resistance, apoptosis, and colorectal adenoma risk. Cancer Epidemiol. Biomarkers Prev. 14, 2076–2081 10.1158/1055-9965.EPI-05-0239 [DOI] [PubMed] [Google Scholar]
- Lin J. C., Yan Y. T., Hsieh W. K., Peng P. J., Su C. H., Tarn W. Y. (2013). RBM4 promotes pancreas cell differentiation and insulin expression. Mol. Cell. Biol. 33, 319–327 10.1128/MCB.01266-12 [DOI] [PMC free article] [PubMed] [Google Scholar]
- Malaguarnera R., Frasca F., Garozzo A., Gianì F., Pandini G., Vella V., Vigneri R., Belfiore A. (2011). Insulin receptor isoforms and insulin-like growth factor receptor in human follicular cell precursors from papillary thyroid cancer and normal thyroid. J. Clin. Endocrinol. Metab. 96, 766–774 10.1210/jc.2010-1255 [DOI] [PubMed] [Google Scholar]
- Miller M. E., Michaylira C. Z., Simmons J. G., Ney D. M., Dahly E. M., Heath J. K., Lund P. K. (2004). Suppressor of cytokine signaling-2: a growth hormone-inducible inhibitor of intestinal epithelial cell proliferation. Gastroenterology 127, 570–581 10.1053/j.gastro.2004.05.016 [DOI] [PubMed] [Google Scholar]
- Modica S., Morgano A., Salvatore L., Petruzzelli M., Vanier M. T., Valanzano R., Esposito D. L., Palasciano G., Duluc I., Freund J. N. et al. (2009). Expression and localisation of insulin receptor substrate 2 in normal intestine and colorectal tumours. Regulation by intestine-specific transcription factor CDX2. Gut 58, 1250–1259 10.1136/gut.2008.158386 [DOI] [PubMed] [Google Scholar]
- Moller D. E., Yokota A., Caro J. F., Flier J. S. (1989). Tissue-specific expression of two alternatively spliced insulin receptor mRNAs in man. Mol. Endocrinol. 3, 1263–1269 10.1210/mend-3-8-1263 [DOI] [PubMed] [Google Scholar]
- Mosthaf L., Grako K., Dull T. J., Coussens L., Ullrich A., McClain D. A. (1990). Functionally distinct insulin receptors generated by tissue-specific alternative splicing. EMBO J. 9, 2409–2413 [DOI] [PMC free article] [PubMed] [Google Scholar]
- Muñoz J., Stange D. E., Schepers A. G., van de Wetering M., Koo B. K., Itzkovitz S., Volckmann R., Kung K. S., Koster J., Radulescu S. et al. (2012). The Lgr5 intestinal stem cell signature: robust expression of proposed quiescent ‘+4’ cell markers. EMBO J. 31, 3079–3091 10.1038/emboj.2012.166 [DOI] [PMC free article] [PubMed] [Google Scholar]
- Newton V. A., Ramocki N. M., Scull B. P., Simmons J. G., McNaughton K., Lund P. K. (2010). Suppressor of cytokine signaling-2 gene disruption promotes Apc(Min/+) tumorigenesis and activator protein-1 activation. Am. J. Pathol. 176, 2320–2332 10.2353/ajpath.2010.090684 [DOI] [PMC free article] [PubMed] [Google Scholar]
- Pageot L. P., Perreault N., Basora N., Francoeur C., Magny P., Beaulieu J. F. (2000). Human cell models to study small intestinal functions: recapitulation of the crypt-villus axis. Microsc. Res. Tech. 49, 394–406 [DOI] [PubMed] [Google Scholar]
- Pascual M., Vicente M., Monferrer L., Artero R. (2006). The Muscleblind family of proteins: an emerging class of regulators of developmentally programmed alternative splicing. Differentiation 74, 65–80 10.1111/j.1432-0436.2006.00060.x [DOI] [PubMed] [Google Scholar]
- Paul S., Dansithong W., Kim D., Rossi J., Webster N. J., Comai L., Reddy S. (2006). Interaction of muscleblind, CUG-BP1 and hnRNP H proteins in DM1-associated aberrant IR splicing. EMBO J. 25, 4271–4283 10.1038/sj.emboj.7601296 [DOI] [PMC free article] [PubMed] [Google Scholar]
- Perreault N., Beaulieu J. F. (1996). Use of the dissociating enzyme thermolysin to generate viable human normal intestinal epithelial cell cultures. Exp. Cell Res. 224, 354–364 10.1006/excr.1996.0145 [DOI] [PubMed] [Google Scholar]
- Pinto M., Robineleon S., Appay M. D., Kedinger M., Triadou N., Dussaulx E., Lacroix B., Simonassmann P., Haffen K., Fogh J. et al. (1983). Enterocyte-like differentiation and polarization of the human-colon carcinoma cell-line caco-2 in culture. Biol. Cell 47, 323–330 [Google Scholar]
- Rowzee A. M., Ludwig D. L., Wood T. L. (2009). Insulin-like growth factor type 1 receptor and insulin receptor isoform expression and signaling in mammary epithelial cells. Endocrinology 150, 3611–3619 10.1210/en.2008-1473 [DOI] [PMC free article] [PubMed] [Google Scholar]
- Sciacca L., Costantino A., Pandini G., Mineo R., Frasca F., Scalia P., Sbraccia P., Goldfine I. D., Vigneri R., Belfiore A. (1999). Insulin receptor activation by IGF-II in breast cancers: evidence for a new autocrine/paracrine mechanism. Oncogene 18, 2471–2479 10.1038/sj.onc.1202600 [DOI] [PubMed] [Google Scholar]
- Sciacca L., Mineo R., Pandini G., Murabito A., Vigneri R., Belfiore A. (2002). In IGF-I receptor-deficient leiomyosarcoma cells autocrine IGF-II induces cell invasion and protection from apoptosis via the insulin receptor isoform A. Oncogene 21, 8240–8250 10.1038/sj.onc.1206058 [DOI] [PubMed] [Google Scholar]
- Sen S., Talukdar I., Webster N. J. (2009). SRp20 and CUG-BP1 modulate insulin receptor exon 11 alternative splicing. Mol. Cell. Biol. 29, 871–880 10.1128/MCB.01709-08 [DOI] [PMC free article] [PubMed] [Google Scholar]
- Sen S., Talukdar I., Liu Y., Tam J., Reddy S., Webster N. J. (2010). Muscleblind-like 1 (Mbnl1) promotes insulin receptor exon 11 inclusion via binding to a downstream evolutionarily conserved intronic enhancer. J. Biol. Chem. 285, 25426–25437 10.1074/jbc.M109.095224 [DOI] [PMC free article] [PubMed] [Google Scholar]
- Serrano R., Villar M., Martínez C., Carrascosa J. M., Gallardo N., Andrés A. (2005). Differential gene expression of insulin receptor isoforms A and B and insulin receptor substrates 1, 2 and 3 in rat tissues: modulation by aging and differentiation in rat adipose tissue. J. Mol. Endocrinol. 34, 153–161 10.1677/jme.1.01635 [DOI] [PubMed] [Google Scholar]
- Sesti G., Tullio A. N., Marini M. A., Manera E., Borboni P., Accili D., Longhi R., Fusco A., Lauro R., Montemurro A. (1994). Role of the exon 11 of the insulin receptor gene on insulin binding identified by anti-peptide antibodies. Mol. Cell. Endocrinol. 101, 121–127 10.1016/0303-7207(94)90226-7 [DOI] [PubMed] [Google Scholar]
- Shang C. A., Thompson B. J., Teasdale R., Brown R. J., Waters M. J. (2002). Genes induced by growth hormone in a model of adipogenic differentiation. Mol. Cell. Endocrinol. 189, 213–219 10.1016/S0303-7207(01)00590-1 [DOI] [PubMed] [Google Scholar]
- Shapiro I. M., Cheng A. W., Flytzanis N. C., Balsamo M., Condeelis J. S., Oktay M. H., Burge C. B., Gertler F. B. (2011). An EMT-driven alternative splicing program occurs in human breast cancer and modulates cellular phenotype. PLoS Genet. 7, e1002218 10.1371/journal.pgen.1002218 [DOI] [PMC free article] [PubMed] [Google Scholar]
- Simmons J. G., Hoyt E. C., Westwick J. K., Brenner D. A., Pucilowska J. B., Lund P. K. (1995). Insulin-like growth factor-I and epidermal growth factor interact to regulate growth and gene expression in IEC-6 intestinal epithelial cells. Mol. Endocrinol. 9, 1157–1165 10.1210/me.9.9.1157 [DOI] [PubMed] [Google Scholar]
- Simons B. D., Clevers H. (2011). Stem cell self-renewal in intestinal crypt. Exp. Cell Res. 317, 2719–2724 10.1016/j.yexcr.2011.07.010 [DOI] [PubMed] [Google Scholar]
- Smith D. R., Hoyt E. C., Gallagher M., Schwabe R. F., Lund P. K. (2001). Effect of age and cognitive status on basal level AP-1 activity in rat hippocampus. Neurobiol. Aging 22, 773–786 10.1016/S0197-4580(01)00240-8 [DOI] [PubMed] [Google Scholar]
- Titus M. A., Zeithaml B., Kantor B., Li X., Haack K., Moore D. T., Wilson E. M., Mohler J. L., Kafri T. (2012). Dominant-negative androgen receptor inhibition of intracrine androgen-dependent growth of castration-recurrent prostate cancer. PLoS ONE 7, e30192 10.1371/journal.pone.0030192 [DOI] [PMC free article] [PubMed] [Google Scholar]
- Tricoli J. V., Rall L. B., Karakousis C. P., Herrera L., Petrelli N. J., Bell G. I., Shows T. B. (1986). Enhanced levels of insulin-like growth factor messenger RNA in human colon carcinomas and liposarcomas. Cancer Res. 46, 6169–6173 [PubMed] [Google Scholar]
- Ulanet D. B., Ludwig D. L., Kahn C. R., Hanahan D. (2010). Insulin receptor functionally enhances multistage tumor progression and conveys intrinsic resistance to IGF-1R targeted therapy. Proc. Natl. Acad. Sci. USA 107, 10791–10798 10.1073/pnas.0914076107 [DOI] [PMC free article] [PubMed] [Google Scholar]
- van de Wetering M., Sancho E., Verweij C., de Lau W., Oving I., Hurlstone A., van der Horn K., Batlle E., Coudreuse D., Haramis A. P. et al. (2002). The beta-catenin/TCF-4 complex imposes a crypt progenitor phenotype on colorectal cancer cells. Cell 111, 241–250 10.1016/S0092-8674(02)01014-0 [DOI] [PubMed] [Google Scholar]
- van der Flier L. G., Clevers H. (2009). Stem cells, self-renewal, and differentiation in the intestinal epithelium. Annu. Rev. Physiol. 71, 241–260 10.1146/annurev.physiol.010908.163145 [DOI] [PubMed] [Google Scholar]
- Van Landeghem L., Santoro M. A., Krebs A. E., Mah A. T., Dehmer J. J., Gracz A. D., Scull B. P., McNaughton K., Magness S. T., Lund P. K. (2012). Activation of two distinct Sox9-EGFP-expressing intestinal stem cell populations during crypt regeneration after irradiation. Am. J. Physiol. 302, G1111–G1132 10.1152/ajpgi.00519.2011 [DOI] [PMC free article] [PubMed] [Google Scholar]
- Vella V., Pandini G., Sciacca L., Mineo R., Vigneri R., Pezzino V., Belfiore A. (2002). A novel autocrine loop involving IGF-II and the insulin receptor isoform-A stimulates growth of thyroid cancer. J. Clin. Endocrinol. Metab. 87, 245–254 10.1210/jc.87.1.245 [DOI] [PubMed] [Google Scholar]
- Williamson R. C. (1982). Intestinal adaptation: factors that influence morphology. Scand. J. Gastroenterol. Suppl. 74, 21–29 [PubMed] [Google Scholar]
- Wong P., Weiner M. G., Hwang W. T., Yang Y. X. (2012). Insulin therapy and colorectal adenomas in patients with diabetes mellitus. Cancer Epidemiol. Biomarkers Prev. 21, 1833–1840 10.1158/1055-9965.EPI-12-0771 [DOI] [PMC free article] [PubMed] [Google Scholar]
- Yuhara H., Steinmaus C., Cohen S. E., Corley D. A., Tei Y., Buffler P. A. (2011). Is diabetes mellitus an independent risk factor for colon cancer and rectal cancer? Am. J. Gastroenterol 106, 1911–1921quiz 1922 [DOI] [PMC free article] [PubMed] [Google Scholar]
- Zeki S. S., Graham T. A., Wright N. A. (2011). Stem cells and their implications for colorectal cancer. Nat. Rev. Gastroenterol Hepatol 8, 90–100 10.1038/nrgastro.2010.211 [DOI] [PubMed] [Google Scholar]
- Ziegler A. N., Schneider J. S., Qin M., Tyler W. A., Pintar J. E., Fraidenraich D., Wood T. L., Levison S. W. (2012). IGF-II promotes stemness of neural restricted precursors. Stem Cells 30, 1265–1276 10.1002/stem.1095 [DOI] [PMC free article] [PubMed] [Google Scholar]