

Abstract
Nonalcoholic fatty liver disease (NAFLD) is the most common form of liver disease in the US and refers to a wide spectrum of liver damage, including simple steatosis, steatohepatitis, fibrosis and cirrhosis. The goal of the present study was to achieve a more detailed understanding of the molecular changes in response to high fat-induced liver steatosis through the identification of a differentially expressed liver transcriptome and proteome. Male C57/BL6 mice fed a high-fat lard diet for 8 weeks developed visceral obesity and hepatic steatosis characterized by significantly increased liver and plasma free fatty acid and triglyceride levels and plasma alanine aminotransferase activities. Transcriptome analysis demonstrated that, compared to the control diet (CD), high-fat diet changed the expression of 309 genes (132 up- and 177 down-regulated; by a twofold change and more, P<.05). Multiple genes encoding proteins involved in lipogenesis were down-regulated, whereas genes involved in fatty acid oxidation were up-regulated. Proteomic analysis revealed 12 proteins which were differentially expressed. Of these, glutathione S-transferases mu1 and pi1 and selenium-binding protein 2 were decreased at both the gene and protein levels. This is the first study to perform a parallel transcriptomic and proteomic analysis of diet-induced hepatic steatosis. Several key pathways involving xenobiotic and lipid metabolism, the inflammatory response and cell-cycle control were identified. These pathways provide targets for future mechanistic and therapeutic studies as related to the development and prevention of NAFLD.
Keywords: Nonalcoholic fatty liver disease, High-fat diet, Liver gene expression, Liver proteomic analysis
1. Introduction
Nonalcoholic fatty liver disease (NAFLD) represents the most common form of liver disease in the US, and it is now considered to be the hepatic manifestation of the metabolic syndrome. NAFLD is composed of a spectrum of liver pathology ranging from steatosis to inflammation often with fibrosis [nonalcoholic steatohepatitis (NASH)], to cirrhosis. Patients with NASH may die due to complications of end-stage liver disease, and NASH is an increasingly common indication for liver transplantation. NASH has been identified as an important risk factor for the development of hepatocellular carcinoma [1,2]. NAFLD is associated with obesity, insulin resistance, diabetes and hypertriglyceridemia [3,4]. The prevalence of NASH has been increasing in parallel with these conditions, and NAFLD has become an international public health threat. Currently, the prevalence of NAFLD is estimated to range from 10% to 30%, whereas the prevalence of NASH is 3–5% [5]. Importantly, there are no FDA-approved medications for this problem.
Several hypotheses have been proposed, but the mechanisms leading to NASH are unclear. Day and James [6] initially proposed the two-hit model to explain the progression of NAFLD. The first hit is usually attributed to caloric excess resulting in the deposition of excess lipid within hepatocytes. The disease does not progress unless additional cellular events or second hits occur. These second hits promote inflammation, cell death and fibrosis, which are the histological hallmarks of NASH. The phenomena of inflammation, cellular injury and progressive fibrosis have been linked to oxidative stress, insulin resistance, mitochondrial dysfunction and deregulated cytokine signaling. In general, NASH is associated with increased pro-inflammatory cytokines such as tumor necrosis factor-α and with decreased anti-inflammatory adipocytokines such as adiponectin [7,8]. In spite of a large number of clinical and experimental studies, the detailed, molecular mechanisms involved in the progression of NAFLD to NASH remain to be elucidated.
Recent innovations in genomic and proteomic technologies may help to clarify the complex pathogenic mechanisms of NAFLD and NASH [9]. cDNA microarrays have been used to analyze gene expression in obesity and NAFLD in experimental and human studies [10–14]. Proteomic analysis has been performed to identify protein markers for hepatic drug-induced steatosis [15], fibrosis [16] and hepatocellular carcinoma [17,18]. Other studies have included proteomic analysis of diet-induced fatty liver [19,20] and obesity/insulin resistance [21,22]. No NAFLD studies to date have simultaneously utilized the potentially complementary proteomic and transcriptomic technologies. Here, we employ an Agilent cDNA microarray gene chip and two-dimensional differential in-gel electrophoresis (2D-DIGE) with matrix-assisted laser desorption/ionization time-of-flight tandem mass spectrometry (MALDI-TOF/MS-MS) to discover potential gene patterns and new candidate proteins involved in the high-fat lard diet (HFLD) mouse model of NAFLD. In the present work, we examined the C57/BL6 mouse model of NAFLD which was demonstrated to produce the central obesity and liver steatosis as confirmed by blood and liver biochemical parameters and liver histology.
2. Materials and methods
2.1. Animals and their diets
Male C57/BL6 mice, weighing 22±2 g, were fed a HFLD (60% fat) or a control diet (CD, 10% fat) for 8 weeks. The animals were housed in a temperature- and light-controlled room. The mice had food and water ad libitum. Mouse chow was purchased from Research Diets (New Brunswick, NJ, USA). This protocol was approved by the University of Louisville Institutional Animal Care and Use Committee.
2.2. Sample collection
At 8 weeks, the mice were anesthetized with sodium-pentobarbital (nembutal, 80 mg/kg, ip). The abdominal cavity was opened and blood was withdrawn from the inferior vena cava. The liver was then perfused through the portal vein with ice-chilled saline. Part of the liver from the left lobe was harvested and fixed in 10% neutral-buffered formalin, while the remaining liver tissue was snap frozen in liquid N2 and stored at −80°C for further analysis.
2.3. Liver histological examination
For histological analysis, liver sections were fixed in 10% buffered formalin for 24 h and embedded in paraffin. Tissue sections were deparaffinized, stained with hematoxylin–eosin (H&E) and examined under light microscopy at 200× magnification.
2.4. Biochemical assays
Kits for biochemical analysis were purchased from the following: alanine aminotransferase (ALT), glucose, cholesterol and triacylglycerols (TAG), Thermo Electron (Melbourne, Australia); nonesterified-fatty acid (NEFA), Wako Chemical USA (Richmond, VA, USA); hyaluronic acid, Corgenix, Inc. (Broomfield, CO, USA); insulin and adiponectin, Millipore (St. Charles, MO, USA). For liver TAG assay, hepatic tissue (100 mg) was homogenized in 50 mM NaCl. The homogenate (500 μl) was mixed with chloroform/methanol (2:1, 4 ml) and incubated overnight at room temperature with gentle shaking. Homogenates were vortexed and centrifuged for 5 min at 3000×g. The lower lipid phase was collected and concentrated by vacuum. The lipid pellets were dissolved in 1% Triton X100 in phosphate-buffered saline, and hepatic TAG content was determined via enzymatic colorimetric methods. Statistical analyses for biochemical assays were performed using GraphPad Prism version 5.01 for Windows. Data were expressed as mean±S.E.M. Student’s t test was performed to evaluate significant differences between the compared groups, which were defined as P<.05.
2.5. cDNA microarray analysis
2.5.1. RNA preparation and cDNA assay
Total liver RNA was extracted and purified using the RNeasy Mini Kit (Qiagen, Valencia, CA, USA) and its quality assessed using the Agilent 2100 bioanalyzer (Agilent, Wilmington, DE, USA). Low RNA Input Linear Amplification kit with one color (Agilent) was used to synthesize cDNA by using the T7(dT) primer and cRNA by using the T7 RNA polymerase, which simultaneously incorporated cyanine 3-labeled CTP. Labeled cRNA was purified using the RNeasy Mini Elute kit (Qiagen), quantified spectrophotometrically, fragmented and hybridized individually to the Agilent Mouse Genome Microarray (014868) at 65°C for 17 h. The microarray was composed of 41,534 sixty-mer oligonucleotide probes representing over 41,000 mouse genes and transcript. The arrays were washed, stained and scanned using an Agilent microarray scanner (G2565BA).
2.5.2. Microarray data analysis
Microarray data were obtained from liver samples of 12 mice (seven animals in the control group and five animals in the HFLD group). The arrays were normalized to the median of chips using a per-chip 50th percentile method. Per gene on median normalization was used to normalize the expression of every gene on its median among samples. Benjamini and Hochberg false discovery rate correction test was used for adjusting the P value. In this study, a minimum twofold change (P<.05) difference in gene expression between experimental groups was used as the inclusion criteria for a gene. All data processing steps were performed using GeneSpring GX 7.3 software (Agilent Technologies). Gene Ontology database (NCBI) and Ingenuity Pathways Analysis (IPA, Ingenuity System, Redwood City, CA, USA) were used for gene annotation and for identifying known biological networks and pathways associated with gene expression differences in response to HFLD.
2.6. Quantitative real-time polymerase chain reaction
Differential expression of selected genes identified by microarray analysis was validated by real-time SYBR Green quantitative real-time polymerase chain reaction (qRT-PCR) using the same RNA used for cDNA microarray. Primer sequences from SABiosciences (Frederick, MD, USA) were as follows: Gst m1 (PPM039104), Gst p1 (PPM03971A), Selenbp 2 (PPM34016B). Gene expression levels were calculated according to the 2−ΔΔCt method [23].
2.7. Proteomic analysis of liver samples
We used a high-throughput proteomic methodology consisting of 2D-DIGE followed by protein identification by MALDI-TOF/MS-MS to analyze the mice liver proteome in response to high-fat feeding. The proteomic analysis was carried out for three animals per HFLD-fed group as well as for the CD-fed mice and was performed by Applied Biomics (Hayward, CA, USA).
Briefly, liver tissue lysates were prepared by homogenizing preweighed liver pieces in 2D lysis buffer [30 mM Tris-HCl (pH 8.8), 7 M urea, 2 M thiourea and 4% CHAPS] to achieve a final protein concentration of 4 to 8 mg/ml. The three liver samples to be compared were labeled with Cy3 or Cy5 dyes, and a 1:1 mix was also labeled with Cy2 which was included with the test samples as an internal labeling control. Samples were then analyzed using an Amersham Biosciences 2D-gel system (Amersham Biosciences, Piscataway, NJ, USA). Images were scanned using Typhoon TRIO, analyzed by ImageQuant software version 5.0 (GE Healthcare) and subjected to Differential In-Gel and Biological Variation Inter-Gel analysis using DeCyder software version 6.5 (GE Healthcare). Statistical significance was assessed by Student’s t test analysis. Significant change of protein abundance was defined as at least 1.5-fold difference (P<.05). Selected spots were collected with an Ettan Spot Picker (Amersham Biosciences); subjected to in-gel trypsinization, peptide extraction, peptide extraction and desalting; followed by MALDI-TOF/MC-MC (Applied Biosystems, Foster City, CA, USA) analysis to determine the protein identity. The detailed protocol of the proteomic analysis procedure is available elsewhere [24].
2.8. Western blot analysis
To validate differentially expressed proteins identified by 2D-DIGE, selected proteins were analyzed by Western blot using commercially available antibodies from Santa Cruz Biotechnology, Inc. (Santa Cruz, CA, USA) for GSTm1 (sc-133641) and ApoE (sc-6385); and from Lifespan Biosciences (Seattle, WA, USA) for GSTp1 (LS-C54948). In addition, lipoprotein lipase (sc-32885) and Vanin-1 (sc-16780) were selected to show agreement between 2D-DIGE and Western blot in terms of proteins whose expression was changed at the gene but not at the protein level. Liver tissue lysates were separated by sodium dodecyl sulfate (SDS)-PAGE and subsequently transferred to a PVDF membrane. Blots were visualized using Amersham Enhanced Chemiluminescence (ESL) Western blot detection (GE Healthcare).
3. Results
3.1. The HFLD-induced obesity and NAFLD at 8 weeks
Body weight was increased from baseline to study completion at 8 weeks in CD-fed mice by 17% compared to 81% (P<.05) in mice fed the HFLD. At 8 weeks, plasma ALT activity was significantly increased in HFLD-fed mice when compared with CD-fed mice, indicating that the diet-induced fat accumulation in the liver potentially caused liver damage resulting in liver enzyme elevation. Examination of H&E-stained slides at 200× magnification demonstrated NAFLD with HFLD feeding (Fig. 1). CD-fed mice had normal histology (Fig. 1A), while HFLD-fed mice developed macrovesicular steatosis without necrosis, inflammation or fibrosis (Fig. 1B). Plasma (42%) and liver (252%) TAG and NEFA (plasma 27%, liver 76%) were significantly increased in HFLD-fed mice compared to CD-fed mice. Although no differences were seen in glucose concentrations, the insulin level was significantly greater in the HFLD-fed group (2.4-fold, P<.05), while the adiponectin level was decreased (approximately two-fold, P<.05) in HFLD-fed mice. Plasma hyaluronic acid was unchanged between treatment groups. Some of our findings corroborate previously reported results [25–28]. The data are presented in Table 1. These data clearly demonstrate that HFLD induces obesity with insulin resistance and NAFLD at 8 weeks.
Fig. 1.
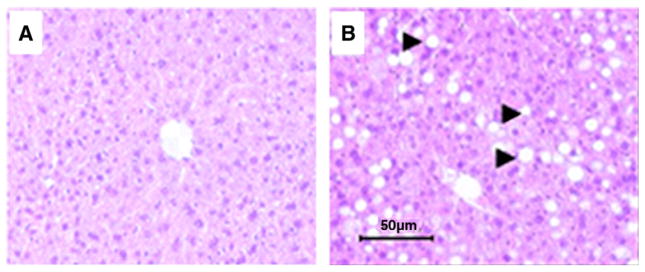
Liver histology (H&E staining) of CD-fed mice (A) and HFLD-fed mice (B). Fat accumulation in the hepatocyte has the shape of macrovacuole. (Magnification: 200x).
Table 1.
Body weight and biochemical plasma and liver parameters of the mice fed HFLD vs. CD
| CD | HFLD | P value | |
|---|---|---|---|
| Body weight, ga | 25.8±2.3 | 40.0±3.8 | .0070 |
| Fat pad, g | 0.449±0.034 | 3.107±0.176 | .0032 |
| Plasma | |||
| ALT, U/L | 26.2±1.8 | 58.3±7.4 | .0008 |
| Plasma glucose, mg/dl | 94±7.0 | 108±10.1 | .2654 |
| Insulin, pg/ml | 623.4±89.2 | 1,527±11.3 | <.0001 |
| Plasma adiponectin, μg/ml | 39.7±3.7 | 18.5±3.1 | .0014 |
| Plasma triglycerides, mg/dl | 56.4±4.3 | 80.4±4.4 | .0025 |
| Plasma free fatty acids, mEq/L | 0.29±0.02 | 0.37±0.02 | .0170 |
| Plasma cholesterol, mg/dl | 84.2±5.8 | 165.2±15.1 | .0002 |
| Plasma hyaluronan, ng/ml | 57.4±7.6 | 63.9±8.8 | .5852 |
| Liver | |||
| Liver triglycerides, mg/g liver | 42.0±2.9 | 148.0±6.8 | .0050 |
| Liver free fatty acids, μmol/g liver | 8.5±0.29 | 11.9±0.8 | .0014 |
The initial body weight was 22±2 g (n=13).
Mean±S.E.M. values were calculated for seven animals in the CD-fed group and six animals for the HFLD-fed group.
3.2. Liver gene expression analysis
To identify gene expression changes associated with HFLD-induced liver steatosis, cDNA microarray analysis was performed using mRNA isolated from HFLD- and CD-fed mice. Analysis of the transcriptome showed that 309 genes were differentially expressed 2.0-fold or greater (P<.05) in response to HFLD feeding. Of these, 132 genes were induced and 177 were suppressed. The complete list of genes whose expression was significantly regulated in response to HFLD feeding is presented in Supplemental Table S1. The high-fat induced changes in expression included genes that are involved in a variety of biological processes. Annotation of genes using the Gene Ontology database showed that the largest group of altered genes was associated with lipid metabolism, whereas detoxification/defense, inflammatory response and cell-cycle control were the next most commonly annotated groups. Using Ingenuity system pathway analysis, we identified biologically relevant networks with top function in lipid metabolism and metabolic disease (Supplemental Figures 1–3) associated with gene expression differences in response to HFLD.
At the level of individual genes, the key genes of lipid synthesis, such as acetyl-coenzyme A synthetase 2 (Acas2), stearoyl-coenzyme A desaturase 1 (Scd1) and elongation of very long chain fatty acids (Elovl3), were down-regulated in response to HFLD. The genes encoding enzymes of cholesterol biosynthesis, such as squalene epoxidase (Sqle), NAD(P)-dependent steroid dehydrogenase-like (Nsdhl), 3-hydroxy-3-methylglutaryl coenzyme A reductase (Hmgcr), were also decreased in the HFLD-fed mice. However, acetoacetyl-coenzyme A synthetase (Aacs), an essential enzyme for the synthesis of fatty acid and cholesterol from ketone bodies, was up-regulated. Increased expression of Aacs was possibly in response to the rise in the levels of acetyl-CoA, the substrate for ketone body production occurring due to up-regulation of genes involved in fatty acid oxidation such as carnitine palmitoyltransferase 1b (Cpt1b) and peroxisomal acyl-CoA thioesterase 2A and 2B (Pte2a, Pte2b).
Hepatic genes related to detoxification/oxidative stress responses, such as genes of the glutathione S-transferase family (Gsta1, Gsta2, Gsta4, Gstm1, Gstm3, Gstm6 and Gstp1), had lower expression levels in the HFLD group than in the CD group. HFLD-induced liver steatosis was also associated with reduced expression of multiple cytochrome P450 family genes such as Cyp2b10 and Cyp3a11. In contrast, Cyp4a10 was up-regulated. Although neither inflammation nor necrosis was observed on histological analysis of NAFLD in HFLD, several inflammatory pathways were activated. Genes encoding chemokines (Ccl2/Mcp1, Ccl5, Cxcl 9, Cxcl 10) involved in the inflammatory response were increased in response to HFLD. Expression of several genes implicated in apoptosis was altered by HFLD. Apoptosis-associated tyrosine kinase (Aatk) and caspase 3 (Casp3) were up-regulated, while Bcl-2-related ovarian killer protein (Bok), DNA-damage-inducible transcript 4 (Ddit4), SLIT-ROBO Rho GTPase-activating protein 3 (Srgap3) and sphingomyelin phosphodiesterase 3 neutral (Smpd3) were down-regulated. Although hepatocellular carcinoma was not detected histologically, it is potentially important to note that several genes associated with tumorigenesis were up-regulated in response to HFLD feeding, such as Jun oncogene (Jun), absent in melanoma 1-like gene (Aim1l), suppression of tumorigenicity 5 (St5), and Z-DNA binding protein 1 (Zbp1).
3.3. Liver proteome analysis
Liver proteome analysis using 2D-DIGE followed by protein identification by MALDI-TOF/MS-MS (Fig. 2) revealed 12 proteins whose expression levels were changed by >1.5-fold with significant alteration (P<.05) in the HFLD group vs. the CD-fed mice (Table 2). There was no direct correlation between differential mRNA and protein expression pattern; however, expression of the three proteins, namely, GSTm1, GSTp1 and SBP2, followed the expression of related genes. According to their functional properties, the identified proteins fell into six different categories: (i) proteins involved in carbohydrate, lipid and energy metabolism, such as ketohexokinase (KHK), apolipoprotein E (ApoE) and 3-hydroxy-3-methylglutaryl-Coenzyme A synthase 2 (HMGCS2); (ii) proteins involved in detoxification and xenobiotic metabolism, such as glutathione S-transferases mu1 and pi1; (iii) proteins involved in amino acid metabolism, such as methionine adenosyltransferase I, alpha (MATI); (iv) molecular chaperons, such as chaperonin containing Tcp1, subunit 5, epsilon (CCT5); (v) intracellular inhibitor of the lysosomal cysteine proteinases, such as stefin A3 (STFA3); (vi) protein transport such as selenium-binding protein 2 (SBP2).
Fig. 2.

2D-DIGE analysis of the mice liver fed HFLD vs. CD. Analysis of the resulting 2D-DIGE gel images showed 18 protein spots to be differentially expressed between the HFLD and CD groups. Of these, six protein spots were found to be up-regulated and 12 protein spots down-regulated. Differentially expressed protein spots were excised from preparative gels, in-gel-digested with trypsin and analyzed using MALDI-TOF/MS-MS. A number of proteins were represented by several spots. (A) Liver lysates of CD-fed mice were labeled with Cy3, HFLD-fed mice with Cy5; a mixture of both (1:1) was used as internal standard labeled with Cy2. (B) Representative image of a 2D-DIGE gel (an overlay of the three dye scan images) showing spot identification numbers (refer to those in table) for proteins found differentially expressed in HFLD-fed vs. CD-fed mice. (C) 3D view of MATI, SBP2, GSTm1, GSTp1.
Table 2.
Liver proteins differentially expressed in mice fed HFLD vs. CD
| Protein name | Accession numbera | Symbols | Fold change HFLD/CD | P value | Spot numberb |
|---|---|---|---|---|---|
| 3-Hydroxy-3-methylglutaryl-coenzyme A synthase 2 | gi|31560689 | HMGCS2 | 2.08 | .028 | 949 |
| Ketohexokinase | gi|31982229 | KHK | 1.62 | .01 | 1427 |
| Methionine adenosyltransferase I, alpha | gi|19526790 | MATI | 1.54 | .004 | 924 |
| Apolipoprotein E | gi|192005 | ApoE | 1.52 | .0011 | 1430 |
| Selenium-binding protein 2c | gi|9507079 | SBP2 | −2.07 | .013 | 818, 824 |
| Stefin A3 | gi|13384636 | STFA3 | −2.02 | .01 | 1671 |
| Chaperonin containing Tcp1, subunit 5 (epsilon) | gi|6671702 | CCT5 | −1.92 | .0017 | 705 |
| Glutathione S-transferase, mu 1 | gi|6754084 | GSTm1 | −1.65 | .008 | 1661 |
| Chain F, modified glutathione S-transferase (Pi)c | gi|4557949 | GSTp1 | −1.57 | .028 | 1736, 1722 |
| Major urinary protein complex with 2-(sec-butyl) thiazoline | gi|494384 | MUP-1 | −1.5 | 0.0075 | 1824 |
| DNA segment, Chr 1 | gi|51705066 | – | −1.55 | .0078 | 144, 145 |
| d Predicted: agmatine ureohydrolase (agmatinase) | gi|20848362 | – | 1.56 | .009 | 1402 |
Accession number according to NCBI database.
Spot numbers refer to those in Fig. 2.
Dual protein expression of certain proteins may possibly be explained by a concomitant expression of isoforms, or protein subunits, or posttranslationally modified proteins.
Protein number gi|20848362 has been removed from the NCBI database.
3.4. Validation of gene and protein expression by qRT-PCR and Western blot analysis
To validate some of the microarray results, qRT-PCR was performed on representative genes, such as Gstm1, Gstp1 and Selenbp2. Fig. 3 presents a comparison of gene expression levels measured by cDNA microarray and qRT-PCR and demonstrates excellent correlation in expression levels. Selected proteins GSTm1, GSTp1 and ApoE were confirmed by Western blot analysis at the protein level. As shown in Fig. 4, there is good agreement in protein level between 2D-DIGE and Western blot analysis. In addition, we selected vanin-1 and LPL, whose differential gene expression was revealed by microarray analysis but changes at the protein level were not found by proteomic analysis. Western blot analysis (Fig. 5) did not show changes in these selected proteins either.
Fig. 3.
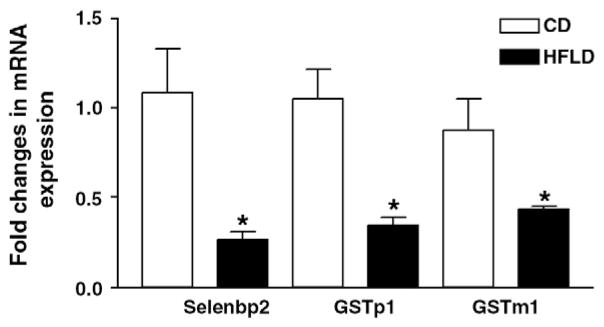
Validation of cDNA microarray analysis by qRT-PCR. Selenbp2, Gstp1 and Gstm1 were selected to validate cDNA microarray gene expression by qRT-PCR. qRT-PCR was performed in duplicate for each mouse (four mice per group). 18S was used as an endogenous control. Results are presented as the fold changes in mRNA expression of a given gene in HFLD-fed vs. CD-fed mice.
Fig. 4.

Conformation of the 2D-DIGE results by Western blot analysis. (A) ApoE, GSTp1 and GSTmu1 proteins were selected to confirm 2D-DIGE results by Western blot analysis. (B) The intensity of protein bands was quantified by densitometry using the NIH Image software (NIH, Bethesda, MD, USA). For changes in protein level, ratios of the respective protein to GAPDH, as a housekeeping protein, and densitometric values were compared between HFLD- and CD-fed mice by Student’s t test.
Fig. 5.

(A) Representative Western blots show no significant changes in Vanin-1 and lipoprotein lipase (LPL) at the protein level. Vanin-1 and LPL were selected as differentially expressed genes identified by cDNA microarray, but changes in their expression at the protein level were not detected by 2D-DIGE proteomic analysis. (B) The intensity of protein bands was quantified by densitometry using the NIH Image software (NIH, Bethesda, MD, USA). For changes in protein level, ratios of the respective protein to GAPDH, as a housekeeping protein, and densitometric values were compared between HFLD- and CD-fed mice by Student’s t test (*P<.05).
4. Discussion
The largest numbers of differentially expressed genes in HFLD-fed mice in our study were those involved in lipid metabolism. The increased fat accumulation in the liver found in HFLD-fed mice caused a down-regulation of lipogenic genes and the up-regulation of genes implicated in catabolism of free fatty acids, possibly by a feedback mechanism [29]. Increased mitochondrial β-oxidation of fatty acids is an important source of reactive oxygen species (ROS) [30]. We found that several enzymes of the GST family known to be involved in ROS detoxification were down-regulated in the diet-induced liver steatosis, which was in agreement with animal [12,22] and human [31] studies of liver pathology. It has been reported that transcriptional activation of some GST genes was associated with the change in the redox state in conjunction with oxidative stress through an Nrf2-mediated mechanism [32]. Parallel down-regulation of Gstp1 and Gstm1 in our study at mRNA and protein levels is consistent with potentially reduced antioxidant defenses in NAFLD. This may have major implications for the progression of NAFLD and in xenobiotic and drug metabolism. Furthermore, the metallothionein 1 (Mt1) gene known to be involved in protection against oxidative stress and metal toxicity [33] was also down-regulated in the HFLD-fed group. Interestingly, the vanin-1 gene (Vnn1), encoding pantetheinase, was overexpressed in our experiment. Pantetheinase has been shown to recycle pantethenic acid and to produce cysteamine, a potent antioxidant [34], and might be considered as a compensatory protective mechanism. Although NASH did not develop in our 8-week experiment, up-regulation of pro-inflammatory genes could have facilitated the progression from steatosis to steatohepatitis if the experiment had been conducted for a longer duration. The mechanism(s) of development of hepatic carcinoma is/are unknown, and exploration of gene networks involved in tumorigenesis found in our study could be an important direction for future investigations.
Compared to NAFLD transcriptomics, relatively little proteomic data exist for diet-induced NAFLD. Our study provides some novel proteomic data using the HFLD model of NAFLD. The protein level of MATI, a critical cellular enzyme that catalyzes the only reaction that generates S-adenosylmethionine (SAM), was increased by HFLD. High fat-mediated induction of hepatic MATI is contrary to other studies demonstrating reduced hepatic levels of SAM in diet and/or ethanol-induced fatty liver. However, increased MATI expression could potentially represent a compensatory mechanism to increased hepatic SAM demand. Furthermore, these seemingly conflicting results could be due to a varying expression of the enzymes at different stages of the development of liver steatosis. Hepatic MAT activity and expression are impaired in pathological conditions such as human cirrhosis [35] and in a variety of experimental models of liver injury [36,37]. It has been shown that MAT1A−/− mice exhibit impaired liver regeneration [38], are more likely to develop steatosis in response to a methionine-restricted and choline-deficient diet, spontaneously develop NASH [39] and ultimately may develop hepatocellular carcinoma [40]. Hepatic ApoE protein expression level was also increased in response to high-fat feeding. ApoE is a major protein involved in the metabolism of dietary lipids [41]. Recent animal studies and in vitro experiments have clearly established a role for ApoE in the regulation of hepatic VLDL-triglyceride secretion [42]. Our results are in agreement with observations showing that ApoE-deficient mice fed a Western-type diet were resistant to diet-induced obesity [43].
Down-regulation of the Selenbp2 gene was accompanied by twofold decrease in SBP2 protein levels in HFLD-fed mice. SBP2 has specific binding properties for selenium and acetaminophen, and is mainly expressed in the liver [44]. SBPs are considered to play an anticarcinogenic role and may also regulate cell growth [45]. Down-regulation of SBP2 was found in mice with CCl4-induced toxic liver fibrosis [46], in mice maintained on an atherogenic diet [47] and in MAT1A−/− mice [48]. The role of SBP2 in liver pathology is unclear but appears to be a novel relevant target in a variety of liver diseases. Chaperonin containing Tcp1 subunit 5 epsilon (CCT5) was another down-regulated protein in HFLD. The chaperonins are key molecular complexes, which are essential in the folding of proteins to produce stable and functionally competent protein conformations [49]. The mechanism and the significance of CCT5 down-regulation in NAFLD remain to be elucidated. Protein levels of stefin A3 were also down-regulated in response to high-fat feeding. Stefins are nonglycosylated intracellular inhibitors of cysteine cathepsin proteases [50], including cathepsins S and L, which play important roles in normal cellular functions such as protein turnover and antigen processing. Stefin A has also been reported to be a tumor suppressor gene [51]. Overweight and obese patients with type 2 diabetes had high stefin A serum concentrations [52]. However, the specific role of the stefins in the development and progression of NAFLD is currently unknown. Major urinary protein (MUP-1) level was reduced by HFLD. MUPs bind pheromones and assist in their elimination [53]. Markedly suppressed MUP-1 was found in obese ob/ob vs. lean mice [54]. The reason for the decreased expression of MUP-1 in response to HFLD feeding and its consequences are currently unknown.
Of the 309 genes and 12 proteins that underwent change in response to HFLD, expression of only three genes, Gstm1, Gstp1 and Selenbp2, was accompanied by related protein level changes. Such a low level of correspondence could be largely attributed to posttranslational modifications and regulation processes involving protein translation rate [55], mRNA and protein stability [56], and the intracellular location and molecular association of the protein products of expressed genes [57]. It is important to note that in the intact nondiseased liver tissue, approximately 25% of the changes in the mRNA transcript expression were not accompanied by changes in the expression of the corresponding proteins [58]. In the case of hepatic alteration produced by HFLD, even greater discordance could be expected. Furthermore, several studies have also shown only a modest transcriptome and proteome correspondence in yeast [59], mammalian cells and assorted murine organs and organelles [60]. Alternatively, the low level of association between transcript and protein levels could also be due to technical issues. As with other large-scale analyses, error could be introduced by the methods used to determine mRNA and protein expression levels. Microarray profiling is a more mature technology and it could have higher sensitivity than 2D-DIGE. Although our comparison has limitations, this is a first attempt of parallel analysis of cDNA microarray data and 2D-DIGE proteomic platform in high fat-induced liver steatosis. The observed level of correlation between mRNA and protein expression suggests that integrated analysis of both transcriptome and proteome is important to gain understanding of pathogenesis in NAFLD.
Supplementary Material
Supplemental Table 1S. Complete list of genes whose expression was significantly regulated in response to high fat lard feeding
Supplemental figure 1. Ingenuity pathway analysis identifies a network of 26 differentially expressed “focus” genes with highly significant score of 43. Network includes APOA4, CD36, CGREF1, CPT1B, CYP26A1, CYP7A1, DHX58, FASN, FDPS, G0S2, GBP2, GNGT1, IHPK2, INSIG1, INSIG2, LPL, LTB, ME1, PCSK9, PLTP, RSAD2, SCD, SLC27A1, VLDLR, VPREB1 (includes EG:7441), ZBP1 with main function in lipid metabolism, molecular transport, and small molecule biochemistry
Supplemental Figure 2. Ingenuity pathway analysis identifies a network of 17 differentially expressed “focus” genes which include ABCA8, ATP4A, C5ORF45, CES2 (includes EG:234671), CIDEC, CYP4A11, CYP51A1, CYP7A1, DNAJA1, EIF4E3, MGLL, ONECUT1, PEX26, SEMA5B, TAT, TRIB3, VNN1 with main function in metabolic disease and lipid metabolism
Supplemental Figure 3. Ingenuity pathway analysis identifies a network of 17 differentially expressed “focus” genes which include 2310043N10RIK, AACS, ACSS2, AGPAT9, ALDOC, CSAD, ELOVL3, FASN, FDPS, HMGCR, IDI1, MAST1, NPB, NSDHL, PMVK, SDS, THRSP with main function in lipid metabolism and small molecule biochemistry
Acknowledgments
We would like to thank Xiaohong Li for her assistance with cDNA microarray.
Abbreviations
- CD
control diet
- 2D-DIGE
two-dimensional differential in-gel electrophoresis
- HFLD
high-fat lard diet
- MALDI-TOF/MS-MS
matrix-assisted laser desorption/ionization time-of-flight tandem mass spectrometry
- NAFLD
nonalcoholic fatty liver disease
- NASH
nonalcoholic steatohepatitis
- NEFA
nonesterified fatty acid
- ROS
reactive oxygen species
- SAM
S-adenosylmethionine
- TAG
triacylglycerols
Appendix A. Supplementary data
Supplementary data associated with this article can be found, in the online version, at doi:10.1016/j.jnutbio.2009.11.009.
Footnotes
This work was supported by grants from NIH (IVD R21AA015611; CJM P01AA017103, R01AA018016, R01DK071765, R01AA015970, R37AA010762), the VA (CJM) and the AASLD (MC). Part of this work was performed with the assistance of the University of Louisville Microarray Facility, which is supported by NIH IDeA Grant Awards KBRIN P20 RR16481 and COBRE Molecular Targets P20RR018733, as well as by NIEHS (CEGIB P30 ESO14443) and the University of Louisville J.G. Brown Cancer Center.
This article is dedicated to the memory of Dr. Ion Deaciuc, who passed away on June 25, 2008.
References
- 1.Marrero JA, Fontana RJ, Su GL, Conjeevaram HS, Emick DM, Lok AS. NAFLD may be a common underlying liver disease in patients with hepatocellular carcinoma in the United States. Hepatology. 2002;36:1349–54. doi: 10.1053/jhep.2002.36939. [DOI] [PubMed] [Google Scholar]
- 2.Bullock RE, Zaitoun AM, Aithal GP, Ryder SD, Beckingham IJ, Lobo DN. Association of non-alcoholic steatohepatitis without significant fibrosis with hepatocellular carcinoma. J Hepatol. 2004;41:685–6. doi: 10.1016/j.jhep.2004.05.008. [DOI] [PubMed] [Google Scholar]
- 3.Marchesini G, Brizi M, Morselli-Labate AM, Bianchi G, Bugianesi E, McCullough AJ, et al. Association of nonalcoholic fatty liver disease with insulin resistance. Am J Med. 1999;107:450–5. doi: 10.1016/s0002-9343(99)00271-5. [DOI] [PubMed] [Google Scholar]
- 4.Yeh MM, Brunt EM. Pathology of nonalcoholic fatty liver disease. Am J Clin Pathol. 2007;128:837–47. doi: 10.1309/RTPM1PY6YGBL2G2R. [DOI] [PubMed] [Google Scholar]
- 5.Clark JM. The epidemiology of nonalcoholic fatty liver disease in adults. J Clin Gastroenterol. 2006;40(Suppl 1):S5–S10. doi: 10.1097/01.mcg.0000168638.84840.ff. [DOI] [PubMed] [Google Scholar]
- 6.Day CP, James OF. Steatohepatitis: a tale of two “hits”? Gastroenterology. 1998;114:842–5. doi: 10.1016/s0016-5085(98)70599-2. [DOI] [PubMed] [Google Scholar]
- 7.McClain CJ, Mokshagundam SP, Barve SS, Song Z, Hill DB, Chen T, et al. Mechanisms of non-alcoholic steatohepatitis. Alcohol. 2004;34:67–79. doi: 10.1016/j.alcohol.2004.07.007. [DOI] [PubMed] [Google Scholar]
- 8.Tilg H, Hotamisligil GS. Nonalcoholic fatty liver disease: cytokine–adipokine interplay and regulation of insulin resistance. Gastroenterology. 2006;131:934–45. doi: 10.1053/j.gastro.2006.05.054. [DOI] [PubMed] [Google Scholar]
- 9.Baranova A, Liotta L, Petricoin E, Younossi ZM. The role of genomics and proteomics: technologies in studying non-alcoholic fatty liver disease. Clin Liver Dis. 2007;11:209–20. xi. doi: 10.1016/j.cld.2007.02.003. [DOI] [PubMed] [Google Scholar]
- 10.Rubio A, Guruceaga E, Vazquez-Chantada M, Sandoval J, Martinez-Cruz LA, Segura V, et al. Identification of a gene-pathway associated with non-alcoholic steatohepatitis. J Hepatol. 2007;46:708–18. doi: 10.1016/j.jhep.2006.10.021. [DOI] [PubMed] [Google Scholar]
- 11.Sharma MR, Polavarapu R, Roseman D, Patel V, Eaton E, Kishor PB, et al. Transcriptional networks in a rat model for nonalcoholic fatty liver disease: a microarray analysis. Exp Mol Pathol. 2006;81:202–10. doi: 10.1016/j.yexmp.2006.06.001. [DOI] [PubMed] [Google Scholar]
- 12.Toye AA, Dumas ME, Blancher C, Rothwell AR, Fearnside JF, Wilder SP, et al. Subtle metabolic and liver gene transcriptional changes underlie diet-induced fatty liver susceptibility in insulin-resistant mice. Diabetologia. 2007;50:1867–79. doi: 10.1007/s00125-007-0738-5. [DOI] [PubMed] [Google Scholar]
- 13.Yoneda M, Endo H, Mawatari H, Nozaki Y, Fujita K, Akiyama T, et al. Gene expression profiling of non-alcoholic steatohepatitis using gene set enrichment analysis. Hepatol Res. 2008;38:1204–12. doi: 10.1111/j.1872-034X.2008.00399.x. [DOI] [PubMed] [Google Scholar]
- 14.Younossi ZM, Gorreta F, Ong JP, Schlauch K, Del Giacco L, Elariny H, et al. Hepatic gene expression in patients with obesity-related non-alcoholic steatohepatitis. Liver Int. 2005;25:760–71. doi: 10.1111/j.1478-3231.2005.01117.x. [DOI] [PubMed] [Google Scholar]
- 15.Meneses-Lorente G, Watt A, Salim K, Gaskell SJ, Muniappa N, Lawrence J, et al. Identification of early proteomic markers for hepatic steatosis. Chem Res Toxicol. 2006;19:986–98. doi: 10.1021/tx060007f. [DOI] [PubMed] [Google Scholar]
- 16.Spano D, Cimmino F, Capasso M, D’Angelo F, Zambrano N, Terracciano L, et al. Changes of the hepatic proteome in hepatitis B-infected mouse model at early stages of fibrosis. J Proteome Res. 2008;7:2642–53. doi: 10.1021/pr7006522. [DOI] [PubMed] [Google Scholar]
- 17.Orimo T, Ojima H, Hiraoka N, Saito S, Kosuge T, Kakisaka T, et al. Proteomic profiling reveals the prognostic value of adenomatous polyposis coli-end-binding protein 1 in hepatocellular carcinoma. Hepatology. 2008;48:1851–63. doi: 10.1002/hep.22552. [DOI] [PubMed] [Google Scholar]
- 18.Santamaria E, Munoz J, Fernandez-Irigoyen J, Prieto J, Corrales FJ. Toward the discovery of new biomarkers of hepatocellular carcinoma by proteomics. Liver Int. 2007;27:163–73. doi: 10.1111/j.1478-3231.2007.01447.x. [DOI] [PubMed] [Google Scholar]
- 19.Chanson A, Sayd T, Rock E, Chambon C, Sante-Lhoutellier V, Potier de Courcy G, et al. Proteomic analysis reveals changes in the liver protein pattern of rats exposed to dietary folate deficiency. J Nutr. 2005;135:2524–9. doi: 10.1093/jn/135.11.2524. [DOI] [PubMed] [Google Scholar]
- 20.Zhang L, Perdomo G, Kim DH, Qu S, Ringquist S, Trucco M, et al. Proteomic analysis of fructose-induced fatty liver in hamsters. Metabolism. 2008;57:1115–24. doi: 10.1016/j.metabol.2008.03.017. [DOI] [PMC free article] [PubMed] [Google Scholar]
- 21.Morand JP, Macri J, Adeli K. Proteomic profiling of hepatic endoplasmic reticulum-associated proteins in an animal model of insulin resistance and metabolic dyslipidemia. J Biol Chem. 2005;280:17626–33. doi: 10.1074/jbc.M413343200. [DOI] [PubMed] [Google Scholar]
- 22.Schmid GM, Converset V, Walter N, Sennitt MV, Leung KY, Byers H, et al. Effect of high-fat diet on the expression of proteins in muscle, adipose tissues, and liver of C57BL/6 mice. Proteomics. 2004;4:2270–82. doi: 10.1002/pmic.200300810. [DOI] [PubMed] [Google Scholar]
- 23.Livak KJ, Schmittgen TD. Analysis of relative gene expression data using real-time quantitative PCR and the 2(−Delta Delta C(T)) method. Methods. 2001;25:402–8. doi: 10.1006/meth.2001.1262. [DOI] [PubMed] [Google Scholar]
- 24.Tshala-Katumbay D, Monterroso V, Kayton R, Lasarev M, Sabri M, Spencer P. Probing mechanisms of axonopathy: Part I. Protein targets of 1,2-diacetylbenzene, the neurotoxic metabolite of aromatic solvent 1,2-diethylbenzene. Toxicol Sci. 2008;105:134–41. doi: 10.1093/toxsci/kfn103. [DOI] [PMC free article] [PubMed] [Google Scholar]
- 25.Hoffler U, Hobbie K, Wilson R, Bai R, Rahman A, Malarkey D, et al. Diet-induced obesity is associated with hyperleptinemia, hyperinsulinemia, hepatic steatosis, and glomerulopathy in C57Bl/6J mice. Endocrine. 2009;36:311–25. doi: 10.1007/s12020-009-9224-9. [DOI] [PMC free article] [PubMed] [Google Scholar]
- 26.Kim S, Sohn I, Ahn JI, Lee KH, Lee YS, Lee YS. Hepatic gene expression profiles in a long-term high-fat diet-induced obesity mouse model. Gene. 2004;340:99–109. doi: 10.1016/j.gene.2004.06.015. [DOI] [PubMed] [Google Scholar]
- 27.Kreeft AJ, Moen CJ, Porter G, Kasanmoentalib S, Sverdlov R, van Gorp PJ, et al. Genomic analysis of the response of mouse models to high-fat feeding shows a major role of nuclear receptors in the simultaneous regulation of lipid and inflammatory genes. Atherosclerosis. 2005;182:249–57. doi: 10.1016/j.atherosclerosis.2005.01.049. [DOI] [PubMed] [Google Scholar]
- 28.Gregoire FM, Zhang Q, Smith SJ, Tong C, Ross D, Lopez H, et al. Diet-induced obesity and hepatic gene expression alterations in C57BL/6J and ICAM-1-deficient mice. Am J Physiol Endocrinol Metab. 2002;282:E703–713. doi: 10.1152/ajpendo.00072.2001. [DOI] [PubMed] [Google Scholar]
- 29.Kim S, Sohn I, Lee YS, Lee YS. Hepatic gene expression profiles are altered by genistein supplementation in mice with diet-induced obesity. J Nutr. 2005;135:33–41. doi: 10.1093/jn/135.1.33. [DOI] [PubMed] [Google Scholar]
- 30.Sanyal AJ, Campbell-Sargent C, Mirshahi F, Rizzo WB, Contos MJ, Sterling RK, et al. Nonalcoholic steatohepatitis: association of insulin resistance and mitochondrial abnormalities. Gastroenterology. 2001;120:1183–92. doi: 10.1053/gast.2001.23256. [DOI] [PubMed] [Google Scholar]
- 31.Younossi ZM, Baranova A, Ziegler K, Del Giacco L, Schlauch K, Born TL, et al. A genomic and proteomic study of the spectrum of nonalcoholic fatty liver disease. Hepatology. 2005;42:665–74. doi: 10.1002/hep.20838. [DOI] [PubMed] [Google Scholar]
- 32.Aleksunes LM, Manautou JE. Emerging role of Nrf2 in protecting against hepatic and gastrointestinal disease. Toxicol Pathol. 2007;35:459–73. doi: 10.1080/01926230701311344. [DOI] [PubMed] [Google Scholar]
- 33.Formigari A, Irato P, Santon A. Zinc, antioxidant systems and metallothionein in metal mediated-apoptosis: biochemical and cytochemical aspects. Comp Biochem Physiol C Toxicol Pharmacol. 2007;146:443–59. doi: 10.1016/j.cbpc.2007.07.010. [DOI] [PubMed] [Google Scholar]
- 34.Pitari G, Malergue F, Martin F, Philippe JM, Massucci MT, Chabret C, et al. Pantetheinase activity of membrane-bound Vanin-1: lack of free cysteamine in tissues of vanin-1 deficient mice. FEBS Lett. 2000;483:149–54. doi: 10.1016/s0014-5793(00)02110-4. [DOI] [PubMed] [Google Scholar]
- 35.Martinez-Chantar ML, Garcia-Trevijano ER, Latasa MU, Perez-Mato I, Sanchez del Pino MM, Corrales FJ, et al. Importance of a deficiency in S-adenosyl-L-methionine synthesis in the pathogenesis of liver injury. Am J Clin Nutr. 2002;76:1177S–82S. doi: 10.1093/ajcn/76/5.1177S. [DOI] [PubMed] [Google Scholar]
- 36.Avila MA, Carretero MV, Rodriguez EN, Mato JM. Regulation by hypoxia of methionine adenosyltransferase activity and gene expression in rat hepatocytes. Gastroenterology. 1998;114:364–71. doi: 10.1016/s0016-5085(98)70489-5. [DOI] [PubMed] [Google Scholar]
- 37.Mato JM, Alvarez L, Ortiz P, Pajares MA. S-Adenosylmethionine synthesis: molecular mechanisms and clinical implications. Pharmacol Ther. 1997;73:265–80. doi: 10.1016/s0163-7258(96)00197-0. [DOI] [PubMed] [Google Scholar]
- 38.Chen L, Zeng Y, Yang H, Lee TD, French SW, Corrales FJ, et al. Impaired liver regeneration in mice lacking methionine adenosyltransferase 1A. Faseb J. 2004;18:914–6. doi: 10.1096/fj.03-1204fje. [DOI] [PubMed] [Google Scholar]
- 39.Lu SC, Alvarez L, Huang ZZ, Chen L, An W, Corrales FJ, et al. Methionine adenosyltransferase 1A knockout mice are predisposed to liver injury and exhibit increased expression of genes involved in proliferation. Proc Natl Acad Sci U S A. 2001;98:5560–5. doi: 10.1073/pnas.091016398. [DOI] [PMC free article] [PubMed] [Google Scholar]
- 40.Santamaria E, Munoz J, Fernandez-Irigoyen J, Sesma L, Mora MI, Berasain C, et al. Molecular profiling of hepatocellular carcinoma in mice with a chronic deficiency of hepatic S-adenosylmethionine: relevance in human liver diseases. J Proteome Res. 2006;5:944–53. doi: 10.1021/pr050429v. [DOI] [PubMed] [Google Scholar]
- 41.Zannis VI, Kypreos KE, Chroni A, Kardassi D, Zanni EE. Lipoproteins and atherogenesis. In: Loscalzo J, editor. Molecular mechanisms of atherosclerosis. New York, NY: Taylor & Francis; 2004. pp. 111–74. [Google Scholar]
- 42.Kuipers F, Jong MC, Lin Y, Eck M, Havinga R, Bloks V, et al. Impaired secretion of very low density lipoprotein-triglycerides by apolipoprotein E-deficient mouse hepatocytes. J Clin Invest. 1997;100:2915–22. doi: 10.1172/JCI119841. [DOI] [PMC free article] [PubMed] [Google Scholar]
- 43.Karagiannides I, Abdou R, Tzortzopoulou A, Voshol PJ, Kypreos KE. Apolipoprotein E redisposes to obesity and related metabolic dysfunctions in mice. Febs J. 2008;275:4796–809. doi: 10.1111/j.1742-4658.2008.06619.x. [DOI] [PubMed] [Google Scholar]
- 44.Mattow J, Demuth I, Haeselbarth G, Jungblut PR, Klose J. Selenium-binding protein 2, the major hepatic target for acetaminophen, shows sex differences in protein abundance. Electrophoresis. 2006;27:1683–91. doi: 10.1002/elps.200500703. [DOI] [PubMed] [Google Scholar]
- 45.Bansal MP, Mukhopadhyay T, Scott J, Cook RG, Mukhopadhyay R, Medina D. DNA sequencing of a mouse liver protein that binds selenium: implications for selenium’s mechanism of action in cancer prevention. Carcinogenesis. 1990;11:2071–3. doi: 10.1093/carcin/11.11.2071. [DOI] [PubMed] [Google Scholar]
- 46.Henkel C, Roderfeld M, Weiskirchen R, Scheibe B, Matern S, Roeb E. Identification of fibrosis-relevant proteins using DIGE (difference in gel electrophoresis) in different models of hepatic fibrosis. Z Gastroenterol. 2005;43:23–9. doi: 10.1055/s-2004-813911. [DOI] [PubMed] [Google Scholar]
- 47.Park JY, Seong JK, Paik YK. Proteomic analysis of diet-induced hypercholesterolemic mice. Proteomics. 2004;4:514–23. doi: 10.1002/pmic.200300623. [DOI] [PubMed] [Google Scholar]
- 48.Santamaria E, Avila MA, Latasa MU, Rubio A, Martin-Duce A, Lu SC, et al. Functional proteomics of nonalcoholic steatohepatitis: mitochondrial proteins as targets of S-adenosylmethionine. Proc Natl Acad Sci U S A. 2003;100:3065–70. doi: 10.1073/pnas.0536625100. [DOI] [PMC free article] [PubMed] [Google Scholar]
- 49.Lewis SA, Tian G, Vainberg IE, Cowan NJ. Chaperonin-mediated folding of actin and tubulin. J Cell Biol. 1996;132:1–4. doi: 10.1083/jcb.132.1.1. [DOI] [PMC free article] [PubMed] [Google Scholar]
- 50.Barrett AJ, Rawlings ND, Davies ME, Machleidt W, Salvesen G, Turk V. Proteinase inhibitors. In: Barrett AJ, Salvesen G, editors. Research monographs in cell and tissue physiology. Vol. 12. Amsterdam: Elsevier; 1986. pp. 515–69. [Google Scholar]
- 51.Strojan P, Oblak I, Svetic B, Smid L, Kos J. Cysteine proteinase inhibitor cystatin C in squamous cell carcinoma of the head and neck: relation to prognosis. Br J Cancer. 2004;90:1961–8. doi: 10.1038/sj.bjc.6601830. [DOI] [PMC free article] [PubMed] [Google Scholar]
- 52.Piwowar A, Fus I, Kanapik-Kordecka M, Warwas M. Serum stefin A in patients with type 2 diabetes. Pol Arch Med Wewn. 2004;111:319–25. [PubMed] [Google Scholar]
- 53.Timm DE, Baker LJ, Mueller H, Zidek L, Novotny MV. Structural basis of pheromone binding to mouse major urinary protein (MUP-I) Protein Sci. 2001;10:997–1004. doi: 10.1110/ps.52201. [DOI] [PMC free article] [PubMed] [Google Scholar]
- 54.Edvardsson U, von Lowenhielm HB, Panfilov O, Nystrom AC, Nilsson F, Dahllof B. Hepatic protein expression of lean mice and obese diabetic mice treated with peroxisome proliferator-activated receptor activators. Proteomics. 2003;3:468–78. doi: 10.1002/pmic.200390061. [DOI] [PubMed] [Google Scholar]
- 55.Harford JB, Morris DR. Post-transcriptional gene regulation. New York (NY): Wiley-Liss, Inc; 1997. [Google Scholar]
- 56.Varshavsky A. The N-end rule: functions, mysteries, uses. Proc Natl Acad Sci U S A. 1996;93:12142–9. doi: 10.1073/pnas.93.22.12142. [DOI] [PMC free article] [PubMed] [Google Scholar]
- 57.Urlinger S, Kuchler K, Meyer TH, Uebel S, Tampe R. Intracellular location, complex formation, and function of the transporter associated with antigen processing in yeast. Eur J Biochem. 1997;245:266–72. doi: 10.1111/j.1432-1033.1997.00266.x. [DOI] [PubMed] [Google Scholar]
- 58.Shackel NA, Seth D, Haber PS, Gorrell MD, McCaughan GW. The hepatic transcriptome in human liver disease. Comp Hepatol. 2006;5:6. doi: 10.1186/1476-5926-5-6. [DOI] [PMC free article] [PubMed] [Google Scholar]
- 59.Griffin TJGS, Ideker T, Rist B, Eng J, Hood L, Aebersold R. Complementary profiling of gene expression at the transcriptome and proteome levels in Saccharomyces cerevisiae. Mol Cell Proteomics. 2002;1:323–33. doi: 10.1074/mcp.m200001-mcp200. [DOI] [PubMed] [Google Scholar]
- 60.Kislinger T, Cox B, Kannan A, Chung C, Hu P, Ignatchenko A, et al. Global survey of organ and organelle protein expression in mouse: combined proteomic and transcriptomic profiling. Cell. 2006;125:173–86. doi: 10.1016/j.cell.2006.01.044. [DOI] [PubMed] [Google Scholar]
Associated Data
This section collects any data citations, data availability statements, or supplementary materials included in this article.
Supplementary Materials
Supplemental Table 1S. Complete list of genes whose expression was significantly regulated in response to high fat lard feeding
Supplemental figure 1. Ingenuity pathway analysis identifies a network of 26 differentially expressed “focus” genes with highly significant score of 43. Network includes APOA4, CD36, CGREF1, CPT1B, CYP26A1, CYP7A1, DHX58, FASN, FDPS, G0S2, GBP2, GNGT1, IHPK2, INSIG1, INSIG2, LPL, LTB, ME1, PCSK9, PLTP, RSAD2, SCD, SLC27A1, VLDLR, VPREB1 (includes EG:7441), ZBP1 with main function in lipid metabolism, molecular transport, and small molecule biochemistry
Supplemental Figure 2. Ingenuity pathway analysis identifies a network of 17 differentially expressed “focus” genes which include ABCA8, ATP4A, C5ORF45, CES2 (includes EG:234671), CIDEC, CYP4A11, CYP51A1, CYP7A1, DNAJA1, EIF4E3, MGLL, ONECUT1, PEX26, SEMA5B, TAT, TRIB3, VNN1 with main function in metabolic disease and lipid metabolism
Supplemental Figure 3. Ingenuity pathway analysis identifies a network of 17 differentially expressed “focus” genes which include 2310043N10RIK, AACS, ACSS2, AGPAT9, ALDOC, CSAD, ELOVL3, FASN, FDPS, HMGCR, IDI1, MAST1, NPB, NSDHL, PMVK, SDS, THRSP with main function in lipid metabolism and small molecule biochemistry