Abstract
Background
There are no well-established normal tissue sparing dose–volume histogram (DVH) criteria that limit the risk of urinary toxicity from prostate radiation therapy (RT). The aim of this study was to determine which criteria predict late toxicity among various DVH parameters when contouring the entire solid bladder and its contents versus the bladder wall. The area under the histogram curve (AUHC) was also analyzed.
Methods and Materials
From 1993 to 2000, 503 men with prostate cancer received 3-dimensional conformal RT (median follow-up time, 71 months). The whole bladder and the bladder wall were contoured in all patients. The primary endpoint was grade ≥2 genitourinary (GU) toxicity occurring ≥3 months after completion of RT. Cox regressions of time to grade ≥2 toxicity were estimated separately for the entire bladder and bladder wall. Concordance probability estimates (CPE) assessed model discriminative ability. Before training the models, an external random test group of 100 men was set aside for testing. Separate analyses were performed based on the mean age (≤ 68 vs >68 years).
Results
Age, pretreatment urinary symptoms, mean dose (entire bladder and bladder wall), and AUHC (entire bladder and bladder wall) were significant (P<.05) in multivariable analysis. Overall, bladder wall CPE values were higher than solid bladder values. The AUHC for bladder wall provided the greatest discrimination for late bladder toxicity when compared with alternative DVH points, with CPE values of 0.68 for age ≤68 years and 0.81 for age >68 years.
Conclusion
The AUHC method based on bladder wall volumes was superior for predicting late GU toxicity. Age >68 years was associated with late grade ≥2 GU toxicity, which suggests that risk-adapted dose constraints based on age should be explored.
Introduction
The ability to modulate the intensity of the radiation therapy (RT) beam with the advent of intensity modulated RT (IMRT) improved the conformality of treatment compared with the preceding 3-dimensional (3D) conformal RT (3DCRT) technique. Greater conformality is achievable with IMRT, in part because of the use of inverse treatment planning, a process in which the criteria that are used to ensure adequate radiation dose delivery to the prostate while limiting the dose to normal structures were not used with 3DCRT. This new process raised hopes of minimizing toxicity while higher and higher doses of RT were found to be beneficial (1, 2, 3). For example, rectal sparing has been shown to be improved when rectal dose constraints were used with IMRT (4, 5, 6) versus 3DCRT, and clinical experience has shown that this translates to lower rectal toxicity (7). Central to this advancement, however, have been well-designed rectal criteria based on dose–volume histogram (DVH) analyses, often of patients who received 3DCRT, which correlate rectal dose and volume with toxicity (8). Unfortunately, similar attempts of establishing a link between bladder dose and volume with toxicity have not yet been fruitful. Additionally, there are concerns that escalating doses of RT increase the rate of genitourinary (GU) toxicity.
Variations in bladder position and filling between different patients render evaluation of DVHs and their relationship to late complications difficult (9). Furthermore, studies vary in terms of how the structure of the bladder is conceptualized. Some studies view the bladder as a solid organ and contour the bladder wall and its entire contents (10, 11, 12), whereas others focus on the bladder wall alone (9, 13, 14). Additionally, GU toxicity does not always occur immediately after the cessation of RT; rather, it may often take 2 years or longer to develop, and rates increase over time. Thus, long-term follow-up should be considered an integral aspect of any thorough investigation of late chronic GU toxicity.
The aim of the present study was to determine which characteristics of the DVHs and dose–wall histograms (DWHs) of the bladder correlate with late GU toxicity among prostate cancer patients treated with 3DCRT. Additionally, a unique and unprecedented analysis of the area under the histogram curve (AUHC) is presented.
Methods and Materials
Patient cohort
Five hundred three patients with T1-4N0/XM0 adenocarcinoma of the prostate treated with 3DCRT alone (no androgen deprivation therapy) at Fox Chase Cancer Center between 1993 and 2000 were analyzed. The 3DCRT technique has been previously described (15). Patients received 46 to 50 Gy to a small pelvis field, followed by a conformal boost to the prostate and seminal vesicles in 2.0-Gy fractions. Typical small pelvis field borders were the middle of the sacroiliac joints superiorly, the bottom on the ischial tuberosities inferiorly, the symphysis pubis anteriorly, the S2/S3 interspace posteriorly, and 1.5 cm beyond the pelvic brim laterally. These pelvic fields were shaped only by corner blocks and were delivered with 2-field, 3-field, or 4-field beam arrangements. The planning target volume for conformal RT included the prostate with or without the seminal vesicles, with a margin of 1 to 1.5 cm to the block edge. All conformal treatments used 10-MV to 18-MV photons with a 4-field or 5-field beam arrangement. The radiation dose was prescribed to the 95% isodose line of the beam arrangements.
The bladder was contoured using 2 distinct methods: (1) contouring the entire bladder and its contents; and (2) contouring only the bladder wall (Fig. 1). The bladder wall thickness was inversely proportional to the total bladder volume evaluated on a computed tomographic slice-by-slice basis and ranged from 3 mm to 5 mm.
Fig. 1.
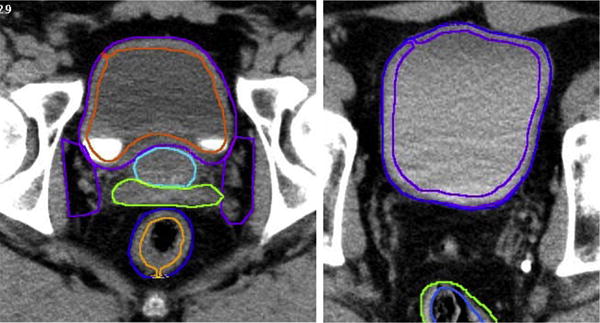
Bladder and bladder wall outlining. Bladder wall contouring was determined by the bladder filling. Thickness of the bladder wall was inversely related to the amount of urine in the bladder, with full bladders having thinner walls and empty bladders assuming thicker walls. All patients were contoured by the same person. Bladder wall contours ranged from 3 mm to 5 mm.
Patient and treatment-related characteristics are listed in Table 1. The median and mean age for patients was 68 years. The majority of patients (62%) had a Gleason score between 2 and 6 and a prostate-specific antigen level less than 10 ng/mL (54%). Comorbidities included in regression analysis were transurethral resection of the prostate (12%), hypertension (48%), heart disease (33%), and stroke (5%). Pretreatment urinary symptoms were scored as present or absent. Three hundred twenty-five men (65%) reported 1 or more pretreatment urinary symptoms, including obstructive voiding symptoms (86%), dysuria (3%), complete obstruction (3%), urinary tract infection (6%), and hematuria (9%).
Table 1.
Patient and treatment-related characteristics (n = 503)
| Characteristic | Median | Range |
|---|---|---|
| Age (y) | 68 | 43–84 |
| Prostate volume (cm3) | 37 | 15–139 |
| Serum prostate-specific antigen (ng/mL) | 15.6 | 0.4–135 |
| <10 | 54% | |
| 10–20 | 31% | |
| >20 | 15% | |
| Gleason score | 6 | 3–10 |
| 2–6 | 62% | |
| 7 | 27% | |
| 8–10 | 11% | |
| T stage | ||
| T1 | 36% | |
| T2 | 47% | |
| T3 | 9% | |
| T4 | 1% | |
| Prescribed radiation therapy dose (Gy) | 72 | 64–78 |
| Bladder solid volume (cm3) | 148 | 37.2–841 |
| Bladder solid mean dose (Gy) | 50.4 | 10.5–70 |
| Bladder wall volume (cm3) | 51 | 18.6–208.7 |
| Bladder wall mean dose (Gy) | 50.2 | 9.7–68.8 |
Late gastrointestinal and GU toxicity was recorded at each follow-up visit by using a modification of the Radiation Therapy Oncology Group and Late Effects Normal Tissue (LENT) Task Force criteria modeled after the Fox Chase LENT scale (16, 17). It has previously been described by Storey et al (17). The primary endpoint was grade ≥2 GU toxicity occurring ≥3 months after completion of RT.
Dose—volume histograms
Dose—volume records consisted of dosages delivered to percentage volumes of the bladder in increments of 5%. To conform to standards in the literature (the standard DVH), the data were interpolated to the percentage of volume receiving the dosage of interest. For the present analysis, the piecewise cubic hermite interpolating polynomial method of interpolation, previously described by Moler (18), was used. To avoid extrapolation, the interpolating function was restricted by the minimum and maximum dosages for each individual patient. This was implemented for 501 patients. For 2 patients, the data were not monotonically distributed; thus, interpolation could not be applied, and these patients were not included. To calculate the area under the curve for each patient, the trapezoidal method of approximation was used after interpolation.
Interpolation error analysis
To determine how interpolated data points might differ from the DVHs obtained from a treatment planning system, actual DVH data points were manually condensed in such a manner that they corresponded to dosages of radiation given to volume of the bladder in 5% increments. Volumes correlating to cGy of radiation in increments of 1 cGy were also manually extracted from the same DVH to verify the interpolation. The reduced 5% data were then interpolated using the piecewise cubic hermite interpolating polynomial such that it corresponded to the extracted DVH with dosage increments of 1 cGy. The mean percent error associated with the interpolated data points was <.005%.
Statistical analysis
Associations between the various parameters and the occurrence of late grade ≥2 GU toxicity were estimated using Cox regression (95% confidence intervals) of the time to late grade toxicity. Patients who did not experience toxicity were censored at the time of last contact. The variables were evaluated by univariable analysis and 2 multivariable analyses: 1 analysis for solid whole bladder contour data and the other for bladder wall contour data. Variables that were statistically significant in either of the multivariable regressions were included as untransformed covariates (ie, unchanged between models) in Cox regressions (ie, age, mean dose, and pretreatment urinary symptoms), and DVH variables were replaced between models for comparison (ie, V60, V62…V70, AUHC; where VXX is the volume receiving XX cGy). Concordance probability estimate (CPE) values were calculated for each model. The CPE has values from 0 to 1, with 0.5 indicating a lack of discrimination (random), and 1 indicating perfect ability to rank the time to event; CPE values greater than 0.7 indicate sufficient model predictive value (19). Before training the models, an external set (20% of the sample size) was set aside and used for testing. CPE values obtained from both the test set and the training set are shown. To ensure that training sets or test sets obtained were not particularly favorable or unfavorable, the training/testing algorithm was repeated 100 times using randomly partitioned sets each time. The reported CPE values represent the average CPE obtained from the 100 repetitions. Separate analyses were performed based on the mean age (≤68 vs >68 years) and type of contour data (whole bladder vs bladder wall). All tests were appropriate for use with censored time-to-event data.
Results
The median follow-up time was 72 months (range, 3.5–137 months). The number of late grade ≥2 GU toxicity events in the age ≤68 years group was 30/263 (11.4%), and the number of events in the age >68 years group was 26/240 (10.8%). Univariable and multivariable regression results are shown in Table 2. Age, pretreatment urinary symptoms, mean dosage to the wall, and AUHC were significant in the multivariable regression of contoured wall data (Table 2). Multivariable regression of solid whole bladder data yielded similar results except that pretreatment urinary symptoms were not significant.
Table 2.
Univariate and multivariate analysis for grade ≥2 late GU toxicity (n = 503)
| Multivariable analysis, P value
|
|||
|---|---|---|---|
| Variable | Univariable analysis, P value | Whole solid bladder | Contour wall bladder |
| Age | .059 | .038* | .047* |
| Pretreatment urinary symptoms | .04* | .051 | .027* |
| Hypertension | .32 | .39 | .40 |
| Stroke | .84 | .78 | .70 |
| TURP | .73 | .72 | .70 |
| Heart disease | .24 | .24 | .19 |
| AUHC (Solid whole bladder) | .047* | .014* | |
| Bladder solid mean dose | .042* | .012* | |
| V60 (solid whole bladder) | .056 | .15 | |
| V62 (solid whole bladder) | .055 | .11 | |
| V64 (Solid whole bladder) | .069 | .21 | |
| V66 (solid whole bladder) | .05 | .34 | |
| V68 (solid whole bladder) | .036* | .33 | |
| V70 (solid whole bladder) | .0068* | .13 | |
| AUHC (contoured bladder wall) | .043* | .024* | |
| Bladder wall mean dose | .039* | .022* | |
| V60 (contoured bladder wall) | .056 | .56 | |
| V62 (contoured bladder wall) | .055 | .96 | |
| V64 (contoured bladder wall) | .052 | .70 | |
| V66 (contoured bladder wall) | .05 | .60 | |
| V68 (contoured bladder wall) | .034* | .82 | |
| V70 (contoured bladder wall) | .0068* | .49 | |
Abbreviations: AUHC = area under the histogram curve; DVH = dose–volume histogram; DWH = dose–wall histogram; GU = genitourinary; TURP = transurethreal resection of prostate; VXX = volume receiving XX Gy.
P<.05.
The results of CPE analysis for this study are shown in Table 3. Based on visual inspection of Figure 2, a sharp increase in GU toxicity rates beginning at age 65 to 70 years was noted; this correlated with the mean age of 68. Therefore, an exploratory analysis using the age 68 as the cutpoint was performed comparing patients 68 years of age and younger to patients older than 68 years of age. Additionally, solid whole bladder data were compared with bladder wall contour data.
Table 3.
Concordance probability estimate (CPE) based on model parameter and bladder contouring method
| Solid whole bladder
|
Bladder wall contour
|
|||
|---|---|---|---|---|
| Model parameters | CPE training set (0.8*n) | CPE test set (0.2*n) | CPE training set (0.8*n) | CPE test set (0.2*n) |
| Age ≤68 y | ||||
| AUHC | 0.6697 | 0.6699 | 0.6726 | 0.6789 |
| V60 | 0.6562 | 0.6535 | 0.6575 | 0.6557 |
| V62 | 0.6521 | 0.6496 | 0.6549 | 0.6534 |
| V64 | 0.6550 | 0.6552 | 0.6651 | 0.6691 |
| V66 | 0.6553 | 0.6570 | 0.6600 | 0.6610 |
| V68 | 0.6494 | 0.6495 | 0.6592 | 0.6607 |
| V70 | 0.6475 | 0.6480 | 0.6581 | 0.6610 |
| Age >68 y | ||||
| AUHC | 0.7985 | 0.7995 | 0.8011 | 0.8057 |
| V60 | 0.7954 | 0.7951 | 0.7974 | 0.7992 |
| V62 | 0.7914 | 0.7953 | 0.7957 | 0.7996 |
| V64 | 0.7917 | 0.7955 | 0.7960 | 0.7995 |
| V66 | 0.7938 | 0.7907 | 0.7948 | 0.7938 |
| V68 | 0.7903 | 0.7927 | 0.7972 | 0.7950 |
| V70 | 0.7939 | 0.7985 | 0.7991 | 0.7997 |
Abbreviations: AUHC = area under the histogram curve; DVH = dose–volume histogram; DWH = dose–wall histogram; VXX = volume receiving XX cGy.
Variables included as untransformed covariates were age, mean dose, and pretreatment urinary symptoms; DVH variables were replaced between models for comparison (V60, V62…V70, AUHC).
Fig. 2.
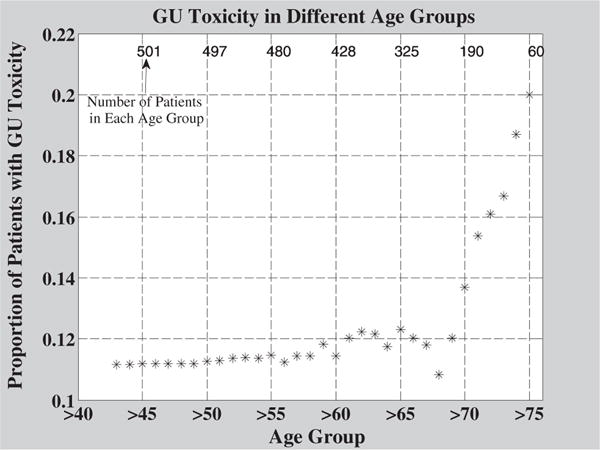
Crude rates of grade ≥2 genitourinary (GU) toxicity in different age groups. The mean age for patients in this study was 68. Older patient age groups had greater rates of toxicity. The number of patients in each age group is indicated by numbers above the data points. A rapid rise in toxicity rates is seen for age groups 70 and older.
For patients 68 years of age and younger, CPE values were below 0.7, whereas the older patient age group had CPE values well above the standard 0.7. For the older age group, although differences between the AUHC bladder wall contour data CPE value (CPE, 0.8057; 95% CI 0.7175–0.8939), and the AUHC solid whole bladder data CPE value (CPE, 0.7995; 95% CI 0.7093–0.8897) were minor, the models using bladder wall contour data were consistently greater than models using solid whole bladder data.
Figure 3 shows the relationship between different AUHC groups, different age groups, and late grade GU toxicity rates. Larger AUHCs are associated with greater toxicity rates among both age groups. The group experiencing the greatest toxicity rate was patients older than 68 years of age with the largest AUHC (ie, the oldest patients receiving the most radiation).
Fig. 3.
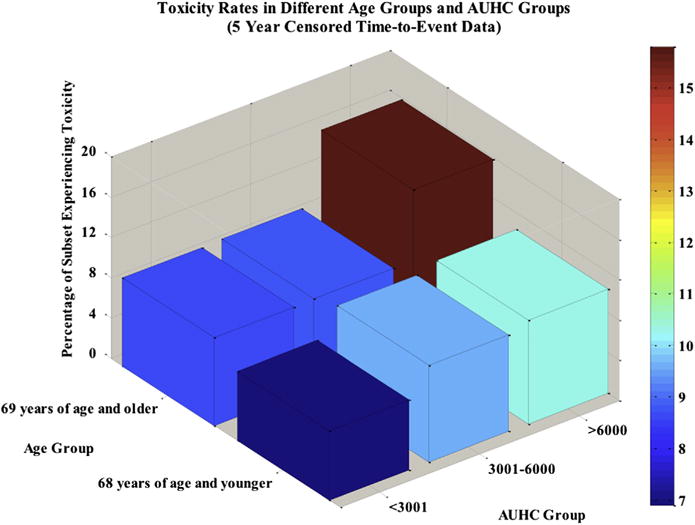
Percentage of patients experiencing toxicity increases with wall area under the histogram curve (AUHC) within each age group. The group experiencing the greatest rates of toxicity was patients older than 68 years of age with an AUHC above 6000. The group experiencing the lowest rates of toxicity was patients 68 years of age and younger with an AUHC less than or equal to 3000.
Figure 4 illustrates the dependence of GU toxicity on time. Latency is a very important issue to consider when studying late GU toxicity. The present study examined late grade ≥2 toxicity. For many patients, GU disease processes may demonstrate a very long latent period before clinical manifestations develop. Approximately 27% of patients who would ultimately experience late GU toxicity did so within 1 year of RT. A 2-year period captured approximately 41% of patients, and a 5-year period captured 73% of the patients. All of the patients who experienced GU toxicity did so within 10.2 years (122 months).
Fig. 4.
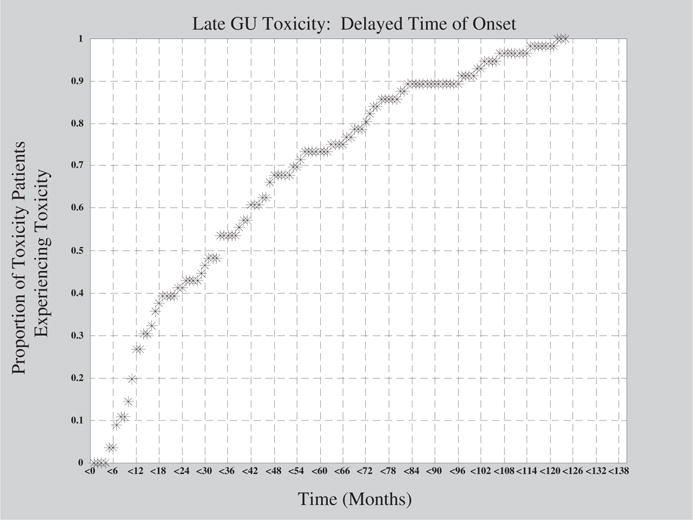
Late genitourinary (GU) toxicity as a function of time.
Discussion
In this study, we compared the ability of bladder dosimetry to predict for late grade ≥2 GU toxicity when contouring the entire bladder and its contents versus the bladder wall alone. There are 4 notable findings. First, the results demonstrate that using the bladder wall contouring method is superior to contouring the entire bladder and contents. Second, the AUHC method is promising and warrants further investigation and confirmatory studies. Third, patient age was a predictor of late grade ≥2 GU toxicity. Fourth, adequate follow-up is critical to judge the dosimetry effects of IMRT on GU toxicity.
Our results show that contouring the bladder wall is superior to contouring the bladder and its entire contents. When considering the vast majority of the volume is composed of urine with the later method, this result is not surprising. Dose to the urine should not confer toxicity. Additionally, accounting for the urine dilutes the dose–volume effects of the bladder wall. The bladder wall can be difficult to define with computed tomography. In this study, delineation depended on bladder contents. The bladder wall thickness was inversely proportional to the total bladder volume and ranged from 3 mm to 5 mm. Confirmatory studies are needed.
The AUHC for DVHs and DWHs offers a new method to analyze dosage volume data. This method was explored because conventional methods based on selected points along the curve have been incongruent. Future studies should make use of AUHC data in addition to individual dosage volume point records.
In general, the long-term prognosis of prostate cancer patients who have received RT is good, and thus the prediction of chronic late GU toxicity in individual patients is important in terms of optimizing quality of life (20). Figure 2 shows toxicity rates in different age groups. Based on the unadjusted analysis presented in Figure 2, for the group of patients older than 68 years of age, toxicity rates increase much more rapidly with age than in patients 68 years of age and younger. Figure 5 shows similar results in the subgroup of patients with a follow-up time of 7 years or more. These data suggest that older patients may be considered a unique subset of patients by both clinicians and researchers. The strongest treatment parameters may have greater influences on the older population than on the younger population. Identifying these parameters will decrease the incidence of late GU toxicity in older patients and may shed light on which factors should be given more focus in the younger population. Future studies should make note of differences in age among patient groups when analyzing data.
The effects of follow-up are shown in Figure 4. In particular, it is shown that only 40% of the patients who ultimately experienced late grade ≥2 GU toxicity experienced toxicity within 2 years of RT. Studies with a mean follow-up time of 2 years will not identify patients who experience toxicity beyond this time point. To draw accurate conclusions and guidelines for practitioners, investigators should aim for an average follow-up time of at least 5 years. Additionally, patients lost to follow-up present a problem for analysis by creating the potential for selection bias. If a substantial number of study participants are lost to follow-up in exposed or unexposed groups, it is possible that the lost individuals differ from the remaining individuals in their risk for experiencing the outcome. Such loss may result in either overestimation or underestimation of the association between the exposure and the disease. To minimize these effects, studies should censor for follow-up time in statistical analysis and attempt to increase average follow-up time for their cohort.
Fig. 5.
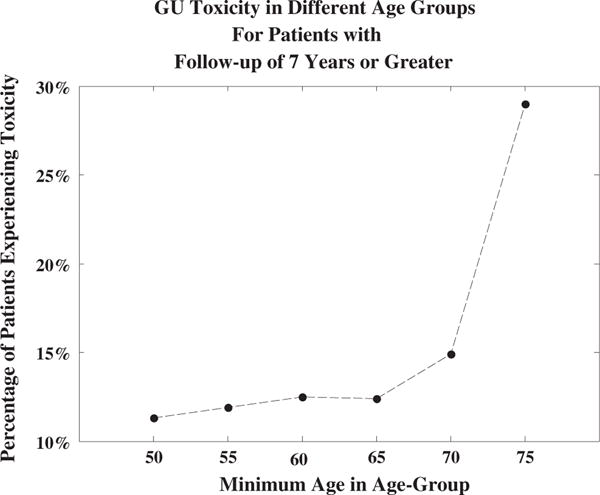
Rates of grade ≥2 genitourinary (GU) toxicity in different age groups and long-term follow-up.
Although acute toxicity data were available, the effects of acute grade toxicity in prediction of late grade toxicity were not examined in any of the present statistical tests. Acute grade toxicity occurs immediately (≤3 months) after RT. Many studies use acute grade toxicity to model late grade toxicity or obtain associations with late grade toxicity. This can be misrepresentative, for acute grade toxicity is an after-therapy event, and analysis of these data is therefore unlikely to generate any preventable findings. Furthermore, in view of its strong correlation with late grade toxicity, analysis of acute grade toxicity may unreliably confound before-therapy parameters. Late grade 1 GU toxicity was not examined, given its minimal effect on quality of life.
Conclusion
In this study of over 500 patients with a median follow-up time of nearly 6 years, the area under the DVH (AUHC) method based on bladder wall volumes is a promising alternative method for predicting late GU toxicity. Age >68 years was independently associated with late grade ≥2 GU toxicity, which suggests that risk-adapted dose constraints based on age should be explored. Future studies should seek to identify a simplified scoring algorithm for clinicians to estimate the probability of GU toxicity in elderly men to better weigh the risks of treatment. For example, the AUHC in conjunction with known risk factors, such as the American Urological Association Prostate symptom score, can be further developed to aid physicians in estimating risk of GU toxicity.
Summary.
In this study of over 500 patients with a median follow-up time of nearly 6 years, the area under the dose–volume histogram curve method based on bladder wall volumes was superior for predicting late genitourinary toxicity. Age >68 years was independently associated with late grade ≥2 genitourinary toxicity, which suggests that risk-adapted dose constraints based on age should be explored.
Acknowledgments
The authors thank Dr. Gerald Hanks for his leadership in the establishment of the Fox Chase Cancer Center database for the treatment of prostate cancer reported herein and Ruth Peter and Teri Marino-White for their dedication to its maintenance.
Supported by grant number P30 CA006927 from the National Cancer Institute, National Institutes of Health. This article is solely the responsibility of its authors and does not necessarily represent the official views of the National Cancer Institute or the National Institutes of Health.
Footnotes
Conflict of interest: none.
Supplementary material for this article can be found at www.redjournal.org.
References
- 1.Eade TN, Hanlon AL, Horwitz EM, et al. What dose of external-beam radiation is high enough for prostate cancer? Int J Radiat Oncol Biol Phys. 2007;68:682–689. doi: 10.1016/j.ijrobp.2007.01.008. [DOI] [PMC free article] [PubMed] [Google Scholar]
- 2.Kuban DA, Tucker SL, Dong L, et al. Long-term results of the M. D. Anderson randomized dose-escalation trial for prostate cancer. Int J Radiat Oncol Biol Phys. 2008;70:67–74. doi: 10.1016/j.ijrobp.2007.06.054. [DOI] [PubMed] [Google Scholar]
- 3.Spratt DE, Pei X, Yamada J, et al. Long-term survival and toxicity in patients treated with high-dose intensity modulated radiation therapy for localized prostate cancer. Int J Radiat Oncol Biol Phys. 2013;85:686–692. doi: 10.1016/j.ijrobp.2012.05.023. [DOI] [PMC free article] [PubMed] [Google Scholar]
- 4.Corletto D, Iori M, Paiusco M, et al. Inverse and forward optimization of one- and two-dimensional intensity-modulated radiation therapy-based treatment of concave-shaped planning target volumes: the case of prostate cancer. Radither Oncol. 2003;66:185–195. doi: 10.1016/s0167-8140(02)00375-4. [DOI] [PubMed] [Google Scholar]
- 5.Fiorino C, Broggi S, Corletto D, et al. Conformal irradiation of concave-shaped PTVs in the treatment of prostate cancer by simple 1D intensity-modulated beams. Radither Oncol. 2000;55:49–58. doi: 10.1016/s0167-8140(00)00140-7. [DOI] [PubMed] [Google Scholar]
- 6.Zelefsky MJ, Fuks Z, Happersett L, et al. Clinical experience with intensity modulated radiation therapy (IMRT) in prostate cancer. Radither Oncol. 2000;55:241–249. doi: 10.1016/s0167-8140(99)00100-0. [DOI] [PubMed] [Google Scholar]
- 7.Sharma NK, Li T, Chen DY, et al. Intensity-modulated radiotherapy reduces gastrointestinal toxicity in patients treated with androgen deprivation therapy for prostate cancer. Int J Radiat Oncol Biol Phys. 2011;80:437–444. doi: 10.1016/j.ijrobp.2010.02.040. [DOI] [PubMed] [Google Scholar]
- 8.Huang EH, Pollack A, Levy L, et al. Late rectal toxicity: Dose-volume effects of conformal radiotherapy for prostate cancer. Int J Radiat Oncol Biol Phys. 2002;54:1314–1321. doi: 10.1016/s0360-3016(02)03742-2. [DOI] [PubMed] [Google Scholar]
- 9.Lebesque JV, Bruce AM, Kroes AP, et al. Variation in volumes, dose-volume histograms, and estimated normal tissue complication probabilities of rectum and bladder during conformal radiotherapy of T3 prostate cancer. Int J Radiat Oncol Biol Phys. 1995;33:1109–1119. doi: 10.1016/0360-3016(95)00253-7. [DOI] [PubMed] [Google Scholar]
- 10.De Meerleer G, Vakaet L, Meersschout S, et al. Intensity-modulated radiotherapy as primary treatment for prostate cancer: Acute toxicity in 114 patients. Int J Radiat Oncol Biol Phys. 2004;60:777–787. doi: 10.1016/j.ijrobp.2004.04.017. [DOI] [PubMed] [Google Scholar]
- 11.Jereczek-Fossa BA, Zerini D, Fodor C, et al. Correlation between acute and late toxicity in 973 prostate cancer patients treated with three-dimensional conformal external beam radiotherapy. Int J Radiat Oncol Biol Phys. 2010;78:26–34. doi: 10.1016/j.ijrobp.2009.07.1742. [DOI] [PubMed] [Google Scholar]
- 12.Michalski JM, Bae K, Roach M, et al. Long-term toxicity following 3D conformal radiation therapy for prostate cancer from the RTOG 9406 phase I/II dose escalation study. Int J Radiat Oncol Biol Phys. 2010;76:14–22. doi: 10.1016/j.ijrobp.2009.01.062. [DOI] [PMC free article] [PubMed] [Google Scholar]
- 13.Boersma LJ, van den Brink M, Bruce AM, et al. Estimation of the incidence of late bladder and rectum complications after high-dose (70–78 gy) conformal radiotherapy for prostate cancer, using dose-volume histograms. Int J Radiat Oncol Biol Phys. 1998;41:83–92. doi: 10.1016/s0360-3016(98)00037-6. [DOI] [PubMed] [Google Scholar]
- 14.Harsolia A, Vargas C, Yan D, et al. Predictors for chronic urinary toxicity after the treatment of prostate cancer with adaptive three-dimensional conformal radiotherapy: Dose-volume analysis of a phase II dose escalation study. Int J Radiat Oncol Biol Phys. 2007;69:1100–1109. doi: 10.1016/j.ijrobp.2007.04.076. [DOI] [PubMed] [Google Scholar]
- 15.Horwitz EM, Hanlon AL, Pinover WH, et al. Defining the optimal radiation dose with three dimensional conformal radiation therapy for patients with nonmetastatic prostate carcinoma by using recursive partitioning techniques. Cancer. 2001;92:1281–1287. doi: 10.1002/1097-0142(20010901)92:5<1281::aid-cncr1449>3.0.co;2-9. [DOI] [PubMed] [Google Scholar]
- 16.Cox JD, Stetz J, Pajak TF. Toxicity criteria of the Radiation Therapy Oncology Group (RTOG) and the European Organization for Research and Treatment Of Cancer (EORTC) Int J Radiat Oncol Biol Phys. 1995;31:1341–1346. doi: 10.1016/0360-3016(95)00060-C. [DOI] [PubMed] [Google Scholar]
- 17.Storey MR, Pollack A, Zagars G, et al. Complications from radiotherapy dose escalation in prostate cancer: Preliminary results of a randomized trial. Int J Radiat Oncol Biol Phys. 2000;48:635–642. doi: 10.1016/s0360-3016(00)00700-8. [DOI] [PubMed] [Google Scholar]
- 18.Moler C. Numerical computing with matlab. Philadelphia: Society for Industrial and Applied Mathematics; 2004. [Google Scholar]
- 19.Gönen M, Heller G. Concordance probability and discriminatory power in proportional hazards regression. Biometrika. 2005;92:965–970. [Google Scholar]
- 20.Valdagni R, Rancati T, Fiorino C. Predictive models of toxicity with external radiotherapy for prostate cancer: Clinical issues. Cancer. 2009;115:3141–3149. doi: 10.1002/cncr.24356. [DOI] [PubMed] [Google Scholar]


