Abstract
Biophysical studies have been carried out on a family of asymmetric guanidinium-based diaromatic derivatives to assess their potential as DNA minor groove binding agents. To experimentally assess the binding of these compounds to DNA, solution phase biophysical studies have been performed. Thus, surface plasmon resonance, UV-visible spectroscopy and circular and linear dichroism have been utilized to evaluate binding constants, stoichiometry and mode of binding. In addition, the thermodynamics of the binding process have been determined by using isothermal titration calorimetry. These results show significant DNA binding affinity that correlates with the expected 1 : 1 binding ratio usually observed for minor groove binders. Moreover, a simple computational approach has been devised to assess the potential as DNA binders of this family of compounds.
Introduction
The inhibition of gene expression by small molecules has been an active field of research for over three decades.1,2 Thus, small molecules capable of targeting DNA have been pursued for their potential therapeutic use in the treatment of several diseases such as cancer, parasitic diseases or viral infections.1,3,4 It is widely accepted that small planar molecules with a crescent shape can bind to the DNA minor groove by means of van der Waals contacts, hydrogen bonds and ionic interactions. Naturally occurring netropsin and distamycin and the synthetic derivative furamidine are good examples of these minor groove binders that, showing AT-sequence selectivity, can act as drugs by their targeting to DNA.1,2,5–7
Bis-amidine type minor groove binders are known to show antimicrobial and antiparasitic activities.8 For example, a prodrug of furamidine (Fig. 1),9 is currently in phase III against human African trypanosiomiasis (HAT) and P. jiroveci, and findings by our group have shown that bis-guanidine-like derivatives (especially bis-(2-aminoimidazoline) diphenyl compounds) displayed potent antitrypanosomal activity in vitro and in vivo against T. b. rhodesiense, the causative agent of acute HAT.10,11 In addition, pentamidine and bis-amidine derivatives of bis-benzimidazole analogues have found application as antibacterials/antimicrobials in the treatment of Pneumocystis carinii pneumonia12 or as anti-MRSA and anti-VRE agents.13
Fig. 1.

Furamidine and asymmetric guanidine/2-aminoimidazolinium derivatives previously prepared in our group.
We have recently reported the preparation of a series of asymmetric diaromatic guanidinium/2-aminoimidazolinium derivatives (1 to 8 in Fig. 1), which show some structural similarities with furamidine (Fig. 1).14 By varying the functional group connecting the two aromatic moieties (X in Fig. 1) it was possible to investigate the influence of the structural changes on the ability to form optimum hydrogen bonds between the cationic functional groups and the DNA bases. In addition, the influence of the cations on minor groove binding was also analysed by considering both guanidinium and 2-aminoimidazolinium groups. In this previous study, we evaluated the affinity of these compounds for DNA by means of DNA denaturation experiments with both random sequence (42% CG) DNA (salmon sperm) and AT specific polynucleotides [poly(dA·dT)2 and poly(dA)·(dT)] which are known to possess a narrower minor groove.14 In general, the increments in DNA denaturation temperature (ΔTm) obtained indicated strong binding to DNA, especially for those compounds with a NH or a CO groups linking the phenyl rings (compounds 5 and 7 respectively). However, other aspects of these interactions such as binding constants, mode of binding or thermodynamics of the process remained to be explored. Thus, in this article we present the results obtained from a range of biophysical techniques such as biosensor-surface plasmon resonance (SPR), UV spectroscopy and circular dichroism (CD) to investigate the binding strength, isothermal calorimetry (ITC) to deduce the thermodynamic parameters and linear dichroism (LD) to confirm the mode of binding. In addition, a simple ligand-based computational approach to predict the binding of these molecules is presented.
Results and Discussion
Surface Plasmon Resonance (SPR)
SPR has become an excellent method to quantitatively assess the real-time binding of small molecules to macromolecules such as DNA or specific oligonucleotides providing accurate binding constants. In the present study, the hairpins shown in Scheme 1 have been used to determine the binding.
Scheme 1.

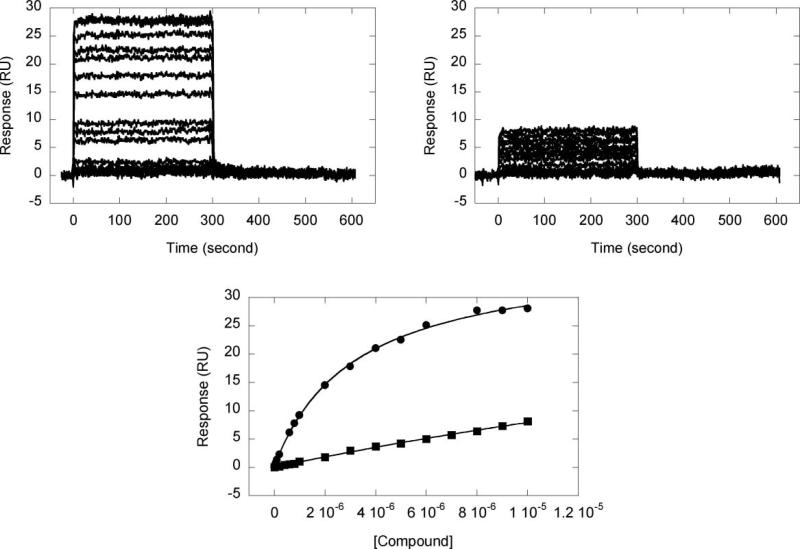
Representative sensorgrams for strong (5) and weak (1) binding compounds to the AATT hairpin are shown in Fig. 2 on the same scale together with their fits. The sensorgrams of 5 and 1 in Fig. 2 (upper) show rapid kinetics of association and dissociation from low to high concentrations. This indicates that the compounds can enter and exit the minor groove with a relatively low energy barrier.
Fig. 2.
Sensorgrams for the interaction of 5 (upper left) and 1 (upper right) with the AATT hairpin, and in the bottom the fits of 5 (circles) and 1 (squares).
Since the compounds have similar molecular weights, they should give the same response (RU) for similar binding at the same concentration. However, the sensorgram obtained for compound 1 (Fig. 2, upper right) shows very small increments indicating poor binding. The constants for binding of all compounds (1 to 8) to the three DNA hairpin duplexes in Scheme 1 were determined by plotting the steady-state response values versus the concentration of the free compounds and fitting as described in the Experimental section. The results obtained are presented in Table 1.
Table 1.
Binding constants (M−1) obtained from SPR experiments for all compounds and AATT, TTAA and CG hairpins. The corresponding ΔTm (°C) values in poly(dA)·poly(dT)14 are shown for comparison
| Compd. | X | ΔTm (°C)a poly(dA)·poly(dT) | Kaatt ×105 (M−1) | Kttaa ×105 (M−1) | Kcg ×105 (M−1) |
|---|---|---|---|---|---|
| 1 | CH2 | 17.2 | 0.49 | 0.50 | ≪1 |
| 2 | CH2CH2 | 29.0 | 2.90 | 0.75 | ≪1 |
| 3 | O | 25.3 | 4.70 | 0.67 | ≪1 |
| 4 | S | 23.0 | 1.20 | 2.40 | 1.80 |
| 5 | NH | 35.1 | 6.40 | 2.40 | ≪1 |
| 6 | Piperazine | 31.1 | 2.00 | 0.80 | ≪1 |
| 7 | CO | 32.0 | 2.70 | 4.60 | 3.60 |
| 8 | NHCONH | 30.0 | 1.30 | 0.65 | ≪1 |
Bp/D = 3. Poly(dA)·poly(dT) melting temperature in MES buffer (10 mM) is 43 °C without added NaCl. The binding constants are the primary binding constants (K1) and were collected with 92 mM NaCl.
In general, larger binding constant values are obtained in the interactions with AATT than with TTAA. Exceptions are compound 1 with similar small values (indicating poor binding in both cases), and compounds 4 and 7 with TTAA binding constant values double than the corresponding AATT ones (still small values indicative of relatively weak interactions). The compound with stronger binding to AATT is 5 (with the NH linker) with a 3-fold AATT/TTAA selectivity. The compound with the largest selectivity for AATT oligonucleotide is compound 3 (X = O) with a 7-fold ratio and good binding. Compounds 2 (X = CH2CH2) and 6 (X = piperazine) even though showing a medium binding strength exhibit a good 4- and 3-fold selectivity for AATT.
The SPR and ΔTm values were obtained at different salt concentrations (92 and 0 mM NaCl, respectively) but qualitative comparison of these binding constants with the ΔTm values previously reported by us using poly(dA)·poly(dT) (Table 1)14 shows that similar trends are observed, the best agreement found between ΔTm and the AATT binding constants.
Next, to assess the selectivity of these compounds for AT sequences and, therefore, for the minor groove, SPR experiments with a CG oligonucleotide were performed. Interestingly, most of the compounds show very poor binding constants with the CG oligonucleotides indicating preference for AT sequences and therefore for the minor groove, as with furamidine (Fig. 1). However, compounds 7 (X = CO) and 4 (X = S) exhibited unexpected affinity for the CG oligonucleotide (Table 1). SPR experiments with compound 4 do not show any strong binding to unspecific or AT type DNA and thus these SPR results seems to confirm that this compound is unspecific binding to DNA. However, compound 7 shows a larger K value for CG than for AATT and lower than for TTAA. This is a surprising result since structurally, compound 7, seems to be a minor groove binder and it is generally assumed that a good interaction with CG sequences is characteristic of intercalators.
The interesting SPR results obtained for derivatives 5 (strongest binder) and 7 (CG binding preference) indicate that the DNA binding of these two compounds (mode, strength, thermodynamic parameters) deserves further investigation. Moreover, considering that the UV spectra of these compounds (5, λmax = 296 nm; ε = 25,640 M−1cm−1 and 7, λmax = 294 nm; ε = 17,170 M−1cm−1), shows that they are the only two molecules possessing absorption bands outside the spectral range of DNA λmax = 260 nm, a deeper analysis into their DNA binding can be performed with those techniques based on UV detection, such as UV titrations.
UV-Visible Spectroscopy
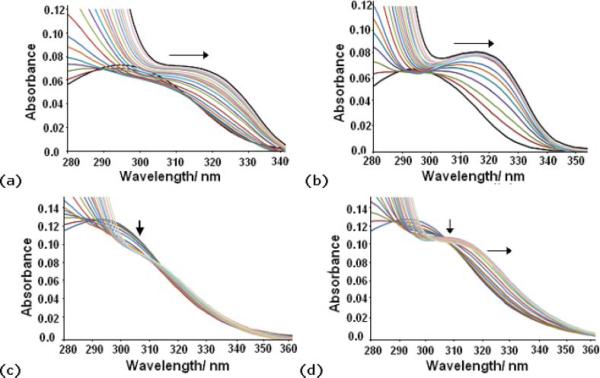
UV titrations with natural DNA and poly(dA·dT)2 were carried out for compounds 5 and 7 by adding increasing aliquots of DNA [salmon sperm or poly(dA·dT)2] solutions to a fixed concentration (1.6 μM) of each compound. Thus, aliquots of a 2 mM natural DNA solution were added to the solution of compound 5 and a small hypochromic effect was observed indicating the disappearance of the free molecule. That was accompanied by a bathochromic shift showing the formation of a new DNA-ligand species (Fig. 3a). To assess the sequence selectivity of this compound, the experiment was repeated with poly(dA-dT)2 (Fig. 3b). A large bathochromic shift was observed along with the formation of a new band at 323 nm indicating the formation of the new DNA-5 complex. This new band is better defined than in the titration with natural DNA consistent with 5 displaying a higher affinity for the poly(dA-dT)2 oligonucleotide.
Fig. 3.
UV titrations of compound 5 (X = NH,1.6 μM) with (a) (0–31.25 mM) salmon sperm DNA and with (b) (0–31.25 mM) poly(dA·dT)2 and of compound 7 (X = CO, 1.6 μM) with (c) (0–31.25 mM) salmon sperm DNA and (d) (0–31.25 mM) poly(dA·dT)2 working from a Bp/D 0–15.
Similarly, the corresponding absorption spectra obtained by adding aliquots of the natural DNA solution to compound 7 were recorded until saturation was observed (Fig. 3c). A small hypochromic effect and a slight bathochromic shift were observed both indicating the binding of this molecule to DNA. However, in comparison to the titration with 5, only small spectral changes were observed, reflecting the trend observed for the thermal denaturation assay results. Consequently, a binding constant could not be evaluated. To verify further that this molecule displays selectivity for AT sequences, the UV titration experiment was repeated with poly(dA-dT)2. A larger hypochromic effect accompanied of a bathochromic shift indicating the formation of the complex with DNA was observed. The fact that we found larger shifts in the presence of AT sequences is consistent with compound 7 also displaying preferential AT sequence binding.
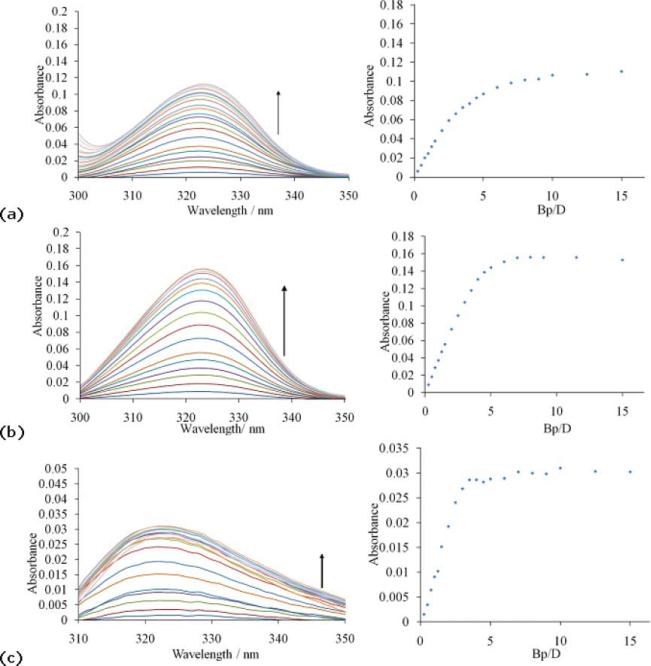
Since the changes in the spectra were not always readily discernable due to overlap with the intense DNA band at 260 nm, it was decided to subtract the spectrum of the molecule in the absence of DNA from all other spectra (Fig. 4). This allows the evolution of the spectrum of the DNA complexed molecule to be monitored. Thus, in the case of compound 5, upon addition of salmon sperm DNA to the compound solution, the bathochromic shift from 294 to 323 nm manifests as a growth in absorbance at 323 nm, the band characteristic of the bound species (Fig. 4a). Considering the increase in absorbance as a function of DNA concentration we observe an initial rise (Bp/D 0–5) followed by a more gradual growth to eventual saturation at Bp/D ≥ 15. Similarly, an increase in absorption is observed in the presence of increasing concentrations of poly(dA·dT)2 (Fig. 4b). However, in this case the binding profile is very different, resulting in a sharp change with saturation now occurring at the reduced Bp/D ratio of 5 and with a notable absence in the gradual increase at high Bp/D ratios. By comparing both UV titrations, a greater increase in the band was observed for the AT oligonucleotide than for the unspecific DNA indicating the preferred binding to the AT sequences.
Fig. 4.
Subtraction plots of the UV titration of 1.6 μM compound 5 (X = NH) with (0–31.25 mM) salmon sperm DNA [(a) left] and with (0–31.25 mM) poly(dA·dT)2 [(b) left] and of 1.6 μM compound 7 (X = CO) with (0–31.25 mM) poly(dA·dT)2 [(c) left]. The corresponding saturation curves are shown on the right.
With compound 7 (X = CO), upon addition of poly(dA·dT)2 to the compound solution, an increase in the absorbance was also observed at 325 nm (Fig. 4c), indicating binding to AT sequences. The binding is also characterized by very rapid increases in the absorption between Bp/D = 0–4, and saturation occurs around Bp/D = 10, which is slightly lower than that observed for compound 5.
From these titrations it was possible to calculate, through Scatchard plot analysis, the corresponding binding constants of compounds 5 and 7 to unspecific DNA and poly(dA·dT)2 and the results are presented in Table 2. The binding constants obtained for compound 5 in poly(dA·dT)2 indicate a stronger binding affinity for AT polynucleotide than the mixed sequence salmon sperm DNA. This is a common feature in minor groove binders because they generally require sequences of four to five AT bases to strongly bind to DNA.
Table 2.
Binding constants (×105,M−1) calculated using Scatchard plot analysis from the UV titrations, CD and ITC experiments performed with compounds 5 and 7 with both natural DNA and poly(dA·dT)2, using phosphate buffer. The corresponding binding constants (×105,M−1) obtained with SPR in the AATT hairpin are also included for comparison
| AATT |
Natural DNA |
poly(dA·dT)2 |
||||
|---|---|---|---|---|---|---|
| SPR | UV-titrat. | ITC | UV-titrat. | CD | ITC | |
| 5 | 6.4 | 0.3 ±0.1 | 0.3 ±0.1 | 2.5 ±0.3 | 1.2 ±0.7 | 0.6 ±0.1 |
| 7 | 2.7 | – | 0.9 ±0.3 | 0.6 ±0.1 | 0.3 ±0.1 | 0.6 ±0.1 |
Flow Linear Dichroism
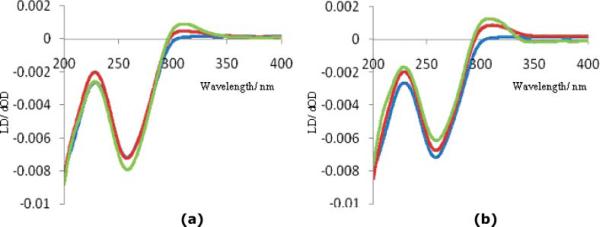
Once the strength of binding of these molecules to DNA was established, the next question to address is the mode of binding. Flow Linear Dichroism (LD) spectroscopy is defined as the difference in absorbance of linearly polarized light parallel and perpendicular to a macroscopic orientation axis.15 In this study, we used as orientation axis that of DNA in order to probe the mode of binding. Thus, LD spectra for compounds 5 and 7 were monitored at increasing compound to DNA ratio (see Fig. 5).
Fig. 5.
LD spectra recorded for DNA titrated with compounds 5 (a) and 7 (b) in 10 μM phosphate buffer at 25 °C. Titrations were carried out with a DNA (blue line) concentration of 378.8 μM working with a Bp/D ratio of 0, 1 and 5; varying the Bp/D ratio from 5 to 1 over 2 additions.
For both compounds a notable increase in the absorbance was observed at 310 nm where the DNA does not absorb. Positive induced signals are indicative of minor groove binding and, hence, LD results with unspecific DNA indicate that the asymmetric compounds 5 and 7 with a NH or a CO group as a linker respectively, are found to bind in the minor groove.
Circular Dichroism
Given the demonstrated affinity of these molecules for AT DNA sequences, indicated by previous thermal denaturation experiments,14 SPR and UV titration studies, circular dichroism (CD) experiments were carried out. CD experiments have proved useful to determine binding constants and can provide information on conformational changes in the polynucleotide as well as offer an indication on the mode of binding.16 In particular, minor groove binders, due to their close proximity to chiral sugar molecules, typically exhibit strong positive induced signals.17
All the asymmetric dications studied here are achiral with no inherent CD signals; however, in the presence of DNA they may show an induced signal. Thus, CD titrations were performed, not only for compounds 5 and 7, but also for the other asymmetric derivatives by increasing the compound to DNA Bp/D ratio from 22.4 to 0.56. Compounds 3 and 4 exhibited only weak induced CD signals and were not further analysed, but those compounds with the strongest (5 > 2 > 7 = 6 > 8) and the weakest (1) interactions with poly(dA·dT)2 according to thermal denaturation experiments14 exhibited induced signals. For the sake of clarity, we will discuss here only the results obtained for compounds 5 and 7 (Fig. 6) and those obtained for the rest of the compounds can be found in the ESI‡.
Fig. 6.
CD spectra obtained for compounds 5 (left, NH), 7 (right, CO) titrated with poly(dA·dT)2 in a concentration of 37.5 μM varying the Bp/D ratio from 44.8 to 1.12 through ten additions.
Interpretation of CD spectra in the region of DNA absorbance is difficult due to contributions arising from both changes in DNA conformation due to accommodating the ligand and changes in transitions of the ligand due to the new environment. For this reason we have focussed on the region of the spectrum >260 nm. In the particular cases shown in Fig. 5, the maximum absorption occurred at around 320 nm for compounds 5 and 7. In all CD spectra registered, the longest wavelength band is always positive. Upon increasing addition of compounds 5 and 7 to DNA a growth in the band at 320 nm is observed corresponding to λmax.
The magnitude of the induced signal is related to the chiral environment and, thus, intercalators, which interact far from the chiral sugar backbone, may have a low signal yet bind very tightly. However, molecules interacting in the minor groove will induce a greater change in the signal, even if they actually may have a weaker affinity. Taking this into account, it can be observed that, in the cases studied, the strength of binding to the AT oligonucleotide, as calculated in the thermal denaturation experiments with poly(dA·dT)2,14 is related to the amount of incremental growth in the induced CD signal and thus, compound 5 which is the strongest binder to DNA, according to the ΔTm values, shows the largest increment. The binding constants were calculated by Scatchard plot analysis,16b and the results are shown in Table 2.
Isothermal Titration Calorimetry (ITC)
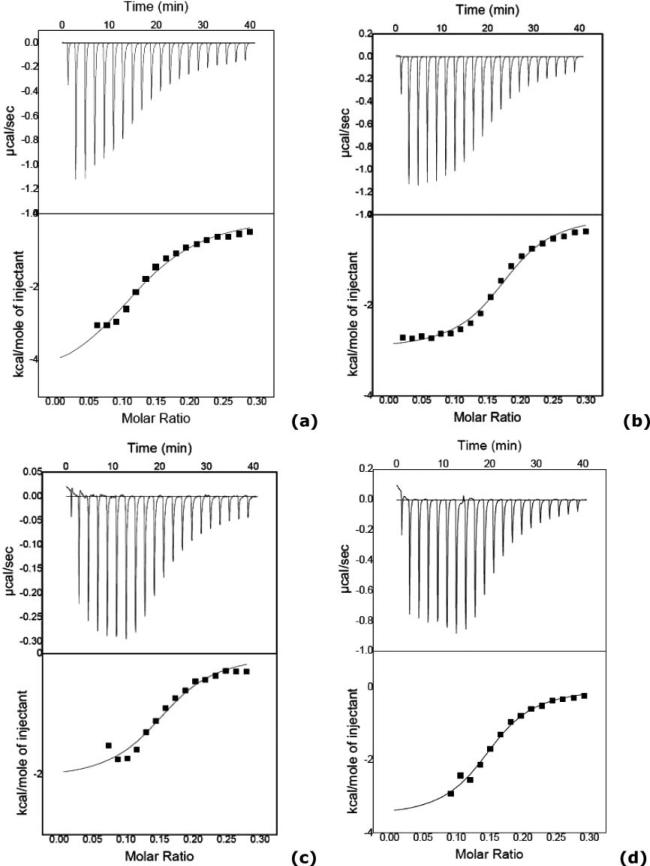
Isothermal titrations allow direct observation of binding enthalpy (ΔH°) and derivation of entropy and Ka (association constant) from curve fitting and the free energy relationship, ΔG° = ΔH° – TΔS°. The thermodynamics of binding to DNA for compounds 5 and 7 were evaluated both in salmon sperm DNA and in poly(dA·dT)2 (Tables 2 and 3).
Table 3.
Thermodynamic parameters and binding stoichiometry calculated for compounds 5 and 7 (X = NH and CO, respectively) by ITC with salmon sperm DNA and poly(dA·dT)2 (phosphate buffer)
| Binding stoi-chiometry | ΔH° (kcalmol−1) | ΔS° (calmol−1 K−1) | ||
|---|---|---|---|---|
| DNA | 5 | 0.15 ±0.01 | -3.7 ±0.3 | 8 |
| 7 | 0.16 ±0.01 | -2.1 ±0.2 | 16 | |
| poly(dA·dT)2 | 5 | 0.18 ±0.01 | -3.0 ±0.1 | 12 |
| 7 | 0.15 ±0.01 | -3.6 ±0.2 | 10 |
In all the cases negative ΔH° values and positive ΔS° values were obtained, indicating that the binding of both derivatives to DNA involves favourable enthalpic and entropic contributions (Table 3). The ITC curves for binding of compound 5 and 7 to DNA and the corresponding molar ratio plots are shown in Fig. 7. These plots represent heat evolved versus molar ratio for injecting each asymmetric derivative into a DNA solution on phosphate buffer and subtracting the heat dilution for each compound. These ITC data were fit according to a standard model that assumes a single set of equivalent binding sites.
Fig. 7.
ITC results obtained for the asymmetric compound 5 (X = NH, upper) in (a) salmon sperm DNA and (b) poly(dA·dT)2 and compound 7 (X = CO, bottom) in (c) salmon sperm DNA and (d) poly(dA·dT)2. These plots show corrected experimental data and the experiments were done in phosphate buffer at 25 °C.
The binding constant calculated for compound 5 in poly(dA·dT)2 is larger than that calculated for the binding to natural DNA indicating, as observed with other experiments, a preference of this compound for a narrower groove (Table 2). On the contrary, the binding constant obtained for compound 7 in natural DNA is slightly larger than that obtained with AT DNA (Table 2). Similar binding constants are obtained for the two compounds when binding AT DNA but when binding to salmon sperm DNA it can be seen that the binding of compound 5 is weaker than that of 7 (Table 2). However, in the SPR, UV-titrations and CD studies with AATT or poly(dA·dT)2 compound 5 always showed a stronger binding than compound 7 (Table 2), this indicates that compound 7 binds stronger to mixed CG–AT sequences than to AT ones alone, in agreement with the binding to CG hairpins observed in SPR experiments. This stronger binding of 7 to natural DNA seems to come mostly from the entropic term (see Table 3) which is double that for the binding of compound 5.
Computational approach
Considering all the experimental DNA binding data obtained, we have attempted to develop a simple computational ligand-based approach that would allow to predict the binding of these molecules to DNA. It is well known that ΔTm can be used as an indicator of the affinity between ligands and DNA. Thus, if we were able to correlate ligand parameters depending on its binding to the minor groove with this ΔTm we could estimate the affinity of future compounds of this series.
The co-crystal structure of a related symmetric aromatic bis-2-aminoimidazolinium18 within the DNA minor groove has been recently determined by Glass et al.19 They suggested that the interaction of this compound with DNA induces a conformational change in the ligand, which when bound in the DNA groove is much less twisted than when isolated. Thus, we have calculated the difference in energy between the optimized conformationally-free molecules (twisted) and the conformationally-restricted ones (closer to planarity, as in the co-crystal structure) for compounds 1 to 8, i.e. their conformational penalty of binding (ΔEconf.-penalty in Table 4). An example of the restricted and free conformations determined for compound 5 is shown in Fig. 8.
Table 4.
Energy difference (ΔEconf-penalty, kcal mol−1) between the conformationally free and restricted conformers of compounds 1–8 calculated at B3LYP/6 – 31+G(d,p) level; ΔGK-AATT binding energies (kcal mol−1) calculated from the SPR binding constants KAATT; binding energies (kcal mol−1) obtained from the docking of these compounds in a DNA model using ArgusLab (GAD-E20) and AutoDock (AutoD-E21); experimental ΔTm (°C) values obtained for these compounds with poly(dA)·poly(dT) in MES buffer; and calculated ΔTm (°C) values with eqn (1), (2) and (3)
| ΔEconf.-penalty | Δ G K-AATT | GAD-E | AutoD-E | Exp. ΔTm | eqn(1) ΔTm | eqn(2) ΔTm | eqn(3) ΔTm | |
|---|---|---|---|---|---|---|---|---|
| 1 | –9.0 | –6.4 | –4.9 | –5.9 | 17.2 | 18.6 | 22.4 | 18.3 |
| 2 | –5.0 | –7.5 | –5.0 | –7.2 | 29.0 | 30.1 | 28.4 | 33.0 |
| 3 | –6.7 | –7.7 | –4.9 | –7.4 | 25.3 | 28.6 | 25.4 | 31.2 |
| 4 | –7.6 | –6.9 | –4.9 | –6.2 | 23.0 | 23.2 | 24.2 | 22.5 |
| 5 | –5.3 | –7.9 | –5.2 | –6.5 | 35.1 | 31.7 | 29.4 | 28.4 |
| 6 | –3.0 | –7.2 | –5.2 | –6.4 | 31.1 | 31.6 | 32.4 | 32.0 |
| 7 | –6.5 | –7.4 | –5.0 | –6.7 | 32.0 | 27.4 | 26.4 | 27.4 |
| 8 | –2.2 | –7.0 | –5.3 | –5.6 | 30.0 | 31.8 | 34.2 | 28.7 |
Fig. 8.
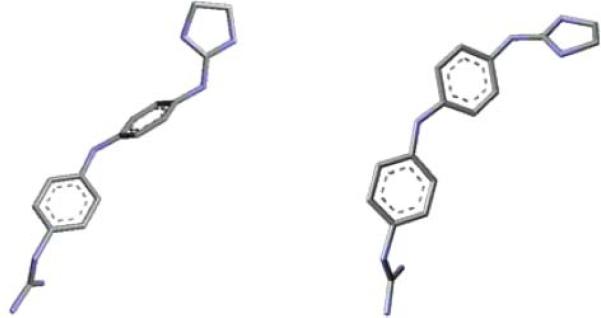
An example of the twisted (left) and planar (right) conformations calculated for compound 5 at B3LYP/6 – 31+G(d,p) level.
The binding of a ligand to DNA can be calculated from its experimental binding constant by using the formula: ΔG = –RTlnK. Considering that in the SPR experiments the best binding of these compounds was to the AATT hairpin, we have calculated ΔGK-AATT from those experimental KAATT values (Table 1) and the results are shown in Table 4. Hence, assuming that the ΔTm, is a function of both energetic contributions and using the experimentally measured ΔTm (Table 1), the conformational penalty calculated at DFT level (ΔEconf.-penalty) and the binding energy contribution (ΔGK-AATT), we found that
| (1) |
The lack of intercept indicates that when there is no binding (ΔGK-AATT = ΔEconf.-penalty = 0), there is no change in the DNA melting (ΔTm = 0). Using eqn (1), fitted ΔTm were calculated (see Table 4) showing very good agreement with the experimental values, i.e. small residuals.
However, for a quick assessment of the potential binding of new ligands from this series before synthesising them, a simpler theoretical approximation to the energy of binding should be made. Hence, we have performed very simple docking studies with the DNA template from the co-crystal recently published19 and the restricted planar ligand structures. The GADock algorithm implemented in the ArgusLab package was used in a rigid-rigid approach and the binding energy (GAD-E in Table 4) calculated using the scoring function “Ascore”.20 Then, this energy value and the conformational penalty were correlated to ΔTm (Table 1), finding the following correlation:
| (2) |
The fitted ΔTm values using eqn (2) are shown in Table 4. Other docking approaches were explored (see ESI‡), in particular a ligand-flexible docking was performed with AutoDock 4.2,21 and the binding scoring values obtained (AutoD-E, see Table 4) allowed the following correlation:
| (3) |
Even though, in both simple docking approaches the agreement with the experimental ΔTm values is worse than using eqn (1), it seems that a general trend can be obtained with very simple calculations such as those in the ArgusLab and AutoDock 4.2 packages.
Conclusions
In previous work, the synthesis and experimental ΔTm of a family of asymmetric guanidinium/2-aminoimidazolinium derivatives were reported showing that these compounds bind to DNA and some of them very strongly. Here, further SPR experiments have been performed on these molecules confirming their DNA binding. Following, the interesting results obtained for compounds 5 (X = NH) and 7 (X = CO), additional analysis of their interaction with both natural DNA and poly(dA-dT)2 have been carried out by means of UV-titrations, CD, LD and ITC. In all these experiments the results obtained confirm strong binding to both natural and AT DNA (constants of the order of 105, see Table 2). The thermodynamic parameters resulting from the ITC experiments (negative enthalpies and positive entropies, see Table 3) confirm this strong and favourable interaction.
Moreover, the positive CD signals upon binding to DNA are consistent with these compounds interacting in the minor groove. This point was fully confirmed by means of LD experiments, which unequivocally show minor groove binding by means of positive LD induced signals for the DNA complexes. All the experiments performed show a binding site at a Bp/D ratio of 4, indicating that only one molecule seems to interact in each minor groove.
The binding constants obtained for compound 5 (X = NH) and 7 (X = CO) with poly(dA·dT)2 by means of UV-titration, CD and ITC indicate that compound 5 interacts with poly(dA·dT)2 slightly stronger than compound 7. Compound 5 was also the strongest binder in the SPR experiments with the AATT oligomer site that is most closely related to the AT polymer. A preference for narrow grooves (AT sequences) is observed for compound 5 while compound 7 seems to bind preferentially to mixed CG–AT sequences.
According to SPR experiments, compound 7 has slightly higher binding affinities to TTAA or CG hairpins (wider minor grooves) than to AATT suggesting that this compound may prefer a wider minor groove width. The energetic cost to constrain this compound in a more planar conformation is generally high and this may affect the binding specificity. This result is surprising since, even though binding to CG DNA is generally associated with intercalation, this compound had shown a good affinity for the minor groove of DNA in all other experiments (especially LD). In principle, one could think that the C=O group could be conjugated to the phenyl rings and that this system might intercalate between DNA base pairs. However, the computational studies for this compound show that it is not planar and the energetic penalty to achieve planarity is similar to that of compound 5 (X = NH) which is a clear minor groove binder. Thus, this compound shows no special planarity that could account for an intercalator interaction. Moreover, specific UV-titration and LD experiments were carried out with compound 7 and poly(dC·dG)2 but no binding was observed, allowing the possibility of DNA intercalation to be discarded. It is well known that lexitropsins, which are compounds related to netropsin and also minor groove binders, exhibit a preference for CG base pairs. To explain this preference the formation of a hydrogen bond with the NH2 group of guanine, which protrudes into the minor groove, was suggested and later proved by means of DNA footprinting.22 Perhaps this interaction with the guanine NH2 group is also responsible for the CG affinity observed for the minor groove binder compound 7. Further studies are required to explain this unusual minor groove selectivity.
Experimental
Compounds, DNA and Buffers
All compounds were synthesised in our laboratory as previously described.14 Salmon sperm DNA and poly(dA·dT)2 were purchased from Sigma Aldrich. Phosphate buffer solutions contained 10 mM Na2HPO4/NaH2PO4 adjusted to pH 7 were prepared using Millipore water.
Biosensor–Surface Plasmon Resonance (SPR)
Biosensor–SPR experiments were conducted as previously described23 with a BIAcore 2000 instrument (Biacore AB) using degassed MES buffer (10 mM 2-(N-morpholino)ethanesulfonic acid, 1 mM EDTA, 92 mM NaCl, 0.0005%v/v of surfactant P20, pH 6.25) at 25 °C. The 5′-biotinlabeled DNA hairpins were purchased from Midland Certified Reagent Co., Inc. (Midland, TX), with HPLC purification. The DNA hairpin sequences included 5′biotin-CGAATTCGTCTCCGAATTCG-3′, 5′biotin-CGTTAACGTCTCCGTTAACG-3′, and 5′biotin-CGCGCGCGTTTTCGCGCGCG-3′, referred to in the text as AATT, TTAA, and CG respectively. The DNA hairpins were immobilized on a streptavidin-derivatized gold chip (SA chip from BIAcore) by manual injection of a 25 nM hairpin DNA solution with a flow rate of 1 μL min−1 until the response units (RUs) reach about 375–415. Flow cell 1 was left blank for reference subtraction while flow cells 2, 3, and 4 were immobilized with three different DNA hairpins. Typically, a series of different concentrations of ligand was injected onto the chip at 25 °C with a flow rate of 20 μL min−1 for a period of 5-minute followed by 5-minute dissociation. After the dissociation process, the chip surface was regenerated with a 20-μL injection of 200 mM NaCl and 10mM NaOH solution, injection tube rinsing, and multiple 1-minute buffer injections. The observed steady-state responses, RUobs, are proportional to the amount of ligand bound, and the maximum response per ligand bound (RUmax) was calculated as previously described.23 The binding constants were obtained from fitting RUobs vs. free ligand concentration using RUobs = RUmax(K1L+2 K1K2L2)/(1+K1L+K1K2L2); (L = ligand concentrations in the flow solution).
UV-Visible Spectroscopy
All UV-visible absorbance measurements were conducted on a Cary 300 UV spectrophotometer. A quartz cell with a 1 cm path length was used for all absorbance studies. Compound stock solutions were 6.67 μM and contained 10 mM sodium phosphate buffer (pH 7). The DNA at increasing ratios was then titrated into the compound solution and the corresponding absorption spectra were recorded under the same conditions. All concentrations were determined using the appropriate extinction coefficients. Subtraction plots of the UV titration of each compound with increasing aliquots of salmon sperm DNA or poly(dA·dT)2 were obtained.
Flow Linear Dichroism (LD)
LD spectra were collected with a JASCO J-810 spectrometer at different ratios of compound to salmon sperm DNA at 25 °C in 10 mM phosphate buffer. Each flow LD spectrum was acquired from 200 nm to 400 nm and reflects the average of two scans. A Couette flow cell was used for sample orientation for all LD studies. The DNA solutions were 189 μM with a compound to DNA base pair ratio of 2 to 10.
Circular Dichroism (CD)
CD spectra were collected with a JASCO J-800 spectrometer at different ratios of compound to [poly(dA·dT)2 was used] at 25 °C in 10 mM phosphate buffer. Titrations were carried out by addition of aliquots of 0.5 mM stock solutions of the relevant compound (at increasing ratios) to the buffered DNA concentration solution in a 1 cm quartz cuvette and scanned over a desired wavelength range.
Isothermal Titration Calorimetry (ITC)
ITC experiments were performed using a MicroCal VP-ITC instrument (MicroCal Inc., Northampton, MA) interfaced with a computer equipped with VP-2000 viewer instrument control software. ITC data were analysed with Origin 7.0 software. In ITC experiments, 1.5 μL of 2.48 mM compound solution in 10 mM phosphate buffer were injected every 300 s for a total of 29 injections into a solution of DNA in the calorimeter cell at 2 mM. The observed heat for each injection (peak) was measured by area integration of the power peak with respect to time. ITC data were fit according to a standard model that assumes a single set of equivalent binding sites.
Computational methods
Molecular structures were optimized with Density Functional Theory (DFT) as implemented in the Gaussian03 package24 at the B3LYP/6 – 31+G(d,p) level of computation, using the crystal structure of a known derivative25 as template for the starting conformation. Frequency calculations were performed to ensure all structures corresponded to energetic minima. Two calculations were carried out for each molecule: (i) an optimization without geometrical constraints and (ii) an optimization using the angle constraints shown by the ligand within the co-crystallized DNA complex published by Glass et al.19 as indicated in Fig. 9 for one of our compounds. The difference in energy between these two calculations (ΔEconf.-pen.), i.e. the energy difference between the unbound conformation (non-planar and calculated minimum energy conformer) and the bound one (constrained to planarity), represents the energetic penalty for assuming the bound conformation and can be considered as the ligand conformational penalty of binding.
Fig. 9.
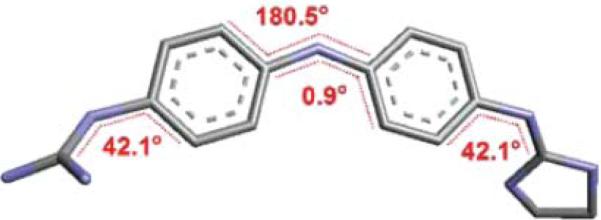
Dihedral constraints used in the optimization of our derivatives as per the crystal structure published by Glass et al.19
Utilizing the previously mentioned DNA-ligand co-crystal structure as a template, docking calculations were performed using the GAdock algorithm as implemented in ArgusLab20 (rigid–rigid) and AutoDock 4.221 (rigid–rigid & flexible–rigid). Docking procedures started from a rigid ligand in the bound conformation within the DNA co-crystal structure. Docking was run over 2000 generations to find the best pose. Taking into account that two possible induced-chirality structures exist, binding energies of both approximations were calculated and the average energy was used as the final result. The docking energy represents the approximate energy of binding.
Supplementary Material
Acknowledgements
This work has been funded by the SFI–RFP grant CHE275 and Trinity College Dublin postgraduate award (PSN), IRCSET postgraduate award (DHO'D), Consejería de Educación Cultura y Deporte de la Comunidad Autónoma de La Rioja, Spain (FR), and NIH AI 064200 (WDW). All calculations were performed on the IITAC cluster maintained by the Trinity Centre for High Performance Computing.
Footnotes
This paper is part of an Organic & Biomolecular Chemistry web theme issue on chemical biology.
Electronic supplementary information (ESI) available: Circular dichroism results for compounds 1, 2, 6 and 8, and comparative docking. See DOI: 10.1039/c0ob00428f
References
- 1.Neidle S. Nat. Prod. Rep. 2001;18:291–309. doi: 10.1039/a705982e. [DOI] [PubMed] [Google Scholar]
- 2.Bailly C, Chaires JB. Bioconjugate Chem. 1998;9:513–538. doi: 10.1021/bc980008m. [DOI] [PubMed] [Google Scholar]
- 3.Dervan PB. Bioorg. Med. Chem. 2001;9:2215–2235. doi: 10.1016/s0968-0896(01)00262-0. [DOI] [PubMed] [Google Scholar]
- 4.Hurley LH. Nat. Rev. Cancer. 2002;2:188–200. doi: 10.1038/nrc749. [DOI] [PubMed] [Google Scholar]
- 5.Finlay AC, Hochstein FA, Sobin BA, Murphy FX. J. Am. Chem. Soc. 1951;73:341–343. [Google Scholar]
- 6.Neidle S, Kelland LR, Trent JO, Simpson IJ, Boykin DW, Kumar A, Wilson WD. Bioorg. Med. Chem. Lett. 1997;7:1403–1408. [Google Scholar]
- 7.Francesconi I, Wilson WD, Tanious FA, Hall JE, Bender BC, Tidwell RR, McCurdy D, Boykin DW. J. Med. Chem. 1999;42:2260–2265. doi: 10.1021/jm990071c. [DOI] [PubMed] [Google Scholar]
- 8. Among others. [Google Scholar]; a Ashley JN, Barber HJ, Ewins AJ, Newbery G, Self ADH. J. Chem. Soc. 1942:103–116. [Google Scholar]; b Dann O, Bergen G, Demant E, Volz G. Justus Liebigs Ann. Chem. 1971;749:68–89. doi: 10.1002/jlac.19727600105. [DOI] [PubMed] [Google Scholar]; c Dann O, Fick H, Pietzner B, Walkenhorst E, Fernbach R, Zeh D. Liebigs Ann. Chem. 1975;753:160–194. [Google Scholar]; d Das BP, Boykin DW. J. Med. Chem. 1977;20:531–536. doi: 10.1021/jm00214a014. [DOI] [PubMed] [Google Scholar]; e Anne J, De Clercq E, Eyssen H, Dann O. Antimicrob. Agents Chemother. 1980;18:231–239. doi: 10.1128/aac.18.2.231. [DOI] [PMC free article] [PubMed] [Google Scholar]; f Bell CA, Hall JE, Kyle DE, Grogl M, Ohemeng KA, Allen MA, Tidwell RR. Antimicrob. Agents Chemother. 1990;34:1381–1386. doi: 10.1128/aac.34.7.1381. [DOI] [PMC free article] [PubMed] [Google Scholar]; g Boykin DW, Kumar A, Spychala J, Zhou M, Lombardy RJ, Wilson WD, Dykstra CC, Jones SK, Hall JE, Tidwell RR, Laughton C, Nunn CM, Neidle S. J. Med. Chem. 1995;38:912–916. doi: 10.1021/jm00006a009. [DOI] [PubMed] [Google Scholar]; h Ismail M, Brun R, Wenzler T, Tanious F, Wilson WD, Boykin DW. Bioorg. Med. Chem. 2004;12:5405–5413. doi: 10.1016/j.bmc.2004.07.056. [DOI] [PubMed] [Google Scholar]; i Werbovetz K. Curr. Opin. Invest. Drugs. 2006;7:147–157. [PubMed] [Google Scholar]; j Tidwell RR, Boykin DW. Minor Groove Binders as Antimicrobial Agents. In Small Molecule DNA and RNA Binder: Synthesis to Nucleic Acid Complexes. Wiley-VCH; New York: 2003. pp. 416–460. [Google Scholar]
- 9.Ansede JH, Anbazhagan M, Brun R, Easterbrook JD, Hall JE, Boykin DW. J. Med. Chem. 2004;47:4335–4338. doi: 10.1021/jm030604o. [DOI] [PubMed] [Google Scholar]
- 10.Dardonville C, Barrett MP, Brun R, Kaiser M, Tanious F, Wilson WD. J. Med. Chem. 2006;49:3748–3752. doi: 10.1021/jm060295c. [DOI] [PubMed] [Google Scholar]
- 11.Rodriguez F, Rozas I, Kaiser M, Brun R, Nguyen B, Wilson WD, Garcia RN, Dardonville C. J. Med. Chem. 2008;51:909–923. doi: 10.1021/jm7013088. [DOI] [PubMed] [Google Scholar]
- 12.Tidwell RR, Jones SK, Geratz JD, Ohemeng KA, Cory M, Hall JE. J. Med. Chem. 1990;33:1252–1257. doi: 10.1021/jm00166a026. [DOI] [PubMed] [Google Scholar]
- 13.Hu L, Kully ML, Boykin DW, Abood N. Bioorg. Med. Chem. Lett. 2009;19:3374–3377. doi: 10.1016/j.bmcl.2009.05.061. [DOI] [PubMed] [Google Scholar]
- 14.Nagle PS, Rodriguez F, Kahvedžić A, Quinn SJ, Rozas I. J. Med. Chem. 2009;52:7113–7121. doi: 10.1021/jm901017t. [DOI] [PubMed] [Google Scholar]
- 15.Norden B, Kubista M, Kurucsev T. Q. Rev. Biophys. 1992;25:51–170. doi: 10.1017/s0033583500004728. [DOI] [PubMed] [Google Scholar]
- 16.a Lyng R, Rodger A, Norden B. Biopolymers. 1992;32:1201–1214. doi: 10.1002/bip.360320910. [DOI] [PubMed] [Google Scholar]; b Rodger A, Norden B. Circular Dichroism and Linear Dichroism. Oxford University Press; New York: 1997. [Google Scholar]
- 17.a Nguyen B, Tardy C, Bailly C, Colson P, Houssier C, Kumar A, Boykin DW, Wilson WD. Biopolymers. 2002;63:281–297. doi: 10.1002/bip.10073. [DOI] [PubMed] [Google Scholar]; b Liu Y, Kumar A, Boykin DW, Wilson WD. Biophys. Chem. 2007;131:1–14. doi: 10.1016/j.bpc.2007.08.007. [DOI] [PMC free article] [PubMed] [Google Scholar]
- 18.Dardonville C, Goya P, Rozas I, Alsasua A, Martin I, Borrego MJ. Bioorg. Med. Chem. 2000;8:1567–1577. doi: 10.1016/s0968-0896(00)00089-4. [DOI] [PubMed] [Google Scholar]
- 19.Glass LS, Nguyen B, Goodwin KD, Dardonville C, Wilson WD, Long EC, Georgiadis MM. Biochemistry. 2009;48:5943–5952. doi: 10.1021/bi900204w. [DOI] [PMC free article] [PubMed] [Google Scholar]
- 20.ArgusLab 4.01. Planaria Software LLC; Seatle, WA: 2004. [Google Scholar]
- 21.Morris GM, Huey R, Lindstrom W, Sanner MF, Belew RK, Goodsell DS, Olson AJ. J. Comput. Chem. 2009;30:2785–2791. doi: 10.1002/jcc.21256. Autodock 4.2. [DOI] [PMC free article] [PubMed] [Google Scholar]
- 22.Krowicki K, Lee M, Hartley JA, Ward B, Kissinger K, Skorobogaty A, Dabrowiak JC, Lown JW. In: Molecular recognition between oligopeptides and nucleic acids – rational design of sequence specific DNA binding agents. In Structure & Expression, Volume 2: DNA and its drug complexes. 1st ed. Sarma RH, Sarma MH, editors. Adenine Press; Schenectady, New York: 1988. pp. 255–256. [Google Scholar]
- 23.a Nguyen B, Tanious FA, Wilson WD. Methods. 2007;42:150–161. doi: 10.1016/j.ymeth.2006.09.009. [DOI] [PubMed] [Google Scholar]; b Tanious FA, Nguyen B, Wilson WD. Methods Cell Biol. 2008;84:53–77. doi: 10.1016/S0091-679X(07)84003-9. [DOI] [PubMed] [Google Scholar]
- 24.Frisch MJ, Trucks GW, Schlegel HB, Scuseria GE, Robb MA, Cheeseman JR, Montgomery JA, Jr., Vreven T, Kudin KN, Burant JC, Millam JM, Iyengar SS, Tomasi J, Barone V, Mennucci B, Cossi M, Scalmani G, Rega N, Petersson GA, Nakatsuji H, Hada M, Ehara M, Toyota K, Fukuda R, Hasegawa J, Ishida M, Nakajima T, Honda Y, Kitao O, Nakai H, Klene M, Li X, Knox JE, Hratchian HP, Cross JB, Bakken V, Adamo C, Jaramillo J, Gomperts R, Stratmann RE, Yazyev O, Austin AJ, Cammi R, Pomelli C, Ochterski JW, Ayala PY, Morokuma K, Voth GA, Salvador P, Dannenberg JJ, Zakrzewski VG, Dapprich S, Daniels AD, Strain MC, Farkas O, Malick DK, Rabuck AD, Raghavachari K, Foresman JB, Ortiz JV, Cui Q, Baboul AG, Clifford S, Cioslowski J, Stefanov BB, Liu G, Liashenko A, Piskorz P, Komaromi I, Martin RL, Fox DJ, Keith T, Al-Laham MA, Peng CY, Nanayakkara A, Challacombe M, Gill PMW, Johnson B, Chen W, Wong MW, Gonzalez C, Pople JA. Gaussian 03, Revision C.02. Gaussian, Inc.; Wallingford CT: 2004. [Google Scholar]
- 25.Goonan A, Kahvedžić A, Rodriguez F, Nagle P, McCabe T, Rozas I, Erdozain AM, Meana JJ, Callado LF. Bioorg. Med. Chem. 2008;16:8210–8217. doi: 10.1016/j.bmc.2008.07.033. [DOI] [PubMed] [Google Scholar]
Associated Data
This section collects any data citations, data availability statements, or supplementary materials included in this article.


