

Abstract
Thus far, methods that give quantitative information about lateral interactions in membranes have been restricted peptides or simplified protein constructs studied in detergents, lipid vesicles or bacterial membranes. None of the available methods have been extended to complex or full length membrane proteins. Here we show how free energies of membrane protein dimerization can be measured in mammalian plasma membrane-derived vesicles. The measurements, performed in single vesicles, utilize the Quantitative Imaging FRET (QI-FRET) method. The experiments are described in a step-by-step protocol. The protein characterized is the transmembrane domain of Glycophorin A, the most extensively studied membrane protein, known to form homodimers in hydrophobic environments. The results suggest that molecular crowding in cellular membranes has a dramatic effect on the strength of membrane protein interactions.
Interactions between proteins in cells define signaling networks and determine cellular responses to environmental stimuli. Quantitative measurements of protein interactions, yielding binding curves and equilibrium constants, give us the power to predict the distribution of proteins in their monomeric and associated states, as a function of protein expression, and ultimately predict biological activity. Measurements in model systems, however, are not likely to yield accurate predictions, because interactions in the native cellular environment occur within the context of a complex and crowded system, characterized by a high macromolecular concentration1-3. Thus, predictions of biological outcomes will be valid only if the interaction strengths are measured in the crowded cellular environments.
Of all interactions between biological macromolecules, interactions between membrane proteins are the least characterized due to many experimental challenges (see4;5 for reviews). Since most mammalian membrane proteins are α-helical, this problem often reduces to studies of lateral interactions of transmembrane (TM) α-helices. While there are a few studies of interaction energetics of TM helices in lipid bilayers6-9, most of the experimental studies are carried out in detergent micelles, an environment that is not an appropriate mimetic of the biological membrane10-12. Yet, interactions between TM helices underlie vital cellular processes, such as the folding of multi-span membrane proteins into their unique three dimensional structures, and RTK-mediated signal transduction across the plasma membrane 4;13-16. Thus, the ability to measure strengths of TM helix association in the native cellular environment will enhance our knowledge of these biological processes.
Experimental limitations and unanswered questions pertaining to TM helix association are particularly obvious in the studies of Glycophorin A (GpA), the primary sialoglycoprotein of human erythrocyte membranes. GpA is the most extensively studied transmembrane protein in terms of its dimerization energetics. In particular, numerous studies utilizing SDS-PAGE, ultracentrifugation, FRET, and bacterial two-hybrid assays have shown that the TM helix of GpA has a propensity for sequence-specific dimerization in detergents and in bacterial membranes 17-21. GpA runs as a dimer on SDS gels, indicative of high dimer stability in detergent 17;22;23. The high stability in detergent makes the dimer amenable to structure determination using high-resolution NMR24. Furthermore, GpA gives a strong signal in a semi-quantitative genetic assay termed “TOXCAT” for measuring self-association between transmembrane helices25.
Based on all these measurements, it has been proposed that GpA is constitutively dimeric in all membranes 19;26. Yet, a recent paper by MacKenzie and colleagues presented arguments that although GpA gives a strong signal in TOXCAT, the actual dimer fraction in the bacterial membranes is small, even at the high concentrations achieved in over-expression experiments27. This contradiction raises the possibility that protein crowding in cellular membranes, an effect that is not present in detergent micelles and lipid bilayers, may be reducing the stability of the GpA dimer. Furthermore, there may be additional unknown factors in cellular membranes that modulate dimer stability. Thus, even for the extensively studied GpA, dimerization strength in mammalian membranes is unknown, demonstrating a huge gap of knowledge about interactions of proteins in crowded biological membranes.
Here we bridge this gap by measuring the energetics of GpA dimerization in vesicles derived from mammalian membranes. These vesicles have been used as a model system for studies of plasma membrane lipids and proteins28;29, and here we demonstrate their utility as a platform for quantitative FRET measurements of GpA dimerization. We provide the first experimental demonstration that the recently introduced QI-FRET method30 can be used to uncover strengths of protein-protein interactions in plasma membrane-derived vesicles, and we present the first direct measurement of protein dimer fractions and dimerization free energy in mammalian membranes.
Results
QI-FRET calculation of GpA dimerization free energy
Recently, we introduced quantitative imaging FRET (QI-FRET) as a method that could yield free energies of protein-protein interactions in the crowded cellular environment30. The QI-FRET method allows the determination of the FRET efficiency E, as well as the concentration of donors and acceptors, CD and CA (the three parameters needed to calculate association constants), in plasma membrane-derived vesicles. These vesicles, which bud off cells upon treatments disrupting the cytoskeleton, are loaded with cytoplasm and are bound by the plasma membrane. They are produced using established methods and have been extensively characterized in several laboratories31;32. We produced the plasma membrane-derived vesicles from CHO cells, 24 hours after co-transfecting the cells with genes encoding GpA tagged with a FRET donor and a FRET acceptor (see Figure 1), and we determined the dimeric and monomeric GpA fractions in each vesicle using QI-FRET. Unlike cells, the plasma membrane-derived vesicles are characterized by homogeneous distribution of the fluorescently-tagged proteins inside the vesicles or in the membrane30. The uniform fluorescence allowed us to compare the fluorescence intensity of the vesicles with the fluorescence intensity of solutions of purified proteins of known concentration, thus allowing the implementation of the QI-FRET method.
Figure 1.

Overview of measurements of GpA dimerization energy in plasma membrane-derived vesicles.
The steps involved in the QI-FRET method, as applied to GpA dimerization, are outlined in Figure 2. The steps are divided into two phases. Phase I utilizes vesicles loaded with soluble fluorescent proteins and solutions of purified fluorescent protein as standards and yields the parameters required to measure the FRET efficiency and the concentrations of donors and acceptors. Phase I was described in detail in ref.30. A critical parameter, calculated in this step is the gauge factor GF, which correlates the sensitized emission of the acceptor to donor quenching. In this paper, cells were transfected with genes encoding GpA, tagged with donors and acceptors. Single vesicles, with membranes loaded with GpA, were imaged in Phase II of the QI-FRET method using a confocal microscope. The GpA concentration in the membrane of each vesicle, the FRET efficiency, and the dimeric fraction were determined from the intensities measured in the donor, FRET and acceptor scans for each vesicle using the parameters determined in Phase I, ultimately yielding the free energy of GpA dimerization.
Figure 2.
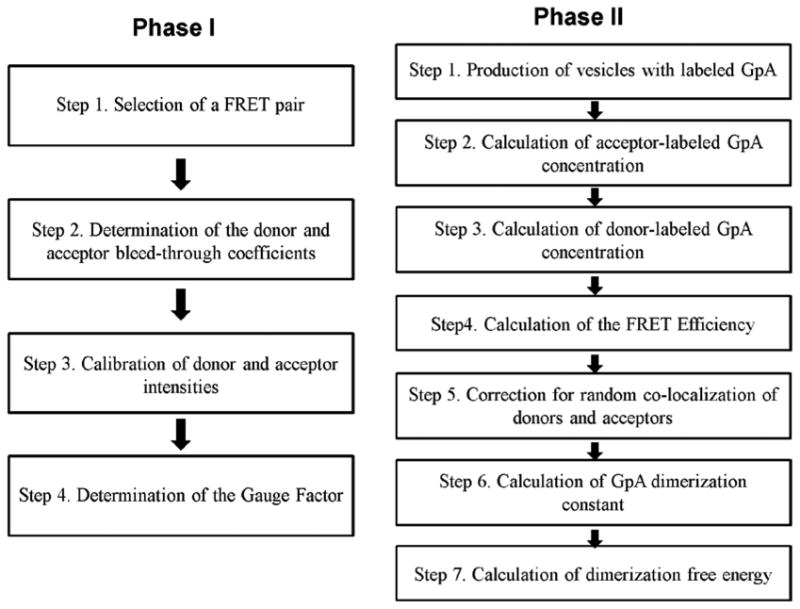
Flowchart describing the steps involved in the QI-FRET method. The parameters determined in Phase I are used to calculate the free energy of GpA dimerization in Phase II.
Phase I, Step 1. Selection of a FRET pair
The requirement for the donor-acceptor pair (the FRET pair) are that three distinct image scans can be performed for a particular imaging system: (i) a donor scan which gives the fluorescence image of the donor only when the donor is excited, (ii) a FRET scan which gives the fluorescence image of the acceptor when the donor is excited, and (iii) an acceptor scan which gives the fluorescence image of the acceptor when only the acceptor is excited.
For this work, the fluorescent proteins EYFP and mCherry were selected as the donor and acceptor, respectively. As shown in Figure S1 in Supplemental Information, EYFP and mCherry satisfy the above requirements for an imaging system consisting of two lasers (488 and 543 nm) and three detection channels: channel 1 (500 – 530 nm), channel 2 (565 – 565 nm) and channel 3 (>650 nm). Thus, the intensity of the donor emission (ID) is obtained in the donor scan by using the 488 nm laser and channel 1. The sensitized emission IFRET, is obtained from the FRET scan, which uses the 488 nm laser to excite EYFP, and channel 2 to record the emission of mCherry.
The acceptor scan utilizes the 543 nm laser and channel 3 to yield the emission intensity of the acceptor mCherry (IA).
Phase I, Step 2. Determination of the donor and acceptor bleed-through coefficients
Bleed-through coefficients were calculated from images of purified EYFP or mCherry solutions. The fluorescent proteins were expressed in BL21(DE) competent cells, purified using His-tag affinity chromatography, and concentrated in vesiculation buffer as described30.
The donor bleed-through coefficient, βD, was determined from the measured intensities of EYFP in the donor and FRET scans, ID and IFRET, as follows30:
| (1) |
Similarly, the acceptor bleed-through coefficient, βA, was determined from the acceptor and FRET intensities (IA and IFRET) of the mCherry solution30:
| (2) |
EYFP and mCherry bleed-throughs were calculated as βD = 0.34 ± 0.01 and βA = 0.20 ± 0.01, respectively.
Phase I, Step 3. Calibration of donor and acceptor intensities
A set of purified EYFP and mCherry solutions of known concentrations were analyzed using the donor and acceptor scans, respectively. Figure S2 in Supplemental information shows the calibration curves, giving the emission intensity versus concentration. The slopes of the lines gave the calibration constants for EYFP and mCherry, iD and iA, as 6544 ± 256 and 1409 ± 17, respectively. These constants can be used to determine the apparent concentration of the donor and the actual concentration of the acceptor as discussed below. The linear dependence shown in Figure S2 indicated that there are no inner-filter effects, such that protein concentrations and image intensities can be correlated.
Phase I, Step 4. Determination of the gauge factor, GF
The gauge factor, GF, correlates the measured sensitized emission to the donor quenching. To calculate GF, we use a linked fluorescent protein construct (EYFP_mCherry) as a positive FRET control with a donor-to-acceptor ratio of one30. CHO cells transfected with this construct are vesiculated as described30, and each vesicle was imaged in the three acans to obtain ID, IFRET and IA (see Figure S3 in Supplemental information). The acceptor concentration (CA) and the apparent donor concentration (CD,app) were calculated as30:
| (3) |
| (4) |
Note that ID is the intensity of the donor in the presence of the acceptor. Therefore, CD,app < CD because the donor is quenched due to FRET in vesicles containing the linked fluorescent proteins.
The gauge factor was determined as30:
| (5) |
where the sensitized emission Isen is given by:
| (6) |
The value of GF was determined here as 8.2 ± 1.6, by analyzing about 60 different vesicles. Next, the donor intensity in the absence of FRET, ID,corr, and the actual donor concentration CD, were also calculated according to30:
| (7) |
| (8) |
With the value of GF known, we also calculated the FRET efficiency for the linked EYFP_mCherry construct as E = 0.46 ± 0.06. Previously we have measured the FRET in the linked construct using the purified construct in buffer solutions30. The FRET efficiency was determined as 0.49 ± 0.06 30. Therefore, the measurements in vesicles and in solution give the same value of E, validating the calculations in Phase I. Next, the values of GF, βD, βA, iA, and iD determined above are used in Phase II to calculate the free energy of GpA dimerization.
Phase II, Step 1. Production of vesicles with labeled GpA
The design of the GpA plasmids is shown in Supplemental Information. EYFP or mCherry were attached to the C-terminus of GpA via a 15 amino acid flexible linker. GpA_EYFP and GpA_mCherry were co-transfected into CHO cells. 24 hours after transfection, vesiculation was carried out as described in Supplemental Information. Vesicles loaded with GpA_EYFP and GpA_mCherry were collected and imaged.
Three images (donor, FRET, acceptor) of a single vesicle are shown in Figure 3. The images are processed with a Matlab program written in the lab, which automatically recognizes the vesicles and integrates the membrane intensity, fitting the signal that originates from the membrane to a Gaussian function (and the background fluorescence inside the vesicle to an error function, see dashed line in Figure 3), calculating the three intensities, . Unlike the intensities discussed in Phase I, these are fluorescence intensities per unit membrane area.
Figure 3.
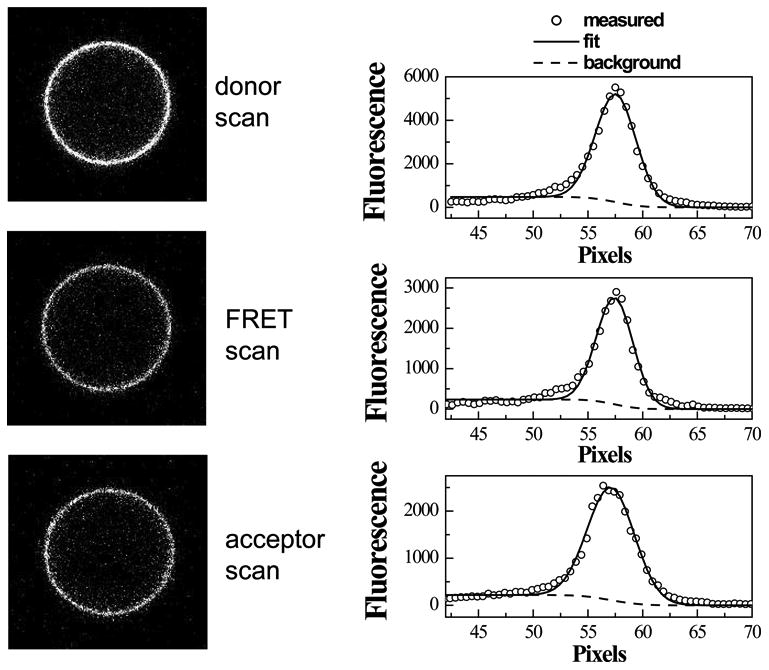
One vesicle loaded with GpA_EYFP and GpA_mCherry. Intensities per unit membrane area were obtained by integrating the Gaussian intensity profiles across the membrane.
Phase II, Step 2. Calculation of acceptor-labeled GpA concentrations
Using the intensities and the calibration constant iA determined in Phase I step 3, the concentrations of acceptor-labeled GpA per unit membrane area (normal to the focal plane) was calculated for each vesicle as:
| (9) |
Phase II, Step 3. Calculation of donor-labeled GpA concentrations
Using and the bleedthrough coefficients βD and βA determined in Phase I step 2, the sensitized acceptor emission was determined using equation (6). Using the values of and the gauge factor (GF), the corrected donor intensity (as if FRET did not exist) was determined using equation (8). The concentration of donor-labeled GpA molecules per unit membrane area was determined as:
| (10) |
Phase II, Step 4. Calculation of the FRET efficiency (E)
Using the donor intensities and calculated above, the FRET efficiency (E) was calculated for each vesicle according to30:
| (11) |
E, calculated in this step, is plotted for each vesicle as a function of the acceptor concentration in the vesicle in Figure 4A.
Figure 4.

(A) FRET data and proximity contribution for GpA in CHO plasma membrane-derived vesicles. Each data point represents a single vesicle, for which E, CA and CD are determined using the QI-FRET method. Data analysis suggests that the scatter is largely due to random noise in image acquisition (see text). (B) Calculated dimeric fraction times Ẽ. Ẽ is the FRET efficiency in a GpA dimer with a donor and an acceptor. (C) Fit of the data to the dimerization model while varying the two unknowns, Ẽ and the dimerization constant KD.
Phase II, Step 5. Correction for random co-localization of donors and acceptors
The measured E calculated in equation (11) contains two contributions: ED, the FRET efficiency due to sequence-specific dimerization, and Eproximity, the FRET efficiency due to random co-localization of donor and acceptor 33;34. The FRET efficiency due to random co-localization depends only on the acceptor concentration. One way to determine the proximity contribution is to calculate it using the model of Wolber and Hudson 35, a model that describes the proximity contribution very well 33;36. Previously, we have verified the proximity contribution calculations experimentally using lifetime measurements 37. To account for the fact that EYFP and mCherry are bulky and thus the two fluorophores cannot approach closer than 30 Å, here we modified the model to prohibit such close random encounters. Note that the correction for proximity in each vesicle can be performed because we determine the actual concentration of acceptors in each vesicle using equation (9).
The proximity contribution is shown in Figure 4A. Next, it is subtracted from the measured FRET to obtain FRET due to sequence-specific dimerization, ED:
| (12) |
Phase II, Step 6. Calculation of the GpA dimerization constant
The FRET efficiency due to sequence specific dimerization ED can be written as 38:
| (13) |
where fD is the fraction of GpA molecules in the dimeric state, and Ẽ is the FRET efficiency in a GpA dimer with a donor and an acceptor. Ẽ depends on the distance between the donor and the acceptor in the dimer, i.e. on the structure of the dimer. xA is the probability of a donor-labeled GpA to dimerize with an acceptor-labeled GpA:
| (14) |
where and are determined using equations (9) and (10), respectively. The fraction of GpA molecules that are dimeric is:
| (15) |
where [D] is dimer concentration and is the total GpA concentration. Thus, equation (13) can be re-written as:
| (16) |
and therefore:
| (17) |
This quantity is plotted in Figure 4B for each vesicle, against the total GpA concentration in the vesicle. Each data point corresponds to a single vesicle. The theoretical prediction for the GpA dimeric fraction fD= 2[D]/[T] as a function of GpA concentration was calculated based on the following two equations describing the dimerization process:
| (18) |
| (19) |
These two equations yield the unknown monomer and dimer concentrations, [M] and [D], and thus the dimeric fraction 2[D]/[T], as a function of the dimerization constant KD and the total GpA concentration [T]. The theoretical 2[D]/[T] curve was fitted to the experimental 2[D]Ẽ/[T] data in a two-parameter fit, while optimizing for both Ẽ and the dimerization constant KD. The optimal values determined in the fit were Ẽ = 0.63 ± 0.04 and KD = 714 ± 161 nm2. These values did not depend on the initial guesses, indicative of robust fits.
The value of Ẽ was higher than the value of E measured for the linked EYFP_mCherry construct in Phase I, E = 0.46 ± 0.06. This result can be rationalized, since the two fluorescent proteins in the linked construct are attached one after the other (the N-terminus of EYFP is linked to mCherry), while in the GpA dimer they are positioned side by side, as shown in Figure 1. Thus, the distance between the fluorophores is expected to be smaller in the GpA dimer, as compared to the linked construct. We measured the Forster radius, R0, of the EYFP_mCherry FRET pair as described as 53 Å, and we calculated the distance between the fluorophores as ∼ 54 Å in the linked EYFP_mCherry construct, and ∼ 48.5 Å in the GpA dimer.
The optimized theoretical prediction for the dimeric fraction is shown in Figure 4C, along with experimental data averages. Since the probability of having exactly the same GpA concentration in several vesicles is very low, the experimental averages and standard errors were calculated by averaging data with similar GpA concentrations, within bins that had between 3 and 20 points. In particular, all the data points within a concentration interval of 0.0005 GpA molecules/nm2 were averaged. For example, the first point in Figure 4C is obtained by averaging all the data points within the bin comprising 0.0005 to 0.001 molecules/nm2. While this data averaging step does not impact data fitting, it facilitates the comparison between the data and the fit in Figure 4C.
Phase II Step 7. Calculation of GpA dimerization free energy
The lateral interactions between the GpA molecules are interactions in two dimensions, and the units of the dimerization constants are area (units of dissociation constants are 1/area). Defining the standard state as KD = 1 nm2, we obtained a free energy of dimerization ΔG = −RT ln KD= −3.9 ± 0.2 kcal/mole. This is the first quantitative measure of dimerization energetics of a membrane protein in mammalian membranes. In the future, the free energy of GpA dimerization can be used as a standard to which other interaction energies can be compared.
Analysis of errors and data scatter
To gain insight into the source of data scatter in Figure 4, we analyzed the differences in the calculated dimeric fractions when three independent images of 10 vesicles were taken while re-focusing for each image. In these imaging experiments, bleaching is negligible30. The three sets of images for each vesicle were processed with the Matlab program and the fluorescence intensities across the membrane were calculated as the areas of the best-fit Gaussians, as shown in Figure 3. Figure 5 A shows the averages of the calculated membrane intensities , and for each vesicle, along with the standard deviations. Repeated measurements of intensities varied by only a few percent. Next, dimeric fractions were calculated for each set of images. The three independent calculations for each vesicle were averaged, and are shown in Figure 5B along with the standard deviations. Despite the small errors in the measured intensities (Figure 5A), the standard deviations in the dimeric fractions are large (Figure B), explaining data scatter in Figure 4. The uncertainties in the dimeric fractions accumulated due to error propagation in the mathematical manipulations of the QI-FRET method.
Figure 5.

Analysis of uncertainties in calculated dimeric fractions due to uncertainties in image acquisition. 3 independent images of 10 vesicles were taken while re-focusing for each image. (A) shows the averages of the calculated membrane intensities , and for each vesicle, along with the standard deviations. (B) shows the averages of the dimeric fractions, calculated independently from each image set, along with their standard deviations.
Next, we compared the results for all the vesicles in Figure 4, when two different methods were used to calculate the intensities , and across the membrane. The first calculation utilized the best-fit Gaussians as discussed above. In the second calculation, we summed up the pixel intensities across the membrane without fitting them to Gaussians, and thus without filtering the white noise in the images. The two different membrane intensity calculations differed by no more than a few percent. Thus, the differences were similar to the uncertainties associated with repeated measurements of the same vesicle (shown in Figure 5A). We then used the two different intensity calculations to calculate CA, CD, and the FRET efficiencies, as well as the dimeric fractions. The differences in the calculated dimeric fractions are shown in Figure 6 for each vesicle, as a function of total GpA concentration. Not surprisingly, the differences are larger at low GpA concentrations, corresponding to vesicles of low fluorescence intensity. They are similar to the observed differences between vesicles in Figure 4, further suggesting that the observed scatter in Figure 4 is due to random noise in image acquisition.
Figure 6.

Differences in calculated dimeric fractions, when using two methods to determine the membrane intensities , and for each vesicle analyzed in Figure 4, with and without filtering the random noise in the fluorescence images. The calculated differences due to noise are similar to the observed differences between vesicles in Figure 4, suggesting that random noise in the fluorescence images leads to the observed scatter in Figure 4.
Next we investigated if there is a correlation between the size of the vesicles and the calculated dimeric fractions. The dimeric fractions as a function of vesicle size are shown in Figure S4 in Supplemental information. We see no correlation, and thus variations in vesicle size are not introducing systematic errors in the measurements. We also analyzed vesicles over time, and we did not observe changes in FRET efficiencies within one day of vesicle preparation. Thus, it appears that the major source of data scatter in Figure 4 is the random noise associated with imaging. Importantly, uncertainties that arise due to random noise are reducible by collecting a sufficient number of data points. This point is well illustrated in Figure 4C. In addition, improvements in image acquisition will further reduce the noise and the uncertainties. For instance, the utility of microscopes that yield spectral information39 should be explored in conjunction with the EmEx-FRET method which utilizes spectra instead of images8.
Discussion
The efficiency of Förster resonance energy transfer (FRET) is often used to calculate free energies of interactions of purified proteins in model systems. In model buffer solutions, the calculations of free energies of interactions from the measured FRET efficiencies are straightforward because the concentrations of donor- and acceptor-tagged proteins are easily controlled and are known. For membrane proteins, however, measurements in such model systems require overexpression in sufficient quantities, followed by purification and reconstitution into appropriate lipid systems. For most membrane proteins, such sample preparation remains a challenge.
The alternative is to perform FRET measurements in cells, and fluorescence studies have addressed the occurrence of interactions in biological membranes 40;41. FRET has been used to determine if interactions occur, but measurements of interaction free energies pose three main challenges:
The first challenge is measuring the absolute FRET efficiency, E. Most imaging experiments do not measure the FRET efficiency; instead, they measure the sensitized acceptor emission (Isen). The sensitized acceptor emission is proportional to the donor quenching due to FRET, ΔID, according to ΔID= GF Isen. The gauge factor GF depends on the wavelength of the recorded emissions of the donor and the acceptor, on the ratio of their quantum yields, as well as on the environment which is heterogeneous in cells.
The second challenge is determining the concentrations of donors (CD) and acceptors (CA), which are needed to calculate free energies of interactions. Because these experiments involve co-transfection of fluorescently-tagged proteins, and because the expression of these proteins in cells cannot be controlled, the donor and acceptor concentrations and thus the donor-to-acceptor ratios are unknown, and vary from cell to cell. Furthermore, the proteins are often distributed non-uniformly throughout the cell.
The third challenge is that often transfection leads to the expression of large quantities of membrane proteins, which overload the ER and the Golgi, and the fluorescent signal from the plasma membrane is difficult to separate from the overall fluorescence, often limiting such fluorescence studies to “flat” cells such as Cos7.
We demonstrate that all these challenges can be overcome if we use plasma membrane derived vesicles because the donor and acceptor concentrations and the FRET efficiency in each vesicle can be determined using the QI-FRET method, based on the fact that the protein distribution within the vesicles is homogeneous. We utilize transient transfection of genes encoding fluorescent protein-tagged membrane proteins. Because transient expression levels vary from cell to cell, vesicles with a wide range of protein concentrations (i.e number of proteins per unit membrane area) can be produced in a single transfection experiment (see Figure 4). Thus, a wide protein concentration range can be sampled, and the dimerization energetics can be measured for different protein concentrations, to obtain dimerization curves and dimerization free energy.
Plasma membrane-derived vesicles are produced using established methods and have been extensively characterized in several laboratories. For instance, the vesiculation procedure has been shown to preserve the directionality of the proteins 31;32;42. The vesiculation buffer has low concentration of formaldehyde, almost 100 times lower than concentrations used to fix cells. While the formaldehyde may have some undesirable effects, these can be reversed with dialysis 43, or after the addition of glycine to quench the formaldehyde 44. We always add large excess of glycine after vesiculation starts, and thus we do not expect perturbations due to the formaldehyde presence. Indeed, membrane receptors retain their ligand-binding ability in these vesicles, as evident from binding of fluorescent ligands (E. Li and K. Hristova, unpublished resluts), suggesting that the molecular interactions are preserved. Furthermore, it has been shown that the kinase activity of membrane-associated tyrosine kinases such as Lyn is preserved in these vesicles (B, Baird, personal communication).
Plasma membrane derived-vesicles are a simplified model of the cell membrane because there is no cytoskeleton and no TM potential 45. In addition, there are no intracellular membranes inside the vesicles. In the vesicles, no new proteins are delivered or destroyed. The proteins tagged with fluorescent proteins exhibit uniform fluorescence (see Figure 3) and fast homogeneous mobility (as assessed by fluorescence recovery after photobleaching (FRAP) experiments, not shown here). Furthermore, the data are consistent with equilibrium between monomers and dimers (Figure 4C).
While plasma membrane-derived vesicles are a simplified model of the membrane, they possess complex features that are characteristic of native cellular membranes. For instance, the vesicles are loaded with various membrane proteins, and mimic the natural crowded membrane environment. While the molecular crowding is expected to affect the interactions, it is not clear how. To understand the effects of protein crowding on protein-protein interactions in biological membranes, here we characterize GpA homodimerization in plasma membrane derived vesicles, so we can compare the results to many published studies of GpA dimerization in detergent systems. These previous studies suggest that GpA homodimers are very stable in model systems19;24;26;46. In fact, it is believed that the energetics of GpA dimerization cannot be characterized in lipid vesicles because the interactions are too strong (GpA is 100% dimer). Thus, it appears that the crowded environment weakens the strength of GpA interactions. This is the first study of this kind, and investigations of other proteins will further our understanding of how protein crowding and complexity of cellular membranes affects membrane protein interactions. Such studies are now feasible with the method that we introduce here.
Experimental Procedures
Materials and Methods
Plasmid constructs
pRSET_mCherry was obtained from the laboratory of Roger Tsien (University of California, San Diego), and pEYFP was a kind gift from Michael Betenbaugh (Johns Hopkins University, Baltimore). All primers were purchased from Invitrogen. Plasmids used for mammalian expression were engineered using the pcDNA3.1 vector (Invitrogen). Plasmids used for bacterial expression were engineered using pRSET-B (Invitrogen).
Plasmids encoding GpA (LIIFGVMAGVIGTILLISYGIRRL), tagged with fluorescent proteins at the C terminus and a signal peptide directing GpA to the plasma membrane at the N-terminus (MGAPACALALCVAVAIVAGA), were constructed between the multicloning sites HindIII and XbaI of PcDNA3.1. The linker between the fluorescent proteins and GpA was a flexible 15 amino acid-long linker (GGS)5. In addition, an 11 amino acid VSG-g tag (YTDIEMNRLGK) was inserted between the signal peptide and GpA, to allow the detection of GpA on the cell surface of CHO cells. Control immunostaining experiments (not shown) confirmed that the GpA constructs express on the cell surface.
Bacterial expression and purification of soluble EYFP and mCherry, and the linked EYFP_mCherry construct was performed as described 30. Plasmids for mammalian expression of soluble EYFP and mCherry and the linked EYFP_mCherry construct are also described in ref. 30.
CHO cell growth, transfection and vesiculation
Chinese hamster ovary (CHO) cells were grown in Dulbecco's Modified Eagle Medium (DMEM) supplemented with 10% fetal bovine serum (FBS), 1 mM non-essential amino acids, 1.8 g/L d-glucose, and 1.5 g/L sodium bicarbonate. 2×10⁴ cells/well were seeded in 6-well plate one day before transfection.
Transfection was carried out using Fugene® HD transfection reagent (Roche Applied Science), following the manufacturer's protocol. Cells were transfected with pcDNA_EYFP_mCherry, or co-transfected with pcDNA_GpA_EYFP and pcDNA_GpA_mCherry, and vesiculated 24 hours after transfection.
Vesiculation was carried out using a previously described protocol 45. Cells were rinsed three times with PBS (pH 7.4) containing 0.75 mM calcium and 0.5 mM magnesium (CM-PBS), and incubated with 1 ml of vesiculation buffer at 37 °C. To quench the formaldehyde after vesiculation, glycine solution in PBS was added to the vesiculation buffer to a final concentration of 0.125 M. The vesiculation buffer consisted of CM-PBS with 25 mM formaldehyde and 0.5 mM 1,4-dithiotreitol (DTT). A large number of vesicles were produced after two hours, and the vesicles were transferred into an 8-well Nunc Lab-Tek II chambered coverslips for imaging.
Image acquisition
Vesicles were imaged using a Nikon Eclipse confocal laser scanning microscope with a 60X water immersion objective. All the images were collected and stored at a 512x512 resolution. Three different scans were performed for each vesicle: (1) excitation at 488 nm, with a 500-530 nm emission filter (donor scan); (2) excitation at 488 nm, with a 565-615 nm emission filter (FRET scan); and (3) excitation at 543 nm, with a 650 nm long-pass filter (acceptor scan). Gains of 8.0 were used for all the three scans. To minimize the bleaching of fluorescent proteins, ND8 filters were used during excitation with the 488 nm laser, and pixel dwell time was set to the minimum (1.68 μs).
Image analysis
The fluorescence intensities of vesicles loaded with soluble fluorescent proteins were analyzed using the ImageJ software (NIH) as described30. Cells co-transfected with pcDNA_GpA_EYFP and pcDNA_GpA_mCherry produced vesicles with low cytoplasmic fluorescence intensity and highly fluorescent membranes. These images were analyzed with a Matlab program developed in the lab, which automatically recognizes the vesicles and calculates the intensities in the three channels.
Supplementary Material
Acknowledgments
Supported by NSF MCB-0718841.
Reference List
- 1.Ellis RJ. Trends Biochem Sci. 2001;26:597–604. doi: 10.1016/s0968-0004(01)01938-7. [DOI] [PubMed] [Google Scholar]
- 2.Ellis RJ. Cur Opinion Struc Biol. 2001;11:114–19. doi: 10.1016/s0959-440x(00)00172-x. [DOI] [PubMed] [Google Scholar]
- 3.Minton AP. Cur Opinion Struc Biol. 2000;10:34–39. doi: 10.1016/s0959-440x(99)00045-7. [DOI] [PubMed] [Google Scholar]
- 4.MacKenzie KR. Chem Rev. 2006;106:1931–77. doi: 10.1021/cr0404388. [DOI] [PubMed] [Google Scholar]
- 5.Hong H, Joh NH, Bowie JU, Tamm LK. Methods in Enzymology: Biothermodynamics. 2009;455455(Part A):213–36. doi: 10.1016/S0076-6879(08)04208-0. [DOI] [PubMed] [Google Scholar]
- 6.Chen L, Merzlyakov M, Cohen T, Shai Y, Hristova K. Biophys J. 2009;96:4622–30. doi: 10.1016/j.bpj.2009.03.004. [DOI] [PMC free article] [PubMed] [Google Scholar]
- 7.Artemenko EO, Egorova NS, Arseniev AS, Feofanov AV. Biochim Biophys Acta. 2008;1778:2361–67. doi: 10.1016/j.bbamem.2008.06.003. [DOI] [PubMed] [Google Scholar]
- 8.Merzlyakov M, Chen L, Hristova K. J Membr Biol. 2007;215:93–103. doi: 10.1007/s00232-007-9009-0. [DOI] [PMC free article] [PubMed] [Google Scholar]
- 9.Cristian L, Lear JD, DeGrado WF. Proceedings of the National Academy of Sciences of the United States of America. 2003;100:14772–77. doi: 10.1073/pnas.2536751100. [DOI] [PMC free article] [PubMed] [Google Scholar]
- 10.Matthews EE, Zoonens M, Engelman DM. Cell. 2006;127:447–50. doi: 10.1016/j.cell.2006.10.016. [DOI] [PubMed] [Google Scholar]
- 11.Soong R, Merzlyakov M, Hristova K. J Membr Biol. 2009;230:49–55. doi: 10.1007/s00232-009-9185-1. [DOI] [PMC free article] [PubMed] [Google Scholar]
- 12.Walkenhorst WF, Merzlyakov M, Hristova K, Wimley WC. Biochim Biophys Acta. 2009;1788:1321–31. doi: 10.1016/j.bbamem.2009.02.017. [DOI] [PMC free article] [PubMed] [Google Scholar]
- 13.Lemmon MA, Engelman DM. Q Rev Biophys. 1994;27:157–218. doi: 10.1017/s0033583500004522. [DOI] [PubMed] [Google Scholar]
- 14.White SH, Wimley WC, Ladokhin AS, Hristova K. Biol Skr Dan Selsk. 1998;49:91–98. [Google Scholar]
- 15.White SH, Wimley WC. Annu Rev Biophys Biomol Struc. 1999;28:319–65. doi: 10.1146/annurev.biophys.28.1.319. [DOI] [PubMed] [Google Scholar]
- 16.Li E, Hristova K. Biochemistry. 2006;45:6241–51. doi: 10.1021/bi060609y. [DOI] [PMC free article] [PubMed] [Google Scholar]
- 17.Lemmon MA, Flanagan JM, Hunt JF, Adair BD, Bormann BJ, Dempsey CE, Engelman DM. J Biol Chem. 1992;267:7683–89. [PubMed] [Google Scholar]
- 18.Lemmon MA, Treutlein HR, Adams PD, Brünger AT, Engelman DM. Nature Struct Biol. 1994;1:157–63. doi: 10.1038/nsb0394-157. [DOI] [PubMed] [Google Scholar]
- 19.Fisher LE, Engelman DM, Sturgis JN. J Mol Biol. 1999;293:639–51. doi: 10.1006/jmbi.1999.3126. [DOI] [PubMed] [Google Scholar]
- 20.Finger C, Volkmer T, Prodohl A, Otzen DE, Engelman DM, Schneider D. J Mol Biol. 2006;358:1221–28. doi: 10.1016/j.jmb.2006.02.065. [DOI] [PubMed] [Google Scholar]
- 21.Fleming KG, Ackerman AL, Engelman DM. J Mol Biol. 1997;272:266–75. doi: 10.1006/jmbi.1997.1236. [DOI] [PubMed] [Google Scholar]
- 22.Lemmon MA, Flanagan JM, Treutlein HR, Zhang J, Engelman DM. Biochemistry. 1992;31:12719–25. doi: 10.1021/bi00166a002. [DOI] [PubMed] [Google Scholar]
- 23.Fleming KG, Engelman DM. Proceedings of the National Academy of Sciences of the United States of America. 2001;98:14340–44. doi: 10.1073/pnas.251367498. [DOI] [PMC free article] [PubMed] [Google Scholar]
- 24.MacKenzie KR, Prestegard JH, Engelman DM. Science. 1997;276:131–33. doi: 10.1126/science.276.5309.131. [DOI] [PubMed] [Google Scholar]
- 25.Russ WP, Engelman DM. Proc Natl Acad Sci USA. 1999;96:863–68. doi: 10.1073/pnas.96.3.863. [DOI] [PMC free article] [PubMed] [Google Scholar]
- 26.Adair BD, Engelman DM. Biochemistry. 1994;33:5539–44. doi: 10.1021/bi00184a024. [DOI] [PubMed] [Google Scholar]
- 27.Duong MT, Jaszewski TM, Fleming KG, MacKenzie KR. J Mol Biol. 2007;371:422–34. doi: 10.1016/j.jmb.2007.05.026. [DOI] [PMC free article] [PubMed] [Google Scholar]
- 28.Baumgart T, Hammond AT, Sengupta P, Hess ST, Holowka DA, Baird BA, Webb WW. Proceedings of the National Academy of Sciences of the United States of America. 2007;104:3165–70. doi: 10.1073/pnas.0611357104. [DOI] [PMC free article] [PubMed] [Google Scholar]
- 29.Sengupta P, Hammond A, Holowka D, Baird B. Biochimica et Biophysica Acta-Biomembranes. 2008;1778:20–32. doi: 10.1016/j.bbamem.2007.08.028. [DOI] [PMC free article] [PubMed] [Google Scholar]
- 30.Li E, Placone J, Merzlyakov M, Hristova K. Anal Chem. 2008;80:5976–85. doi: 10.1021/ac800616u. [DOI] [PubMed] [Google Scholar]
- 31.Holowka D, Baird B. Biochemistry. 1983;22:3466–74. doi: 10.1021/bi00283a025. [DOI] [PubMed] [Google Scholar]
- 32.Holowka D, Baird B. Biochemistry. 1983;22:3475–84. doi: 10.1021/bi00283a025. [DOI] [PubMed] [Google Scholar]
- 33.Li E, You M, Hristova K. Biochemistry. 2005;44:352–60. doi: 10.1021/bi048480k. [DOI] [PubMed] [Google Scholar]
- 34.You M, Li E, Winley WC, Hristova K. Analytical Biochemistry. 2005;340:154–64. doi: 10.1016/j.ab.2005.01.035. [DOI] [PMC free article] [PubMed] [Google Scholar]
- 35.Wolber PK, Hudson BS. Biophys J. 1979;28:197–210. doi: 10.1016/S0006-3495(79)85171-1. [DOI] [PMC free article] [PubMed] [Google Scholar]
- 36.Li E, You M, Hristova K. J Mol Biol. 2006;356:600–12. doi: 10.1016/j.jmb.2005.11.077. [DOI] [PMC free article] [PubMed] [Google Scholar]
- 37.Posokhov YO, Merzlyakov M, Hristova K, Ladokhin AS. Analytical Biochemistry. 2008;380:134–36. doi: 10.1016/j.ab.2008.05.041. [DOI] [PMC free article] [PubMed] [Google Scholar]
- 38.Merzlyakov M, Hristova K. Fluorescence Spectroscopy. 2008;450:107–27. doi: 10.1016/S0076-6879(08)03406-X. [DOI] [PMC free article] [PubMed] [Google Scholar]
- 39.Raicu V, Stoneman MR, Fung R, Melnichuk M, Jansma DB, Pisterzi LF, Rath S, Fox M, Wells JW, Saldin DK. Nature Photonics. 2009;3:107–13. [Google Scholar]
- 40.Kenworthy AK. Methods. 2001;24:289–96. doi: 10.1006/meth.2001.1189. [DOI] [PubMed] [Google Scholar]
- 41.Raicu V, Jansma DB, Miller RJD, Friesen JD. Biochem J. 2005;385:265–77. doi: 10.1042/BJ20040226. [DOI] [PMC free article] [PubMed] [Google Scholar]
- 42.Holowka D, Baird B. J Biol Chem. 1984;259:3720–28. [PubMed] [Google Scholar]
- 43.Scott RE, Maercklein PB. J Cell Sci. 1979;35:245–52. doi: 10.1242/jcs.35.1.245. [DOI] [PubMed] [Google Scholar]
- 44.Vasilescu J, Guo XC, Kast J. Proteomics. 2004;4:3845–54. doi: 10.1002/pmic.200400856. [DOI] [PubMed] [Google Scholar]
- 45.Scott RE, Perkins RG, Zschunke MA, Hoerl BJ, Maercklein PB. J Cell Sci. 1979;35:229–43. doi: 10.1242/jcs.35.1.229. [DOI] [PubMed] [Google Scholar]
- 46.Fisher LE, Engelman DM, Sturgis JN. Biophys J. 2003;85:3097–105. doi: 10.1016/S0006-3495(03)74728-6. [DOI] [PMC free article] [PubMed] [Google Scholar]
Associated Data
This section collects any data citations, data availability statements, or supplementary materials included in this article.