

Abstract
A theoretical triglyceride model was developed for in vivo human liver fat 1H MRS characterization, using the number of double bonds (–CH=CH–), number of methylene-interrupted double bonds (–CH=CH–CH2–CH=CH–) and average fatty acid chain length. Five 3 T, single-voxel, stimulated echo acquisition mode spectra (STEAM) were acquired consecutively at progressively longer TEs in a fat–water emulsion phantom and in 121 human subjects with known or suspected nonalcoholic fatty liver disease. T2-corrected peak areas were calculated. Phantom data were used to validate the model. Human data were used in the model to determine the complete liver fat spectrum. In the fat–water emulsion phantom, the spectrum predicted by the model (based on known fatty acid chain distribution) agreed closely with spectroscopic measurement. In human subjects, areas of CH2 peaks at 2.1 and 1.3 ppm were linearly correlated (slope, 0.172; r = 0.991), as were the 0.9 ppm CH3 and 1.3 ppm CH2 peaks (slope, 0.125; r = 0.989). The 2.75 ppm CH2 peak represented 0.6% of the total fat signal in high-liver-fat subjects. These values predict that 8.6% ofm the total fat signal overlies the water peak. The triglyceride model can characterize human liver fat spectra. This allows more accurate determination of liver fat fraction from MRI and MRS.
Keywords: liver, 1H MRS, triglyceride, quantification, NAFLD, fat fraction
INTRODUCTION
The liver plays a critical role in the regulation of metabolic homeostasis. Derangements in liver function can lead to abnormal intrahepatic triglyceride storage, resulting in fatty liver disease. 1H MRS is one method used for the measurement of intrahepatic fat in vivo noninvasively (1), and is increasingly being used as an endpoint in clinical trials and observational studies (2–7).
Each of the multiple resonance peaks present in the fat 1H MR spectrum (Fig. 1) represents a structurally distinct proton moiety (Table 1) (8,9). However, because of insufficient spectral resolution at clinical field strengths, resolution of the individual components of the main clinically observed fat peaks 4 and 5 is not possible, with the observed ppm values of these peaks representing the weighted position of the individual resonances. In addition, the 4.2 and 5.3 ppm fat peaks partially overlap and are not clearly distinguishable from the 4.7 ppm liver water peak. Misclassification of the 4.2 and 5.3 ppm fat peaks as water signal leads to fat quantification error (4).
Figure 1.

Microlipid® fat–water emulsion phantom MR spectrum (left) and in vivo liver MR spectrum from a human subject with fatty liver (right) at 3 T (TR = 3500 ms, TE = 10 ms). Fat peak assignment: 1, –CH=CH– and –CH–O–CO–; 2, –CH2–O–CO–; 3, –CH=CH–CH2–CH=CH–; 4, –CO–CH2–CH2– and –CH2–CH= –CH–CH2–; 5, –CO–CH2–CH2– and –(CH2)n–; 6, –(CH2)n–CH3. Of the six fat peaks resolvable by spectroscopy at 3 T, in vivo two peaks (peaks 1 and 2) are buried within the water peak, and one peak (peak 3) is small and is rarely seen in the human liver clinically.
Table 1.
Peak assignments of triglyceride MR with chemical shifts at body temperature
| Peak | Location (ppm) | Assignment | Type | Relative magnitude | Observed ppm |
|---|---|---|---|---|---|
| 1 | 5.29 | –CH=CH– | Olefinic | ndb × 2 | 5.3 |
| 5.19 | –CH–O–CO– | Glycerol | 1 | ||
| Water | 4.70 | H2O | – | – | 4.7 |
| 2 | 4.20 | –CH2–O–CO– | Glycerol | 4 | 4.2 |
| 3 | 2.75 | –CH=CH–CH2–CH=CH– | Diacyl | nmidb × 2 | 2.75 |
| 4 | 2.24 | –CO–CH2–CH2– | α-Carboxyl | 6 | 2.1 |
| 2.02 | –CH2–CH=CH–CH2– | α-Olefinic | (ndb − nmidb) × 4 | ||
| 5 | 1.60 | –CO–CH2–CH2– | β-Carboxyl | 6 | 1.3 |
| 1.30 | – (CH2)n– | Methylene | [(CL-4) × 6] − (ndb × 8) + (nmidb × 2) | ||
| 6 | 0.90 | –(CH2)n–CH3 | Methyl | 9 | 0.9 |
ndb, number of double bonds; nmidb, number of methylene-interrupted double bonds.
Characterization of the complete liver fat spectrum is important not only for accurate fat quantification using 1H MRS, but also for accurate quantification using MRI-based measurement techniques that incorporate the multipeak spectral structure of hepatic triglycerides. Unlike single-voxel spectroscopy, these techniques allow regional heterogeneity to be examined in a single scan. However, as these techniques cannot measure the fat spectrum directly, they require the incorporation of the actual 1H MR spectrum. To generate an accurate liver fat fraction value, it is vital that the correct spectral model is used (10–12).
The types of triglyceride in the liver can be measured directly biochemically (13,14) or with high-field (500 MHz) NMR (4). However, these techniques require invasive tissue sample collection, which is impractical for large numbers of human subjects. A noninvasive, more practical approach is to perform in vivo spectroscopy at clinical field strength (3 T) and use the knowledge of the triglyceride chemical structure to determine the fat spectrum. Similar techniques have been employed in the food industry to confirm food oil purity (8,15–17).
The chemical structure of a typical triglyceride is shown in Fig. 2. The relative magnitude of each of the resonances can be specified by three variables: number of –CH=CH– double bonds per molecule (ndb), number of double bonds separated by a single CH2 (nmidb, number of methylene-interrupted double bonds) and the fatty acid chain length (CL) (Table 1) (8,17,18). This method has been used successfully in human subjects to determine the type of triglyceride in adipose tissue and bone marrow at high field, both ex vivo and in vivo (18,19). Importantly, fat peak areas measurable at clinical field strengths (at 0.9, 1.3, 2.1 and 2.75 ppm) alone suffice to determine ndb, nmidb and CL, from which the relative magnitudes of the nonmeasurable 4.2 and 5.3 ppm fat peaks can be derived, and the complete liver 1H MR spectrum can be defined.
Figure 2.
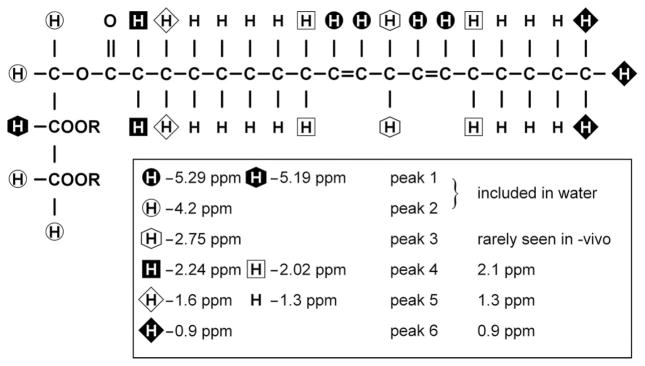
Diagrammatic representation of typical triglyceride molecule. The chain shown is linoleic acid. R indicates the other fatty acid chains in the triglyceride. Several resonances (at 5.29 and 5.19 ppm; 2.20 and 2.02 ppm; 1.6 and 1.3 ppm) are not resolvable in vivo at clinical field strengths (≤ 3 T) and appear as single peaks.
The purpose of this study was to characterize the complete fat MR spectrum of human liver by determining the magnitude of nonmeasurable fat peaks directly from measurable fat peaks and a knowledge of the chemical structure of triglycerides. The approach was validated in a fat–water emulsion phantom before the spectrum was determined in human subject studies.
METHODS
Overview
This was a prospective, single-site study approved by our Institutional Review Board and compliant with the Health Insurance Portability and Accountability Act. Adult subjects gave informed consent, and pediatric subjects gave assent with parental informed consent.
All phantom and in vivo 1H MR spectra were acquired at 3 T (GE Signa EXCITE HD, GE Healthcare, Waukesha, WI, USA). A 20 × 20 × 20 mm3 voxel was selected and shimmed after conventional imaging. The stimulated echo acquisition mode (STEAM) sequence (acquisition bandwidth, 5 kHz) was chosen to allow a shorter minimum TE (20), minimizing J-coupling effects. Five spectra were acquired consecutively at progressively longer TEs of 10, 15, 20, 25 and 30 ms in a single acquisition. The mixing time for the STEAM sequence was fixed at a minimum value of 5 ms. The mixing time and range of TE values were also chosen to minimize J-coupling effects (21). TR = 3500 ms was chosen to minimize T1 effects. Multi-TE acquisition allowed the calculation of T2 and the T2-corrected area of individual spectral peaks, as the different fat peaks have different T2 values (18,22). There was no water saturation, and spatial saturation bands around the voxel were disabled to ensure a uniform spectral response across the frequency range of interest.
A single experienced observer analyzed the spectra using the AMARES algorithm (23) included in the MRUI software package (24). All the observed or measurable fat peaks were modeled by multiple Gaussian resonances. The 1.3 ppm peak was modeled by three Gaussians; the fat peaks at 2.1 and 0.9 ppm were each modeled by two Gaussians, and the 2.7 ppm peak was modeled by a single Gaussian. The water and fat peaks in the 4–6 ppm range were modeled by five unconstrained Gaussians (that is the amplitude, linewidth and frequency of the peaks were all fitted freely). The T2 values of the spectral peaks and the T2-corrected peak areas were calculated by nonlinear least-squares fitting that minimized the difference between the observed peak areas and the values given by theoretical decay.
Phantom study
The experimentally measured spectrum of a fat–water emulsion phantom (Microlipid®, Nestle HealthCare Nutrition, Inc., Minne-tonka, MN, USA; used under license agreement with Covidien AG) was compared with that given by the proposed chemical structure approach. Microlipid® was chosen because the distribution of fatty acid chains in its constituent triglycerides was provided by the manufacturer.
The relative area of each of the peaks was found by adding the number of hydrogen nuclei with that type of bond in the triglyceride molecule. For example, each of the three fatty acid chains was terminated by a CH3 group, giving a total signal of 9 signal units for the 0.9 ppm peak. Similarly, as each double bond had two CH groups associated with it, the 5.3 ppm peak was given by 2 × ndb. However, as virtually all fats are mixtures of different triglycerides, for each of the constituent triglycerides the number of hydrogen nuclei was weighted by the molecular fraction of the triglyceride type to give a mean CL, ndb and nmidb.
According to the manufacturer, the distribution of fatty acid types in the Microlipid® fat–water emulsion is equivalent to a mean fat molecule with CL = 17.86, ndb = 5.04 and nmidb = 2.35. Using these CL, ndb and nmidb values in the spectral model described in Table 1, theoretical peak areas of the phantom were calculated (Table 2).
Table 2.
T2 values and measured and reported peak areas for Microlipid® fat–water emulsion phantom
| Peak | Observed ppm | Reported area | T2 (ms) | Measured peak area |
|---|---|---|---|---|
| 1 | 5.3 | 0.207 | 38.7 | 0.212 |
| 2 | 4.2 | 0.075 | 25.4a | 0.097a |
| 3 | 2.75 | 0.088 | 41.5 | 0.086 |
| 4 | 2.1 | 0.314 | 41.9 | 0.307 |
| 5 | 1.3 | 1.000 | 46.0 | 1.000 |
| 6 | 0.9 | 0.168 | 71.4 | 0.161 |
Values unreliable as a result of J coupling.
STEAM MRS was performed on the Microlipid® phantom using a head coil with eight signal averages and one pre-acquisition excitation. When fitting the phantom spectra, all the Gaussians peaks were left unconstrained. The T2-corrected areas of the individual fat peaks were expressed as a fraction of the T2-corrected area of the main CH2 (1.3 ppm) peak. The measured peak areas from spectroscopy were compared with the reported peak areas calculated according to the chemical structure, given in Table 1.
In vivo human study
One hundred and thirty-six human subjects were recruited from clinical nonalcoholic fatty liver disease (NAFLD) studies being conducted at our institution. These subjects either had biopsy-proven NAFLD, or were at risk for NAFLD because of family history or obesity. Fifteen subjects with known liver disease other than NAFLD were excluded from the study. The remaining 121 subjects (42 adult males, 57 adult females, 17 pediatric males and five pediatric females), with mean ages of 44.3 years (adult subjects) and 14.2 years (pediatric subjects), were enrolled and underwent research MR examinations of the liver between August 2008 and March 2009. As most of these subjects had no liver biopsy taken, differentiation between those with simple steatosis and steatohepatitis was not attempted.
Using multiplanar localization images, a 20 ×20 ×20 mm3 voxel was selected within the right lobe of the liver parenchyma which avoided the liver edges as well as large biliary or vascular structures. Following shimming during free breathing, STEAM spectroscopy was performed with an eight-channel torso array coil. Following a single pre-acquisition excitation, five spectra were acquired with a single average at each TE in a single 21 s breath hold. The spectra from the individual channels were combined using a singular value decomposition-based approach (25). For each subject, this procedure was repeated twice more with identical parameters. Thus, a total of three colocalized multi-TE spectra were acquired for each subject.
As the liver spectra had a lower signal-to-noise ratio than the Microlipid® phantom, in the MRUI fitting of the spectra, the frequency of the fat peaks was fixed relative to the main CH2 peak at 1.3 ppm. T2 decay was assumed to be monoexponential. It is assumed that the TE range used is sufficiently short such that any errors introduced by J-coupling are small and can be ignored. For each of the three multi-TE spectra, the water peak and measurable fat peaks 4, 5 and 6 were corrected for T2 decay. The T2-corrected areas of peaks 4, 5 and 6 were averaged over the three spectra acquired for each subject.
In vivo examinations showed that fat peaks 1 and 2 were not measurable because of the superimposed water peak. In subjects with low liver fat levels, T2 values of peaks 4 and 6 were difficult to estimate precisely. In these cases, peak areas were determined by correcting the TE = 10 ms spectrum using a mean T2 value derived from the subjects whose T2 value could be determined.
Peak 3 was only detectable in subjects with the greatest levels of fat in the liver because of the low levels of polyunsaturated fat in the liver. Thus, subjects with a T2-corrected peak area of CH2 (1.3 ppm) greater than 40% of the T2-corrected water peak area were used to describe the behavior of this peak relative to the other fat peaks. It was then assumed that this behavior was typical for all subjects.
The relative areas of measurable fat peaks (peaks 3–6) were used to generate mean ndb, nmidb and CL values for a ‘mean’ liver triglyceride molecule. This allowed the area of peaks 1 and 2 to be calculated, giving the fraction of the fat signal buried under the water peak.
Statistical analysis
The T2-corrected areas of peaks 4 and 6 were plotted with respect to the T2-corrected areas of peak 5. Linear least-squares fits of the data were calculated and the quality of fit was evaluated by the Pearson correlation coefficient r to examine the variability in the ratio of the peak areas seen in the liver.
RESULTS
Table 2 compares the T2-corrected peak areas of the Microlipid® fat–water emulsion phantom given by spectroscopy with those given by our theoretical model. There is strong agreement between theoretically predicted and experimental values, except for peak 2. Using the T2-corrected areas of peaks 3–6 of the phantom in our theoretical model gives CL = 18.44, ndb = 5.19 and nmidb = 2.40 (compared with reported values of CL =17.86, ndb = 5.04 and nmidb = 2.35). The CL, ndb and nmidb values generated from peaks 3–6 give an expected peak 1 area of 0.204, in close agreement with measurement and reported peak areas. The measured area of peak 2 does not match that theoretically predicted or that generated using peaks 3–6. This peak is strongly J-coupled, resulting in T2 underestimation and, hence, peak area overestimation.
Figure 3 compares the T2-corrected areas of peaks 5 and 6 in vivo. There is a strong linear correlation (r = 0.989) between the two values, with a ratio of the peak area values of 0.125 (p <0.0001: intercept, 0.000; p = 0.34). Figure 4 compares the T2-corrected areas of peaks 4 and 5 in vivo. This shows that the ratio of the areas of peak 4 to peak 5 is 0.172 (p <0.0001: intercept, −0.001; p = 0.07), and again there is strong linear correlation (r = 0.991) between the two values. There were only four subjects in the study with T2-corrected peak 4 area fat ratios of 40% or above (fat fractions: 0.368, 0.392, 0.409 and 0.443). In these subjects, the mean T2-corrected area of peak 3 (2.75 ppm) was determined to be 0.9% (range, 0.7–1.1%) of that of the T2-corrected area of peak 5.
Figure 3.

Comparison of peak 6 area (CH3 at 0.9 ppm) with peak 5 area (CH2 at 1.3 ppm) in pediatric and adult human subjects. There is strong correlation between these two peak areas, with peak 6 being 12.5% of the area of peak 5.
Figure 4.

Comparison of peak 4 area (CH2 at 2.1 ppm) with peak 5 area (CH2 at 1.3 ppm) in pediatric and adult human subjects. There is strong correlation between these two peak areas, with peak 4 being 17.2% of the area of peak 5.
Using these relative peak areas in the model given in Table 1, the mean liver triglyceride molecule had the following parameters: CL = 17.45, ndb = 1.92 and nmidb = 0.32. Assuming that fat consists entirely of saturated, monounsaturated and diunsaturated fatty acid chains (18), human liver fat is about 46.8% saturated, 42.6% monounsaturated and only 10.6% diunsaturated.
The mean human liver spectrum, including the calculated areas of the peaks underlying water or those unresolvable in vivo, is shown in Table 3. This model indicates that the fraction of fat under the water peak (peaks 1 and 2) is 8.6% of the sum of all the fat peaks. Using this correction, the mean fat fraction in our subject group was 0.107, with values ranging from 0.004 to 0.443.
Table 3.
The liver fat spectrum, using the areas of peaks 3–6 to extrapolate the areas of peaks 1 and 2 and the full fat spectrum
| Peak | Observed ppm | T2 (ms) | Percent of total fat signal | Location (ppm) | Percent of total fat signal |
|---|---|---|---|---|---|
| 1 | 5.3 | – | 4.7 | 5.29 | 3.7 |
| 5.19 | 1.0 | ||||
| Water | 4.7 | 23 | – | 4.70 | – |
| 2 | 4.2 | – | 3.9 | 4.20 | 3.9 |
| 3 | 2.75 | 51 | 0.6 | 2.75 | 0.6 |
| 4 | 2.1 | 52 | 12.0 | 2.24 | 5.8 |
| 2.02 | 6.2 | ||||
| 5 | 1.3 | 62 | 70.0 | 1.60 | 5.8 |
| 1.30 | 64.2 | ||||
| 6 | 0.9 | 83 | 8.8 | 0.90 | 8.8 |
DISCUSSION
In this phantom–human study, a molecular structure-based method for MRS characterization was validated in a mixed fat emulsion phantom of known composition. We applied this method to human subjects to determine a mean liver fat MR spectrum, including the peaks not directly measurable in vivo.
The phantom study shows that the theoretical model accurately derives the complete fat–water emulsion MR spectrum, with the exception of peak 2 (4.2 ppm), for which the theoretical and measured peak areas do not match. Peak 2 is a strongly coupled AB spin system (9), meaning that its behavior is strongly affected by J-coupling even at short TEs (26), leading to T2 underestimation and peak area overestimation (27). However, from Table 1, peak 2 has a fixed relative magnitude of four, and thus can be deduced from other peak areas and does not require accurate measurement. Thus, we conclude that it is valid to deduce the entire fat spectrum from the peaks that are resolvable from water.
There have only been limited in vivo measurements of liver T2 at 3 T, as multi-TE spectroscopy at 3 T is not common. Guiu et al. (28) reported the T2 value of water as 27.0 ms and the T2 value of the CH2 (1.3 ppm) peak as 60 ms. These values are in agreement with our observations. The liver fatty acid profile is different from that seen for the fat–water emulsion, as well as from that reported previously in adipose tissue and bone marrow (18,29), which show a higher fraction of diunsaturated fatty acid chains. This suggests that different human fat depots may have different spectral profiles.
Our results suggest that, regardless of the level of fat deposition, there may only be limited variation in the liver fat spectrum. As shown in Figs 3 and 4, when the area of peak 4 or 6 is compared with the area of peak 5, we find similar Pearson correlation coefficients r. Although peak 6 has a fixed relative magnitude, peak 4 is more sensitive to changes in CL and ndb. The similar levels of scatter suggest that the variability is mainly a result of noise rather than biochemical causes. The strong correlation between the fat peak areas also suggests that it is acceptable to use the relative area of peak 3 in high-fat subjects as the value for all subjects.
In this study, it was not possible to distinguish between isolated steatosis and steatohepatitis. However, there is no indication of two different population behaviors when comparing the spectral peak areas in Figs 3 and 4, as would be expected if NAFLD had a different spectral profile from steatohepatitis. This suggests that the fat spectrum is similar for the two conditions, although further work is required to confirm this.
By performing high-field MRS ex vivo of liver biopsy samples from six subjects, Longo et al. (4) estimated that peaks 1 and 2 contained 15% of the total fat signal. Their 15% value has been widely used to correct for inferred fat under the water peak (7,30–32), but differs considerably from the value of 8.6% derived from our study. From Table 1, the fat under the water peak is equal to 2 × ndb + 5. For CLs between 16 and 18, 15% fat under the water peak would require an ndb of about 5. However, in the human body, multiple double bonds in a single fatty acid chain are always separated by a single CH2. Thus, if ndb = 5, nmidb must be two or more. This would give a relative area of peak 3 (2.75 ppm) of four, which would be visible at lower fat levels, which is contrary to our observation. Thus, the theoretical model contradicts the 15% value estimated by Longo et al. (4).
A previous study calculated the saturation and polyunsaturation indices of liver fat in vivo at clinical field strengths (33). As opposed to our observation that liver fat composition is independent of fat content, this study found differences in these indices in the liver of lean vs obese subjects. However, entering their indices for normal subjects into our model gives a nonphysical solution (ndb ≈ 5.7, nmidb ≈ 4.8). This may be because they collected data at a single TE (30 ms) and thus could not correct for the T2 effect, or signals from metabolites could have been erroneously identified as fat (34).
For in vivo human liver fat 1H MRS characterization, all of the main fat peaks should be identified correctly. Misidentification of fat peaks will affect the estimation of ndb and nmidb values, and hence will give an incorrect measure of the triglyceride types present. This is challenging at 1.5 T as the peaks are wider (in ppm) at 1.5 T than at 3 T, and so overlap more, making it more difficult to measure accurately the individual fat peaks.
Accurate quantification using MRI-based measurement techniques requires the incorporation of the multipeak spectral structure of hepatic triglyceride. This is generally generated by liver 1H MRS, although Yu et al. (10) incorporated the spectral frequencies of triglyceride in imaging-based methods in an attempt to measure the multipeak spectral structure directly. The use of an incorrect spectral model will introduce errors in the fat fraction estimated by these imaging methods. As the liver spectrum derived in this study differs from that seen in the fat–water emulsion phantom or adipose tissue (18,29), imaging techniques that derive their spectral model from these sources may give incorrect liver fat fraction estimates. Similarly, the spectrum detailed here is only applicable in the liver. The use of the spectrum detailed here in adipose tissue may lead to errors in the overestimation of the fraction of water. For greatest accuracy, MRI-based measurement techniques should use a different spectrum depending on the depot of fat being examined, although this may prove to be impractical. However, as this study shows that the liver fat spectrum appears to be independent of fat fraction, it is valid to assume a single, MRS-based spectrum of liver fat for liver MRI. The spectrum derived in this article is applicable at all field strengths, although the T2 values are only applicable at 3 T.
For the absolute quantification of fat fraction using 1H MRS, correction for fat included in the (apparent) water signal is only one of several factors requiring consideration. Correction for T1 and T2 relaxation is also required. All fat peaks exhibit J-coupling, which depends not only on the sequence used, but on the parameters selected, such as the TE range and mixing time (9,21,27). Fat peaks have different T2 values from water, and modeling the water peak containing fat signals using a single TE may introduce bias. A fraction of water is bound to protein and is invisible to standard MRS sequences. The differing proton density of water and fat requires further correction and, to express fat as a fraction of liver mass, the amount of material which is neither fat nor water must also be known (3).
The sequence used in this study was primarily designed to accurately and rapidly quantify the liver fat fraction. As peak 3 (CH2 at 2.75 ppm) is only detected at the highest fat levels, our nmidb value will be measurable only at the highest fat levels, and hence may be biased towards high-fat subjects, as we were unable to monitor changes in nmidb with fat fraction. However, large relative changes in peak 3 will only produce small changes in the spectrum as a whole, and therefore it is not expected that the liver fat fraction estimates will be affected significantly.
Further, at low fat levels (<5%), the sequence used in this study may not accurately determine the fat peak area ratios. Thus, one limitation of this study is that it cannot determine whether the fat spectrum at low fat levels is different from that seen at higher fat levels. Our fat spectrum may be biased towards the fat spectrum of individuals with higher levels of liver fat.
Although the multi-TE approach used in this study is important for water T2 correction to allow fat fraction measurement, it may not be as well suited for fat spectrum measurement. The longer fat T2 values reduce the need for fat T2 measurement, and a single multi-average spectrum at short TE may be more suitable for fat spectrum determination.
The subject population examined was limited to those with known or suspected NAFLD. The triglyceride profile of subjects with fatty liver with different etiologies, such as alcoholic or viral hepatitis, was not examined in this study. It is therefore possible that these subjects may have a different spectral profile from that seen in NAFLD.
CONCLUSIONS
This study shows that it is possible to use measurable 1H MRS fat peaks in vivo to characterize mean liver triglyceride and hence to derive the complete liver fat MR spectrum. This molecular structure-based method for fat spectral characterization will allow more accurate quantification of liver fat using MRS and MRI methods that incorporate spectral correction.
Acknowledgments
This work was performed as an ancillary study (#AS009) of the Nonalcoholic Steatohepatitis Clinical Research Network (NASH CRN). NASH CRN is supported by the National Institute of Diabetes and Digestive and Kidney Diseases (NIDDK) (UCSD #1U01DK061734, Data Coordinating Center #5U01DK061730) and the National Institute of Child Health and Human Development (NICHD).
This work was funded in part by grants from the National Institutes of Health, including R01 DK071486 from the National Institute of Diabetes and Digestive and Kidney Diseases, P60 MD00220 for the San Diego EXPORT Center from the National Center of Minority Health and Health Disparities, and M01 RR000827 from the National Center for Research Resources for the General Clinical Research Center at UCSD.
Abbreviations used
- CL
chain length
- NAFLD
nonalcoholic fatty liver disease
- ndb
number of double bonds
- nmidb
number of methylene-interrupted double bonds
- STEAM
stimulated echo acquisition mode
References
- 1.Charatcharoenwitthaya P, Lindor KD. Role of radiologic modalities in the management of non-alcoholic steatohepatitis. Clin Liver Dis. 2007;11:37–54. doi: 10.1016/j.cld.2007.02.014. [DOI] [PubMed] [Google Scholar]
- 2.Longo R, Ricci C, Masutti F, Vidimari R, Crocé LS, Bercich L, Tiribelli C, Dalla Palma L. Fatty infiltration of the liver. Quantification by 1H localized magnetic resonance spectroscopy and comparison with computed tomography. Invest Radiol. 1993;28:297–302. [PubMed] [Google Scholar]
- 3.Thomsen C, Becker U, Winkler K, Christoffersen P, Jensen M, Henriksen O. Quantification of liver fat using magnetic resonance spectroscopy. Magn Reson Imaging. 1994;12:487–495. doi: 10.1016/0730-725x(94)92543-7. [DOI] [PubMed] [Google Scholar]
- 4.Longo R, Pollesello P, Ricci C, Masutti F, Kvam BJ, Bercich L, Crocè LS, Grigolato P, Paoletti S, de Bernard B, Tiribelli C, Dalla Palma L. Proton MR spectroscopy in quantitative in vivo determination of fat content in human liver steatosis. J Magn Reson Imaging. 1995;5:281–285. doi: 10.1002/jmri.1880050311. [DOI] [PubMed] [Google Scholar]
- 5.Szczepaniak LS, Babcock EE, Schick F, Dobbins RL, Garg A, Burns DK, McGarry JD, Stein DT. Measurement of intracellular triglyceride stores by 1H spectroscopy: validation in vivo. Am J Physiol. 1999;276:E977–E989. doi: 10.1152/ajpendo.1999.276.5.E977. [DOI] [PubMed] [Google Scholar]
- 6.Schwimmer JB, Middleton MS, Deutsch R, Lavine JE. A phase 2 clinical trial of metformin as a treatment for non-diabetic paediatric non-alcoholic steatohepatitis. Aliment Pharmacol Ther. 2005;21:871–879. doi: 10.1111/j.1365-2036.2005.02420.x. [DOI] [PubMed] [Google Scholar]
- 7.Szczepaniak LS, Nurenberg P, Leonard D, Browning JD, Reingold JS, Grundy S, Hobbs HH, Dobbins RL. Magnetic resonance spectroscopy to measure hepatic triglyceride content: prevalence of hepatic steatosis in the general population. Am J Physiol Endocrinol Metab. 2005;288:E462–E468. doi: 10.1152/ajpendo.00064.2004. [DOI] [PubMed] [Google Scholar]
- 8.Fauhl C, Reniero F, Guillou C. 1H NMR as a tool for the analysis of mixtures of virgin olive oil with oils of different botanical origin. Magn Res Chem. 2000;38:436–443. [Google Scholar]
- 9.Oostendorp M, Engelke UF, Willemsen MA, Wevers RA. Diagnosing inborn errors of lipid metabolism with proton nuclear magnetic resonance spectroscopy. Clin Chem. 2006;52:1395–1405. doi: 10.1373/clinchem.2006.069112. [DOI] [PubMed] [Google Scholar]
- 10.Yu H, Shimakawa A, McKenzie CA, Brodsky E, Brittain JH, Reeder SB. Multiecho water–fat separation and simultaneous R2* estimation with multifrequency fat spectrum modeling. Magn Reson Med. 2008;60:1122–1134. doi: 10.1002/mrm.21737. [DOI] [PMC free article] [PubMed] [Google Scholar]
- 11.Bydder M, Yokoo T, Hamilton G, Middleton MS, Chavez AD, Schwimmer JB, Lavine JE, Sirlin CB. Relaxation effects in the quantification of fat using gradient echo imaging. Magn Reson Imaging. 2008;26(3):347–359. doi: 10.1016/j.mri.2007.08.012. [DOI] [PMC free article] [PubMed] [Google Scholar]
- 12.Yokoo T, Bydder M, Hamilton G, Middleton MS, Gamst AC, Wolfson T, Hassanein T, Patton HM, Lavine JE, Schwimmer JB, Sirlin CB. Non-alcoholic fatty liver disease: diagnostic and fat-grading accuracy of low-flip-angle multiecho gradient-recalled-echo MR imaging at 1. 5 T. Radiology. 2009;251:67–76. doi: 10.1148/radiol.2511080666. [DOI] [PMC free article] [PubMed] [Google Scholar]
- 13.Singer P, Gnauck G, Honigmann G, Stolz P, Schliack V, Thoelke H, Kettler LH, Buntrock P. Fatty acid composition of liver triglycerides in various stages of fat deposition in the parenchyma. Acta Diabetol Lat. 1974;11:32–42. doi: 10.1007/BF02581936. [DOI] [PubMed] [Google Scholar]
- 14.Araya J, Rodrigo R, Videla LA, Thielemann L, Orellana M, Pettinelli P, Poniachik J. Increase in long-chain polyunsaturated fatty acid n−6/n−3 ratio in relation to hepatic steatosis in patients with non-alcoholic fatty liver disease. Clin Sci (Lond) 2004;106:635–643. doi: 10.1042/CS20030326. [DOI] [PubMed] [Google Scholar]
- 15.Sacchi R, Addeo F, Paolillo L. 1H and 13C NMR of virgin olive oil: an overview. Magn Res Chem. 1997;35:S133–S145. [Google Scholar]
- 16.García-González DL, Mannina L, D’Imperio M, Segre AL, Aparicio R. Using 1H and 13C NMR techniques and artificial neural networks to detect the adulteration of olive oil with hazelnut oil. Eur Food Res Technol. 2004;219:545–548. [Google Scholar]
- 17.Brescia MA, Sacco A. High-resolution 1H nuclear magnetic resonance in the study of oils. In: Webb GA, editor. Modern Magnetic Resonance. Springer; Dordrecht: 2006. pp. 1645–1650. [Google Scholar]
- 18.Ren J, Dimitrov I, Sherry AD, Malloy CR. Composition of adipose tissue and marrow fat in humans by 1H NMR at 7 Tesla. J Lipid Res. 2008;49:2055–2062. doi: 10.1194/jlr.D800010-JLR200. [DOI] [PMC free article] [PubMed] [Google Scholar]
- 19.Zancanaro C, Nano R, Marchioro C, Sbarbati A, Boicelli A, Osculati F. Magnetic resonance spectroscopy investigations of brown adipose tissue and isolated brown adipocytes. J Lipid Res. 1994;35:2191–2199. [PubMed] [Google Scholar]
- 20.Keevil SF. Spatial localization in nuclear magnetic resonance spectroscopy. Phys Med Biol. 2006;51:R579–R636. doi: 10.1088/0031-9155/51/16/R01. [DOI] [PubMed] [Google Scholar]
- 21.De Graff RA, Rothman DL. In vivo detection and quantification of scalar coupled 1H NMR resonances. Concepts Magn Reson. 2001;13:32–76. [Google Scholar]
- 22.Querleux B, Cornillon C, Jolivet O, Bittoun J. Anatomy and physiology of subcutaneous adipose tissue by in vivo magnetic resonance imaging and spectroscopy: relationships with sex and presence of cellulite. Skin Res Technol. 2002;8:118–124. doi: 10.1034/j.1600-0846.2002.00331.x. [DOI] [PubMed] [Google Scholar]
- 23.Vanhamme L, van den Boogaart A, Van Huffel S. Improved method for accurate and efficient quantification of MRS data with use of prior knowledge. J Magn Reson. 1997;129:35–43. doi: 10.1006/jmre.1997.1244. [DOI] [PubMed] [Google Scholar]
- 24.Naressi A, Couturier C, Devos JM, Janssen M, Mangeat C, de Beer R, Graveron-Demilly D. Java-based graphical user interface for the MRUI quantitation package. MAGMA. 2001;12:141–152. doi: 10.1007/BF02668096. [DOI] [PubMed] [Google Scholar]
- 25.Bydder M, Hamilton G, Yokoo T, Sirlin CB. Optimal phased-array combination for spectroscopy. Magn Reson Imaging. 2008;26:847–850. doi: 10.1016/j.mri.2008.01.050. [DOI] [PMC free article] [PubMed] [Google Scholar]
- 26.Thompson RB, Allen PS. Response of metabolites with coupled spins to the STEAM sequence. Magn Reson Med. 2001;45:955–965. doi: 10.1002/mrm.1128. [DOI] [PubMed] [Google Scholar]
- 27.Hamilton G, Middleton MS, Bydder M, Yokoo T, Schwimmer JB, Kono Y, Patton HM, Lavine JE, Sirlin CB. The effect of PRESS and STEAM sequences on magnetic resonance spectroscopic liver fat quantification. J Magn Reson Imaging. 2009;20:145–152. doi: 10.1002/jmri.21809. [DOI] [PMC free article] [PubMed] [Google Scholar]
- 28.Guiu B, Loffroy R, Petit JM, Aho S, Ben Salem D, Masson D, Hillon P, Cercueil JP, Krause D. Mapping of liver fat with triple-echo gradient echo imaging: validation against 3.0-T proton MR spectroscopy. Eur Radiol. 2009;19:1786–1793. doi: 10.1007/s00330-009-1330-9. [DOI] [PubMed] [Google Scholar]
- 29.Field CJ, Angel A, Clandinin MT. Relationship of diet to the fatty acid composition of human adipose tissue structural and stored lipids. Am J Clin Nutr. 1985;42:1206–1220. doi: 10.1093/ajcn/42.6.1206. [DOI] [PubMed] [Google Scholar]
- 30.Fischbach F, Bruhn H. Assessment of in vivo 1H magnetic resonance spectroscopy in the liver: a review. Liver Int. 2008;28:297–307. doi: 10.1111/j.1478-3231.2007.01647.x. [DOI] [PubMed] [Google Scholar]
- 31.Kechagias S, Ernersson A, Dahlqvist O, Lundberg P, Lindström T, Nystrom FH. Fast-food-based hyper-alimentation can induce rapid and profound elevation of serum alanine aminotransferase in healthy subjects. Gut. 2008;57:649–654. doi: 10.1136/gut.2007.131797. [DOI] [PMC free article] [PubMed] [Google Scholar]
- 32.Nimitphong H, Phongkitkarun S, Rattarasarn C, Kongsooksai A, Chanprasertyothin S, Bunnag PA, Puavilai G. Hepatic fat content is a determinant of postprandial triglyceride levels in type 2 diabetes mellitus patients with normal fasting triglyceride. Metabolism. 2008;57:644–649. doi: 10.1016/j.metabol.2007.12.008. [DOI] [PubMed] [Google Scholar]
- 33.Johnson NA, Walton DW, Sachinwalla T, Thompson CH, Smith K, Ruell PA, Stannard SR, George J. Noninvasive assessment of hepatic lipid composition: advancing understanding and management of fatty liver disorders. Hepatology. 2008;47:1513–1523. doi: 10.1002/hep.22220. [DOI] [PubMed] [Google Scholar]
- 34.Cobbold JF, Taylor-Robinson SD, Cox IJ. In vitro proton magnetic resonance spectroscopy of liver tissue informs in vivo hepatic proton magnetic resonance spectroscopy studies. Hepatology. 2008;48:1016–1017. doi: 10.1002/hep.22453. [DOI] [PubMed] [Google Scholar]