

The mitotic chromatin spring is organized into a rosette of intramolecular loops of pericentric chromatin by condensin and cohesin. Model convolution reveals that condensin clusters along the spindle axis, while cohesin is dispersed radially along pericentromere loops.
Abstract
In mitosis, the pericentromere is organized into a spring composed of cohesin, condensin, and a rosette of intramolecular chromatin loops. Cohesin and condensin are enriched in the pericentromere, with spatially distinct patterns of localization. Using model convolution of computer simulations, we deduce the mechanistic consequences of their spatial segregation. Condensin lies proximal to the spindle axis, whereas cohesin is radially displaced from condensin and the interpolar microtubules. The histone deacetylase Sir2 is responsible for the axial position of condensin, while the radial displacement of chromatin loops dictates the position of cohesin. The heterogeneity in distribution of condensin is most accurately modeled by clusters along the spindle axis. In contrast, cohesin is evenly distributed (barrel of 500-nm width × 550-nm length). Models of cohesin gradients that decay from the centromere or sister cohesin axis, as previously suggested, do not match experimental images. The fine structures of cohesin and condensin deduced with subpixel localization accuracy reveal critical features of how these complexes mold pericentric chromatin into a functional spring.
INTRODUCTION
The mitotic spindle apparatus is composed of chromatin and microtubules that function together to accurately segregate the duplicated genome. Sister chromatids are bioriented in the spindle when they attach to the spindle microtubules from opposite spindle poles via the kinetochore. The centromere is the designated kinetochore attachment site of the chromatin and resides at the apex of an intramolecular pericentromere loop (Yeh et al., 2008) that comes under tension upon biorientation. This intramolecular loop, along with cohesin and condensin, constitutes the chromatin spring that resists the outward force of the spindle microtubules (Stephens et al., 2011). While the geometric structure of the mitotic spindle microtubules has been well studied, the fine structure of the chromatin spring has yet to be determined.
Electron microscopy (EM) studies performed in yeast reveal that 16 cylindrically arranged kinetochore microtubules, with a diameter of 250 nm, and four interpolar microtubules emanate from each spindle pole body (Winey et al., 1995; O'Toole et al., 1999). The 32 kinetochores from 16 sister chromatids cluster into two foci upon biorientation in metaphase (Goshima and Yanagida, 2000; Pearson et al., 2004). Previous work has used model convolution to understand the dynamics of kinetochore microtubules and kinetochore clustering using yeast. Computer simulations of spindle microtubules or kinetochore microtubule plus ends were convolved using the experimental objective point spread function (PSF) and compared with experimental data (Sprague et al., 2003; Gardner et al., 2005; Pearson et al., 2006; Stephens et al., 2013). Model convolution provides subpixel accuracy in predicting the position of fluorescently labeled proteins (Gardner et al., 2010). These studies were essential in determining the basic parameters that lead to mechanistic understanding of kinetochore microtubule plus-end positioning and clustering in the yeast mitotic spindle.
Cohesin and condensin are essential structural maintenance of chromosomes (SMC) protein complexes enriched in the pericentromere chromatin (Blat and Kleckner, 1999; Megee et al., 1999; Tanaka et al., 1999; Hagstrom et al., 2002; Wang et al., 2005). Both cohesin and condensin are necessary for the confinement/compaction of the pericentromere loop and spindle-length regulation (Stephens et al., 2011). However, green fluorescent protein (GFP) fusion proteins of these complexes reside in nonoverlapping positions in the pericentromere (Bachellier-Bassi et al., 2008; Stephens et al., 2011). Cohesin is radially displaced from the spindle microtubules in a cylindrical arrangement, while condensin lies proximal to the mitotic spindle and clusters of sister kinetochores. The distribution of pericentric LacO spots 6.8 kb from the centromere display a broad bilobed distribution around the spindle axis that is coincident in width with the cohesin barrel (Anderson et al., 2009; Stephens et al., 2011; Haase et al., 2012). The distribution of fluorescently tagged cohesin and condensin allows us to examine the structure of the mitotic pericentromere spring.
In this study, we utilize model convolution to determine the fine structure of pericentric cohesin and condensin in the metaphase spindle. Cohesin is best matched as a random distribution of single complexes confined to a hollow cylinder (500 nm in diameter) surrounding the interpolar spindle microtubules. Condensin is best fitted as clustered complexes that lie along the spindle axis. The nonoverlapping position of these complexes provides mechanistic insights into the function of the chromatin spring and how it contributes to force balance in the segregation apparatus.
RESULTS
Model convolution of spindle microtubules and kinetochores in mitosis
To demonstrate that model convolution can be used to determine the size of structures in the mitotic spindle, we compared experimentally obtained images of GFP-tagged proteins with simulations. Images of Tub1-GFP (spindle microtubules) and Nuf2-GFP (kinetochores) were acquired in cells marked with spindle pole bodies (Spc29-RFP). Metaphase spindles with lengths of 1.3–1.7 μm and both poles in the same image plane were aligned horizontally and analyzed for fluorescence distribution perpendicular to the spindle axis. Line scans drawn through the brightest pixel revealed that kinetochore microtubule tufts labeled with Tub1-GFP have a Gaussian distribution with a full-width half-maximum (FWHM) of 264 ± 16 nm (n = 47). Kinetochore microtubule plus-end clusters labeled with the kinetochore protein Nuf2-GFP also had a Gaussian distribution with a FWHM of 291 ± 14 nm (n = 21; Haase et al., 2012). The increase in fluorescence width perpendicular to the spindle axis is consistent with flaring of the kinetochore microtubule plus ends (Winey et al., 1995).
Cylinders of different sizes representing the distribution of each of these components were populated with fluorophores and convolved with the experimental objective PSF (Sprague et al., 2003; Quammen et al., 2008). Simulated fluorescence images were analyzed in the same manner as experimental images and then compared using a normalized maximum likelihood estimation (MLE) to determine the best match (see Materials and Methods). A spindle the size and shape of reconstructed spindles from EM and tomographic approaches was simulated (Figure 1A). The simulated spindle is 1.5 μm in length with two cylinders, representing the 16 kinetochore microtubules (250 nm in diameter and 350 nm in length) emanating from the spindle poles. The overlap region of the interpolar microtubules spans the distance between kinetochore microtubule bundles and is represented by a cylinder 800 nm in length and 130 nm in diameter (Winey et al., 1995; Gardner et al., 2008). Perpendicular line scans through the simulated kinetochore microtubule tufts were indistinguishable from the experimental images (MLE = 0.21, Gaussian FWHM of 263 ± 2 nm, n = 100 simulated vs. 264 nm experimental; Figure 1A). The plus ends of the kinetochore microtubules were simulated as cylinders 300 nm × 130 nm × 200 nm (outer diameter, inner diameter, length). The hollow center accounts for the interpolar microtubules that exclude kinetochore microtubules. Line scans produced a Gaussian distribution with a FWHM of 291 ± 3 nm (n = 100 simulated), matching experimental images of kinetochore clusters (MLE = 0.90, 291 nm experimental; Figure 1B). The simulation of input geometries accurately recapitulates the dimensions of kinetochore microtubules and kinetochore microtubule plus ends.
FIGURE 1:

The geometry of spindle components. (A) Experimental images of spindle microtubules (Tub1-GFP) were compared with simulations. Modeled spindle microtubules measured 1.5 μm in length, with two bundles of kinetochore microtubules 350 nm in length and 250 nm in diameter and interpolar microtubules spanning the interkinetochore distance (800 nm) and 130 nm in diameter (Winey et al., 1995; Gardner et al., 2008). (B) Experimental images of kinetochore clusters (Nuf2-GFP) were compared with simulations. The plus ends of the kinetochore microtubules were simulated as hollow cylinders 300 nm in outer diameter. (C) Pericentric condensin (Smc4-GFP) is best modeled as a hollow cylinder with an outer diameter of 350 nm and spanning the length of the pericentric chromatin. (D and E) Pericentric cohesin (Smc3-GFP) is best modeled as a hollow cylinder with a 500-nm mean diameter with a depicted thickness of 50 nm. The radial distance between cylinders containing cohesin and condensin is ∼75 nm. Tables 1 and 3 display values that determine best fit.
Geometric modeling of cohesin and condensin within the spindle
Experimental images of cohesin (Smc3-GFP) consistently display a bilobed distribution when viewed in sagittal section of metaphase cells (Yeh et al., 2008; Hu et al., 2011; Stephens et al., 2011; Haase et al., 2012; Figure 1D, and see Figure 3C later in the paper). Line scans perpendicular to the spindle axis yield two peaks of intensity corresponding to the bilobed organization (Figures 1D and 2). The inclusive peak-to-peak measure in sagittal section was 373 ± 63 nm (n = 48 experimental Smc3-GFP; Figure 1D). The cohesin barrel can also be measured in transverse images that give a larger peak-to-peak distance of 475 ± 62 nm (n = 51 experimental; Figure 1E). Cohesin barrel length viewed in sagittal section was measured using the distance between the half-maximum intensity from line scans taken parallel to the spindle axis. The cohesin barrel is 560 ± 118 nm in length (n = 33 experimental; Figure 1D).
FIGURE 3:
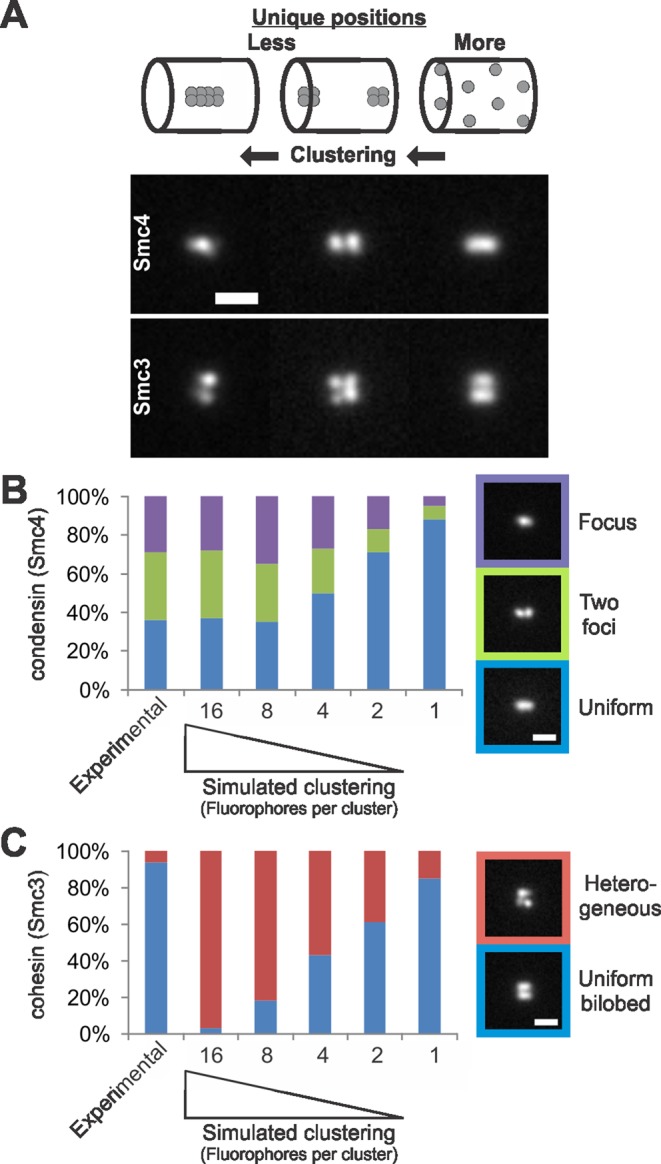
Simulations of clustering increase heterogeneity. (A) Simulations increasing fluorophore clustering (from right to left) in the best-fit condensin (Smc4, top) and cohesin barrels (Smc3, bottom). Labeling fewer positions in the cylinder results in heterogeneous images, whereas allowing each fluorophore to label a unique position produces a homogeneous image. (B and C) Simulations of clustering were performed by placing the measured number of fluorophores (240) into groups of 16, 8, 4, 2, or 1 and allowing them to randomly fill the condensin or cohesin cylinders. The result of clustering is less-unique fluorophore positions are labeled in the cylinder (15, 30, 60, 120, and 240 unique positions labeled, respectively). (B) Experimental Smc4-GFP and condensin cylinder simulations (350-nm outer diameter, 130-nm inner diameter, 700-nm length) were line scanned to determine the percentage of each fluorescence class (i.e., one focus = purple, two foci = green, uniform line = blue). (C) Experimental Smc3-GFP and cohesin cylinder simulations (500-nm central diameter, 50 nm thick, 550-nm length) were line scanned for a bilobed distribution and homogeneous lobes (blue). Images were scored as heterogeneous (red) if images were either not bilobed or did not contain homogeneous lobes. Scale bar: 1 μm.
FIGURE 2:
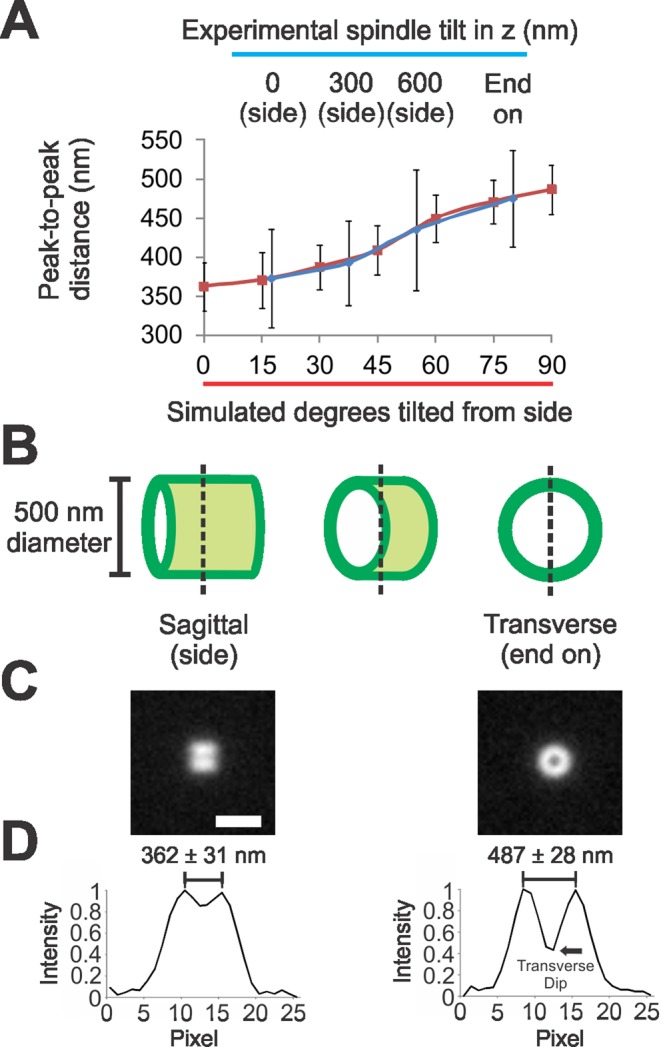
Barrel geometry predicts measurement differences between sagittal and transverse views of pericentric cohesin fluorescence. (A) Average inclusive peak-to-peak distance measurements of the cohesin barrel with different tilts in the z-plane for experimental (blue) and simulated images (red). (B) Diagram example of fluorescence view of the cohesin barrel at 0°, 45°, and 90° tilt. Notice that out-of-focus fluorescence of the barrel in the 0° tilted image (sagittal/side) will contribute to the vertical peak-to-peak distance measurement making the measurement smaller. In contrast, out-of-focus fluorescence for the 90° tilted image (transverse/end on) is aligned with the in-focus fluorescence, resulting in a more accurate measurement of barrel width. (C) Simulated images of side (left) and end-on (right) barrels. (D) Graph of vertical line scan taken through the simulated fluorescence images from (C), with the average inclusive distance between peaks noted (n = 50). Black arrow denotes transverse dip used to determine the thickness of the cohesin barrel (see Table 2). Scale bar: 1 μm.
For modeling the size and appearance of the cohesin barrel, isotropic cylinders were simulated with diameters increasing by 25-nm steps (Table 1). Experimental images of cohesin most closely resemble a simulated cylinder with a central diameter of 500 nm and length of 550 nm. Side-on (sagittal) images yield a peak-to-peak measurement 362 ± 31 nm (n = 50 simulated) compared with 373 nm (MLE = 0.99; Figure 1D and Table 1). End-on (transverse) images yield a peak-to-peak measurement of 487 ± 28 nm (n = 50 simulated) compared with 475 nm (MLE = 0.96; Figure 1E and Table 1). Simulations of a cylinder 550 nm in length yielded a half-maximum intensity distance of 559 ± 18 nm (n = 20 simulated) compared with 560 nm (MLE = 0.40; Figure 1D). The cohesin barrel length (550 nm) is shorter than the interkinetochore distance in metaphase cells (∼800 nm; Bouck and Bloom, 2007; Stephens et al., 2011).
TABLE 1:
Simulated cohesin cylinder best fit.
| 450 nm | 475 nm | 500 nm | 525 nm | 550 nm | ||||||
|---|---|---|---|---|---|---|---|---|---|---|
| Diameter | Side | End | Side | End | Side | End | Side | End | Side | End |
| Average ± SD | 303 ± 36 | 429 ± 32 | 324 ± 30 | 452 ± 26 | 362 ± 31 | 487 ± 28 | 377 ± 31 | 522 ± 26 | 415 ± 31 | 543 ± 29 |
| MLE | 0.87 | 0.90 | 0.87 | 0.90 | 0.99 | 0.96 | 0.98 | 0.81 | 0.90 | 0.76 |
All simulated diameters generate different measurements (p < 0.01); best fit is bolded.
The simulation allows us to gain insight into differences in experimental observations obtained from different perspectives of the same structure. When taking an in-focus section through the midplane of the cylinder in sagittal section, there are out-of-focus fluorophores at different positions along the z-axis that contribute to the fluorescence (Figure 2B, side, green haze). Due to the lack of resolution along the z-axis these out-of-focus fluorophores contribute to the in-focus sagittal image. The result is an underestimate of the dimensions of the cylinder walls that translates into a decrease in distance between the two actual peaks (Figure 2, A, C, and D). In contrast, in the transverse view, out-of-focus fluorophores are all aligned in x,y with in-focus fluorophores (Figure 2B, end on, no green haze). Therefore the transverse measurement is a more accurate reflection of the actual dimensions of the cohesin barrel (475-nm experimental transverse measure, 500 nm modeled; Figure 2, A and D).
To further investigate sources of error, we compared experimental and simulated images with various degrees of tilt. As the barrel is tilted from the sagittal to transverse, peak-to-peak measure will increase as less out-of-focus fluorophores contribute to the line scan (Figure 2B, dotted line). Experimental sagittal peak-to-peak distances were analyzed only in images in which both spindle poles were in focus in the same z-plane to minimize the effects of tilt. Images with increased tilt due to spindle poles being in different z planes were found to have larger peak-to-peak distances (393 ± 54 nm for 300-nm spindle tilt in z, n = 14; 435 ± 54 nm for 600-nm spindle tilt in z, n = 12; see Figure 2A, blue). Similarly, simulations of increasing tilt from sagittal view in 15° increments result in increasing peak-to-peak distances culminating with transverse, 90° tilt (n = 50 each, simulations). Simulation of tilting cylinders accurately recapitulates the experimental increases in peak-to-peak distance from tilt. The inability to achieve matching values for simulated cylinders in sagittal and transverse sections is likely due to an average experimental tilt of ∼15° (Figure 2A).
We can estimate the thickness of the barrel wall in simulation and compare it with experimental measurements. In transverse images, the dip in fluorescence is directly related to the thickness of the cohesin barrel (denoted transverse dip; Figure 2D). A smaller percentage of maximum intensity reveals a thinner cohesin barrel (1 nm–150 nm equals 44–56% of maximum intensity; Table 2). Experimental fluorescence dipped to 32 ± 14% of maximum intensity. Simulations of the cohesin barrel with thickness of 1 nm or 50 nm were within the experimentally obtained range (44–47% of maximum intensity; Table 2). This suggests that the cohesin barrel is approximately the thickness of a single cohesin ring, ∼40 nm in diameter (Anderson et al., 2002; Haering et al., 2002; Gruber et al., 2003; Surcel et al., 2008).
TABLE 2:
Simulations of a thin hollow cylinder match experimental cohesin measurements.
| Sagittal (nm) | Transverse (nm) | Transverse dip (% maximum intensity) | |||||
|---|---|---|---|---|---|---|---|
| Cohesin barrel thickness | Average | SD | Average | SD | Average | SD | In range |
| Experimental | 373 | 63 | 475 | 62 | 32 | 14 | — |
| 1 nm | 362 | 31 | 487 | 28 | 44 | 2 | Yes |
| 50 nm | 364 | 50 | 486 | 32 | 47 | 2 | Yes |
| 100 nm | 364 | 32 | 483 | 31 | 51 | 2 | No |
| 150 nm | 360 | 50 | 481 | 31 | 56 | 2 | No |
Condensin lies proximal to the spindle microtubules and spans the distance between kinetochores (Stephens et al., 2011). Line scans taken perpendicular to the spindle axis reveal condensin fluorescence is a Gaussian distribution with a FWHM of 323 ± 53 nm (n = 42 experimental Smc4-GFP; Figure 1C). Condensin does not display a bilobed appearance in WT cells (n = 42). To estimate the diameter of condensin, we generated isotropic cylinders and increased the outer diameter in increments of 25 nm. The cylinder was given an inner diameter of 130 nm to account for the interpolar microtubules that exclude chromatin from the axis (Winey et al., 1995). Experimental average size of condensin was best matched by a cylinder with an outer diameter of 350 nm (n = 100 simulated, Gaussian distribution with a FWHM of 324 ± 4 nm compared with 323 nm experimental, MLE = 0.11; Figure 1C and Table 3). The low maximum likelihood reflects the highly variable and heterogeneous experimental condensin fluorescence from cell to cell, which is not seen in cohesin. Best-fit cylinders of cohesin and condensin distributions are displaced by a radial distance of ∼75 nm ([500-nm cohesin radius − 350-nm condensin radius]/2).
TABLE 3:
Simulated condensin cylinder best fit.
| Outer diameter | 300 nm | 325 nm | 350 nm | 375 nm | 400 nm |
|---|---|---|---|---|---|
| Gaussian average ± SD | 303 ± 4 | 314 ± 4 | 324 ± 4 | 335 ± 4 | 347 ± 4 |
| MLE | 0.08 | 0.08 | 0.11 | 0.10 | 0.09 |
All simulated diameters generate different measurements (p < 0.01); best fit is bolded.
Modeling of homogeneous versus heterogeneous fluorophore distributions
Unlike cohesin, condensin appears heterogeneous. In approximately equal frequency, a single focus, two foci, or line distribution of Smc4-GFP is observed between the kinetochores (Figure 3B, experimental; Stephens et al., 2011). Heterogeneity may be caused by either a low number of molecules or clustering of molecules so that the structure is not completely filled (Figure 3A). To determine whether the heterogeneity in condensin is a result of fewer molecules than cohesin, we quantified the number of Smc4-GFP molecules in the pericentromere calibrated to a cluster of Cse4-GFP. Condensin had a 3 ± 1 ratio (n = 12) to Cse4-GFP, comparable to cohesin's 3.3 ± 1.2 ratio (Yeh et al., 2008). The number of Cse4 molecules in a kinetochore cluster in yeast was recently calibrated to 79 ± 17 molecules (Lawrimore et al., 2011). The total number of cohesin or condensin molecules in the pericentromere is between 237 and 266 molecules, ∼8 molecules per pericentromere (n = 32). Thus condensin heterogeneity versus cohesin homogeneity is not due to a difference in protein number in the pericentromere.
In simulations, we can cluster fluorophores, thus decreasing the number of unique fluorophore positions in the structure (Figure 3A). To determine whether condensin heterogeneity is the result of clustering, we simulated increasing levels of clustering and compared the results with experimental data. Cylinders randomly filled with the measured number of fluorophores (240) as single or paired appear uniform. Clustering fluorophores into groups of eight or 16 results in heterogeneity that matches experimental data (n = 100, χ2 = 0.37 and 0.97, respectively; Figure 3B). Biochemical and theoretical studies indicate that condensin functions cooperatively (Melby et al., 1998; Strick et al., 2004; Alipour and Marko, 2012), providing a possible explanation for clustering and the observed heterogeneity. In contrast, cohesin consistently appears as a bilobed structure. Cohesin homogeneity from cell to cell is best matched by randomly dispersing the known number of cohesin fluorophores (240) throughout the structure (n = 100, χ2 = 0.70; Figure 3C). Thus heterogeneity is consistent with biochemical clustering of condensin, while homogeneity indicates little or no clustering of cohesin.
Cohesin is distributed throughout the pericentromere, 100 nm from the centromere
Herein we will consider three possible gradient models of cohesin in the pericentromere that could give rise to the experimentally measured fluorescence distribution along the spindle axis (Figure 4A). Cohesin is known to load at the centromere (Blat and Kleckner, 1999; Megee et al., 1999; Tanaka et al., 1999) and migrate from loading sites (Glynn et al., 2004; Lengronne et al., 2004; D'Ambrosio et al., 2008; Hu et al., 2011). Disruption of cohesin's ATPase activity (Smc1E1158Q or Smc3E1155Q; Hu et al., 2011) results in pericentric cohesin accumulating at the centromere cluster. This evidence led Hu et al. (2011) to propose a model in which cohesin loads at the kinetochore/centromere, entraps the DNA in an ATP-dependent process, and migrates from the centromere to the pericentric chromatin. This model predicts that pericentric cohesin would be distributed in a gradient that decays from the centromere. To determine the location of the kinetochore/centromere, we plotted the position of the centromere clusters (Cse4-GFP) relative to a normalized spindle (Figure 4, B and C, I). The average distance between centromere clusters was 832 ± 183 nm in spindles 1.4–1.5 μm in length (n = 50). We generated a model of a cohesin gradient decaying from centromeres 800 nm apart (Figure 4D, I, red line) and simulated its fluorescence (Figure 4E, I, red). Simulated fluorescence intensity was measured using line scans along the lobes at 90, 80, and 50% of maximum intensity and compared with experimental data (Figure 4, A and E). Simulations of a cohesin gradient from centromeres fail to match experimental data. The 800 nm between sister centromeres is much larger than the estimated length of the barrel, 550 nm (MLE = 0.25; Figure 4E, I, and Table 4). Pericentric cohesin does not span the full interkinetochore distance and cannot be matched by simulations of a cohesin gradient decaying from the centromere.
FIGURE 4:

Modeling the distribution of cohesin molecules along the spindle axis. (A) An example line scan (green) along the lobe of an experimental image of the cohesin barrel (yellow dotted line). The experimental mean (blue) at 90, 80, and 50% maximum intensity is overlaid on to the example line scan. (B and C) Experimental data of fluorescent labels were used (D) to build different models of cohesin distributions and (E) compare simulated model fluorescence with experimental cohesin fluorescence distribution. (B) Diagram of experimental label positions (green) relative to the pericentric chromatin (black loops) in spindle. (C) Experimental data of (I) centromere clusters via Cse4-GFP, (II) sister cohesion axis via 12.5-kb LacO/LacI-GFP, and (III) pericentromere chromatin via 3.8 kb-LacO/LacI-GFP relative position in a normalized spindle (n = 36, 43, and 60 cells, respectively). (D) Experimental data (blue) were used to generate simulated gradients or cylinders (red) relative to a normalized spindle. (E) Graphs show the average change in relative intensity along the length of a cohesin barrel lobe in simulations (red, n = 50) compared with experimental (blue, n = 33). Cohesin barrels (550-nm length, 500-nm diameter, and 50 nm thick) that have been randomly filled with the measured number of fluorophores (240), best recapitulate experimental cohesin fluorescence along the barrel (MLE = 0.80–1.01; see Table 4). Scale bar: 1 μm.
TABLE 4:
Simulations of cohesin fluorescence distributions.
| Width at 90% maximum | Width at 80% maximum | Width at 50% maximum | ||||||||
|---|---|---|---|---|---|---|---|---|---|---|
| Simulation | Type | Average | SD | MLE | Average | SD | MLE | Average | SD | MLE |
| — | Experimental | 216 | 55 | — | 320 | 84 | — | 560 | 118 | — |
| Gradient | Centromere | 291 | 79 | 0.92 | 463 | 78 | 0.86 | 829 | 35 | 0.25 |
| Gradient | Sister cohesion | 186 | 25 | 0.90 | 283 | 51 | 0.99 | 557 | 35 | 0.81 |
| Barrel | Pericentromere | 225 | 48 | 1.01 | 345 | 55 | 1.01 | 578 | 37 | 0.80 |
Alternatively, cohesin could be enriched at the sister cohesion axis in the pericentromere. Sister cohesion is maintained at a pericentric LacO marker 12.5 kb from CEN 11 (93% cohesion, n = 46). To map the probability distribution of the cohesion axis, we plotted the relative position of this LacO to a normalized spindle for multiple cells (Figure 4, B and C, II). The sister cohesion axis is distributed about the midspindle as an exponentially decaying gradient toward each spindle pole (Figure 4D, II). Simulations of a pericentric cohesin gradient decaying from the midspindle fail to match the fluorescence distribution of cohesin along the barrel, because the peak in fluorescence is too sharp relative to experimental cohesin distributions (n = 50 simulated; Figure 4E, II, and Table 4). Thus cohesin is more randomly dispersed throughout the pericentromere than predicted by gradients originating from sites of loading or cohesion.
We explored a third option, in which cohesin is dispersed throughout the pericentromere between the sister centromeres. Bioriented LacO arrays at 3.8 kb from CEN3 were utilized to determine the relative position of pericentric chromatin in the spindle (Figure 4, B and C, III). Pericentromere chromatin resides in a broad distribution but shows peaks ∼600 nm apart, along with a mean separation distance of 541 nm (n = 60 cells; Figure 4, C and D, III). To simulate cohesin dispersed on chromatin, we randomly filled the best-fit cohesin barrel with the known number of fluorophores (500 nm wide, 550 nm long, and 50 nm thick with 240 fluorophores). Simulations of randomly distributed cohesin best matched experimental fluorescence (MLE = 0.80 − 1.01, n = 50 simulated; Table 4 and Figure 4E, III). The random dispersion of the measured number of fluorophores in the pericentromere ∼125 nm from the kinetochore/centromere recapitulates the experimental distribution of pericentric cohesin.
Localization determinants
Cohesin is actively recruited to the pericentromere via the COMA (Ctf19 Okp1 Mcm21 Ame1 kinetochore complex; De Wulf et al., 2003), which recruits Scc2/4 (Eckert et al., 2007; D'Ambrosio et al., 2008; Fernius and Marston, 2009; Ng et al., 2009), and to rDNA via Sir2 (Wu et al., 2011). On deletion of MCM21, cohesin pericentromere fluorescence enrichment over nuclear background (normalized to 1.0) is decreased, while cohesin fluorescence intensity is increased in the rDNA (pericentromere: 2.2 wild type (WT) vs. 1.3 mcm21Δ, p < 0.01; rDNA: 1.4 WT vs. 2.0 mcm21Δ, p < 0.01; n = 40 WT and 52 mcm21Δ; Figure 5A). Similarly, deletion of SIR2 results in decreased cohesin fluorescence at the rDNA, while fluorescence increased in the pericentromere (rDNA: 1.4 WT vs. 1.1 sir2Δ, p < 0.01; pericentromere: 2.2 WT vs. 2.6 sir2Δ, p < 0.01; n = 32). Thus cohesin is in equilibrium between the two major chromatin-binding sites.
FIGURE 5:

Condensin spindle proximal position is dependent on Sir2. (A and B) Example images show Smc3/4-GFP pericentromere enrichment between the spindles poles (Spc29, purple) as well as enrichment in the rDNA loop in the nucleolus. Graphs of (A) cohesin and (B) condensin fold intensity over nuclear background (normalized to 1.0) for the pericentromere (blue) and rDNA (red) in WT, mcm21Δ, and sir2Δ. (C) Examples of pericentric condensin (Smc4-GFP) in sir2Δ cells as a line (84%, black) or bilobed (16%, gray; n = 65). (D) Line scans perpendicular to the spindle axis of the example images shown in (C). (E) Graph of sagittal peak-to-peak inclusive measurements for cohesin WT, sir2Δ (389 nm, n = 12), cells treated with low benomyl (10–20 μg/ml for 45 min; 483 nm; Haase et al., 2012), and sir2Δ condensin bilobes (305 nm, n = 10). (F) Graph of Gaussian FWHM measures for condensin lines (mcm21Δ: n = 15; sir2Δ: n = 40; low benomyl: n = 17). Asterisk denotes significant difference from WT (p < 0.01). Mutants with a different number of asterisks denote statistical difference from each other (p < 0.01). Scale bar: 1 μm.
Condensin is also loaded via Scc2/4 (D'Ambrosio et al., 2008). However, deletion of MCM21 did not affect condensin enrichment at the pericentromere nor rDNA (p > 0.73, n = 32 WT and 26 mcm21Δ; Figure 5B). This suggests that condensin is recruited to the pericentromere via another protein(s) that interacts with Scc2/4 and not COMA. If pericentric condensin structure or clustering is dependent on pericentric cohesin, then it should be disrupted in mcm21Δ cells. Condensin width and clustering are cohesin independent, as cells deleted of MCM21 retain WT condensin distribution (n = 44; Figure 5F and Supplemental Figure S1B).
Condensin is required for Sir2 recruitment into the nucleolus for rDNA silencing (Machin et al., 2004). The concentration of condensin in the rDNA is also dependent on Sir2 by ChIP (Li et al., 2013). On deletion of SIR2, condensin fluorescence in the rDNA decreased, while pericentric condensin remained the same (rDNA: 4.6 WT vs. 3.1 sir2Δ, p = 0.007; pericentromere: 3.1 WT vs. 3.0 sir2Δ, p = 0.95, n = 21 sir2Δ; Figure 5B). Condensin, unlike cohesin, is not equilibrated between these sites of action.
The organization of condensin in the pericentromere is dependent on Sir2. Condensin width increased in sir2Δ cells (Gaussian distribution with a FWHM of 355 ± 59 nm sir2Δ vs. 325 nm WT, p = 0.01; Figure 5, C, D, and F). Furthermore, condensin displays no bilobe fluorescence in WT cells (0%, n = 42) but appears bilobed in 16% of sir2Δ cells imaged (n = 65; Figure 5, C and D). The bilobed condensin structures are smaller in diameter than cohesin barrels (sir2Δ condensin bilobed: 305 ± 47 nm sagittal, n = 10, p = 0.004; Figure 5E). Cohesin barrel size did not significantly change in sir2Δ cells (389 ± 55 nm sagittal, n = 12, p = 0.42; Figure 5E), suggesting that the size increase is specific to condensin. The bilobed condensin structures are homogeneous (n = 10), while spindle proximal condensin remain heterogeneous (Figure S1A). Therefore Sir2 contributes to the spindle proximal position of condensin, and upon its deletion, condensin becomes radially displaced and homogeneous.
The radial position of cohesin is dictated by pericentric chromatin (Haase et al., 2012). Treatment of cells with low benomyl reduces microtubule dynamics and tension (Pearson, 2003). In response to reduced tension, the average radial position of pericentric chromatin increases (diameter: 194 nm WT to 324 nm low benomyl; Haase et al., 2012). Similarly, the cohesin barrel expands (373 nm to 483 nm), indicating cohesin position is influenced by the radial displacement of pericentric chromatin (Figure 5E). In contrast, condensin's axial location is not altered in cells treated with low benomyl (335 ± 39 nm, n = 17 compared with WT 323 nm, p = 0.4; Figure 5F). Therefore the radial dispersion of pericentric cohesin reflects chromatin localization, while the axial distribution and clustering of condensin relies in part on Sir2.
DISCUSSION
Cohesin and condensin are essential components of the chromatin spring. Using model convolution on simulated geometries of cohesin and condensin, we determined their fine structures within pericentric chromatin. Cohesin is best matched by a random distribution of fluorophores populating a barrel 500 nm in diameter and 550 nm in length and a single complex ∼40 nm thick. Condensin fluorescence is best matched by clustered fluorophores occupying a 350-nm hollow cylinder proximal to the interpolar spindle microtubules. Understanding the differences between cohesin and condensin distributions in the pericentromere allow us to gain insight into their functions in the chromatin spring.
Pericentric cohesin has been proposed to be organized into a barrel distribution around the spindle microtubules (Yeh et al., 2008). This is consistent with the cylinder-like organization of spindle microtubules seen with EM tomography and the distribution of pericentric chromatin labeled with LacO/LacI-GFP (Winey et al., 1995; Gardner et al., 2008; Anderson et al., 2009; Stephens et al., 2011; Haase et al., 2012). We show here that experimental pericentric cohesin fluorescence from various angles of acquisition is faithfully recapitulated by simulated images of a hollow cylinder/barrel (Figure 2). Cohesin's homogeneous distribution is best matched by single, randomly distributed fluorophores (Figure 4). The barrel is continuous only in the sense that the fluorescence distribution of individual molecules overlaps as a consequence of the objective PSF. We can rule out multiple layers within the barrel (or multiple concentric barrels) based on the simulations that indicate the thickness of the barrel is comparable to a single cohesin ring (Figure 2D and Table 2). Our modeling does not address whether the molecules exist as single or multiple complexes (Haering and Jessberger, 2012). Model convolution data are consistent with cohesin dispersed throughout a barrel geometry surrounding the central spindle.
The distribution of condensin differs from cohesin in that it is neither bilobed nor homogeneous. By measuring the number of molecules, we know that the differences are not due to a disparity in the number of molecules, as both have ∼240 total in the total pericentric chromatin of 16 sister chromatids. To mimic cell-to-cell heterogeneity, we reduced the number of unique positions the fluorophores occupy in the cylinder via clustering and randomized fluorophore positions from image to image. The random distribution of clusters (eight or 16 fluorophores per cluster) in simulations best matches condensin's heterogeneous axial fluorescence with approximately equal frequency of a focus, two foci, or uniform signal (Figure 3). Even in mcm21Δ cells with an increased interkinetochore length, the frequency of different fluorescent signals is accurately matched by simulations of clustering (Figure S1B). Compiling experimental condensin images from a population of aligned spindles revealed no preferred position within the pericentromere. The ensemble fluorescence was evenly distributed between kinetochores (Stephens et al., 2011). Taken together, the data suggest that condensin clusters are randomly distributed in the pericentromere and along the spindle axis.
Condensin clusters likely form rosettes in the pericentromere to resist tension via homotypic interactions (Figure 6). The idea of multiple loops stemming from clustered condensin has been proposed as a mechanism for chromatin compaction (Vas et al., 2007; Hirano, 2012). Biochemical and theoretical studies suggest condensins work cooperatively (Melby et al., 1998; Strick et al., 2004; Alipour and Marko, 2012). Our data support a model in which multiple condensins (8–16) cluster to compact the pericentromere along the spindle axis (Figure 3). Compaction likely occurs through condensin gathering of distal regions of DNA to produce chiral loops (Kimura and Hirano, 1997; Yoshimura et al., 2002; Strick et al., 2004; Hirano, 2006; Figure 6). Condensin has been shown to bind to and cluster at tRNA genes, as well as at other sites occupied by transcription factor TFIIIC (D'Ambrosio et al., 2008; Haeusler et al., 2008; Iwasaki et al., 2010), providing a mechanism to cluster pericentromere loci. Sir2 aids in the recruitment of condensin to tRNA sites (Li et al., 2013), and upon Sir2 depletion, condensin may lose affinity for these sites, which may explain why condensin becomes displaced from the spindle axis in sir2Δ mutants (Figure 5). Condensin binding is negatively correlated with transcription activity in the rDNA locus as well as the centromere (Johzuka and Horiuchi, 2007, 2009; Iwasaki et al., 2010). An alternative but not mutually exclusive mechanism for condensin displacement in sir2Δ cells is that Sir2 functions to hypoacetylate centromere and pericentromere regions (Choy et al., 2011, 2012) to promote transcription silencing in order to ensure proper condensin recruitment/binding. A chromatin spring composed of loops is consistent with mathematical models that recapitulate experimental spindle behavior upon perturbation of the chromatin spring via pericentric cohesin or condensin depletion (Stephens et al., 2013).
FIGURE 6:
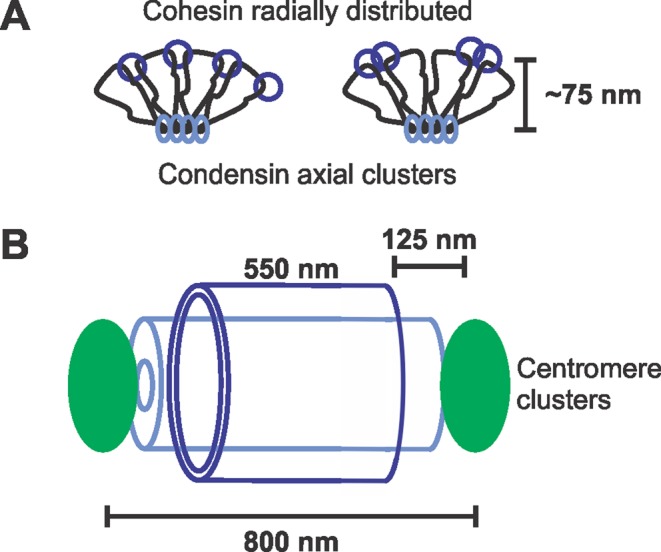
Model of cohesin and condensin in the pericentromere. (A) Condensin (light blue) is localized along the spindle axis in clusters, where it forms rosette-like loops through multiple condensin working cooperatively. Cohesin (dark blue) is localized radially, where it promotes looping to resist outward pulling forces from spindle microtubules. Cohesin is shown as two possible configurations: a single complex (left) or two complexes (right; see review in Haering and Jessberger, 2012). (B) Diagram of the intercentromere region. While condensin can span the length between sister centromere clusters, cohesin is displaced from the centromere cluster by ∼125 nm.
Cohesin is randomly distributed on radially dispersed pericentromere loops. The broad distribution of centromere-linked LacO arrays provides an independent estimate of the size of the cohesin barrel. In 92% of cells, pericentric LacO arrays are confined within a 530-nm diameter surrounding the spindle (see Figure 4C, III). On treatment of cells with a low dose of benomyl, both pericentric chromatin radial position and the width of cohesin barrel increase (Haase et al., 2012). The expansion of pericentric chromatin depends upon Bub1-dependent phosphorylation of H2AS121A (Haase et al., 2012). Thus it is the chromatin that dictates the dimensions of the cohesin barrel. The aggregate pericentric chromatin (32 × 50 kb = 1.6 Mbp) in mitosis is comparable in size to the entire Escherichia coli nucleoid (∼4 Mbp). Because the pericentromere is confined to a similar volume, it is likely to exhibit features of confinement displayed by the bacterial nucleoid and subject to entropic polymer repulsion that facilitates chromosome segregation (Jun and Mulder, 2006; Fisher et al., 2013). Cohesin plays a critical function in confining the chromatin to this radial position (depicted in Figure 6; Stephens et al., 2011). Cohesin embracing radial loops of different pericentromeres would generate a cross-linked network (Stephens et al., 2013), which would further confine the pericentric chromatin. We therefore propose that cohesin's molecular functions in entrapment and compaction (Gruber et al., 2003; Haering et al., 2008; Sun et al., 2013) lead to confinement and cross-linking within the chromatin spring.
Interestingly cohesin's distribution does not span the entire pericentromere from kinetochore to kinetochore and instead is ∼125 nm away from either centromere cluster. The eviction of cohesin from the centromere may be necessary for proper orientation. Having cohesion at the centromere promotes monorientation of sister centromeres, whereas cohesion in the pericentromere promotes biorientation (Sakuno and Watanabe, 2009). A similar but alternative idea is that condensin could be displacing cohesin to aid in centromere resolution, as has been reported in Caenorhabditis elegans (Moore et al., 2005).
Model convolution provides a noninvasive method to determine the fine structure and distribution of cohesin and condensin in the mitotic segregation apparatus. Computer simulations of different fluorophore geometries and distributions were convolved with the PSF to directly assess experimental images. The axial position and clustering of condensin versus the radial position and dispersion of cohesin leads to insights into the arrangement of the chromatin spring. A rosette of pericentromere loops is compacted and confined in a geometry that distributes tension generated at multiple microtubule attachment sites throughout the chromatin network.
MATERIALS AND METHODS
Cell preparation
Cells were incubated in YPD (2% glucose, 2% peptone, and 1% yeast extract) at 24°C for WT, mcm21D, and sir2Δ strains. Asynchronous cultures were grown to log phase and then imaged. Only metaphase cells were analyzed as outlined in Stephens et al. (2011). Cells were considered in metaphase with spindle lengths between 1.3 and 1.7 μm for WT and sir2Δ strains. Cells with MCM21 deleted have longer spindle lengths in metaphase (Stephens et al., 2011), and metaphase lengths were therefore considered between 1.3 and 2.5 μm.
Imaging
Wide-field microscope images were acquired at room temperature (25°C) using a microscope stand (Eclipse TE2000-U; Nikon, East Rutherford, NJ) with a 100× Plan-Apochromat, 1.4 numerical aperture digital interference contrast oil-immersion lens with a camera (ORCA ER; Hamamatsu Photonics, Hamamatsu City, Japan). MetaMorph 7.1 (Molecular Devices, Sunnyvale, CA) was used to acquire unbinned z-series image stacks with a z-step size of 300 nm. Population imaging was performed in water on concanavalin A–coated coverslips. Image exposure times were between 400 and 800 ms.
Analyzing fluorescence
Experimental images were rotated in MATLAB (MathWorks, Natick, MA) so that the spindle poles (Spc29-RFP) were aligned horizontally along the same y coordinate. Only single-plane images containing both spindle pole bodies in focus with metaphase spindle lengths were analyzed, except where noted (see Figure 2, experimental spindle tilt). Tub1, Nuf2, and Smc4-GFP fluorescence width was measured in MATLAB by taking line scans perpendicular to the spindle axis and through the brightest pixel, then fitting to a Gaussian distribution to obtain a FWHM measurement. Smc3-GFP width was measured as the inclusive distance between peaks of the bilobe. Lengths of Smc3 and Smc4 enrichment along the spindle axis were measured by taking a line scan parallel to the spindle axis, through the brightest pixel, and calculating the distance between pixel coordinates at half-maximum intensity above the nuclear background using MetaMorph.
Model convolution
The experimental PSF of our microscope was determined by imaging a 100-nm fluorescent bead with 100-nm z-steps spanning 1 μm above and below the brightest plane. Five different z-series of 100-nm fluorescent beads were aligned and averaged to generate the average PSF of our microscope (Sprague et al., 2003). The experimental PSF z-stack was imported into Microscope Simulator 2.0.0 for use. The Microscope Simulator 2.0.0 software program (CISMM UNC-Chapel Hill; http://cismm.cs.unc.edu/downloads; Quammen et al., 2008) was used to generate geometrical cylinder models with length, inner diameter, and outer diameter. Cylinders were grid filled with fluorophores spaced 12.5 nm apart. To generate a simulated fluorescence image of the cylinders, each fluorophore in the cylinder was convolved with the experimental PSF. The convolution of the entire cylinder matrix is the summarization of the contributions of the fluorescence from each simulated fluorophore position in x, y, and z to the image plane (Agard et al., 1989; Sprague et al., 2003). Image(x,y) = Σ cylinder matrix (x,y,x) ⋅ PSF(x,y,z). All simulated images were focused on the midplane of the cylinder. Random Gaussian noise (cohesin − mean 250, SD 3; condensin − mean 220, SD 2.6) matching the noise from experimental images was added to the generated images. Maximum intensity from simulated images was scaled to reflect the maximum intensity observed in experimental images. Cylinders were randomly placed (±65 nm) relative to the x,y coordinates for each output-simulated image to avoid aliasing.
Outer diameters were increased in 25-nm intervals, and the best match was determined by a normalized MLE comparing measurements from line scans of experimental and simulated images. MLE compares each individual experimental measure (xi) to the average (μ) and SD (σ) of a model via summing the log of [1/sqrt(2Π ⋅ σ2)] e^[(xi − μ)2/(2σ2)] (Edwards et al., 2007). MLE generates a negative number, which is arbitrary besides the fact that the highest number (or least negative) represents the best fit. To present an intuitive value, we normalized each model MLE for each different protein or parameter by comparing it with the experimental MLE (expMLE/modelMLE). This results in the reported range of 0 to ∼1, where 1 means that the model average and SD fitted the data as well as the experimental average and SD. Thus a larger MLE equals a better fit.
Simulated images (n = 50–100) were line scanned and analyzed in the same manner as experimental images. A designated number of fluorophores was used to randomly fill cylinders for each individual simulated image used to determine hetero- and homogeneity.
Counting molecules
The counting of condensin (Smc4-GFP) molecules was obtained as outlined for cohesin (Smc3-GFP) molecules by Yeh et al. (2008). Cells containing Smc4-GFP; Spc29-RFP and Cse4-GFP; Spc29-RFP were mixed together and prepared on the same microscope slide. Images were acquired at 200-nm spacing between z-planes. A 16-pixel × 12-pixel rectangle (1040 nm × 780 nm) was manually placed around the Smc4-GFP signal between the spindle poles of metaphase cells with both spindle pole bodies (Spc29-RFP) in focus in the same z-plane. Background measured in a nuclear region away from the spindle axis was subtracted from the integrated value of Smc4-GFP fluorescence. This integrated intensity was then compared with the integrated intensity of Cse4-GFP cluster from late anaphase or telophase cells. Smc4-GFP and Cse4-GFP integrated intensities were compared between cells in the same acquired image to account for possible differences in image conditions. Molecular counts for condensin (Smc4) were calculated by establishing the ratio of Smc4 signal to Cse4 and multiplying it by the measured number of Cse4 molecules per cluster reported by Lawrimore et al. (2011).
Measuring cohesin distribution
Line scans drawn along the Smc3-GFP lobes were taken through the brightest pixel. Average nuclear background was measured by taking an area 4 pixel × 4 pixel (260 nm × 260 nm) away from the spindle in the nucleus. The intensities along the lobe were scaled relative to the brightest pixel (100%) and the average nuclear background (0%). The inclusive distance of pixel intensities greater than 90, 80, and 50% of maximum intensity were used to determine the width and shape of cohesin fluorescence distribution. Simulated images were analyzed in the same manner, and widths measured at 90, 80, and 50% were compared via normalized MLE (Table 4).
A cohesin gradient decaying from the centromere was simulated using concave-down (y = −0.015x2 + 0.255x − 0.08) starting from each centromere and spanning the distance to the other centromere (distance measured experimentally). Concave-down gradient was used because it qualitatively fitted the profile of experimental fluorescence. The distribution of the experimental the LacO array at 12.5 kb was best fitted with an exponentially decreasing gradient from the midspindle (y = 1e0.005x). This best-fit equation was then used to simulate cohesin fluorescence from the cohesion axis. Cohesin throughout the pericentromere was simulated by randomly dispersing the measured number of fluorophores (240), in the best-fit cylinder dimensions (length, width, thickness), which also agrees with experimental data of average separation distance between separated sister LacO arrays at 3.8 kb.
Distribution of fluorescently labeled proteins in a normalized spindle
Experimental images of Cse4-GFP and LacO/LacI-GFP at 12.5 kb from CEN11 and LacO/LacI-GFP at 3.8 kb from CEN3 were acquired with Spc29-RFP spindle pole bodies. Images were aligned along the horizontal spindle axis. Spindle length and the length between Cse4-GFP cluster or LacO/LacI-GFP focus relative to its nearest spindle pole body were logged in MetaMorph. All measurements were normalized to the spindle length (1.0). Experimental data were used to generate an accurate simulation gradient or geometry that reflected either the position of the centromere (Cse4), the sister cohesin axis (LacO: 12.5 kb), or pericentric chromatin (LacO: 3.8 kb).
Intensity measurements
Intensity of Smc3 and Smc4 were measured relative to nuclear background intensity. For each image cell background, nuclear background and Smc3/4 brightest intensity and average were logged. Cell background intensity was subtracted from both nuclear background and Smc3/4. The intensity of Smc3/4 was compared relative to nuclear background intensity to yield a ratio of Smc3/4 fold intensity above nuclear background for each individual cell.
Supplementary Material
Acknowledgments
We thank Jolien Verdaasdonk for critical feedback on the manuscript and Rachel Haggerty for help troubleshooting software. We also thank Edward Banigan (Northwestern University) for providing the equation and insights on MLE. This work was funded by National Institutes of Health R37 grant GM32238 (to K.B.) and National Institutes of Health P41 grant EB002025 (to R.M.T.; Center for Computer Integrated Systems for Microscopy and Manipulation).
Abbreviations used:
- FWHM
full-width half-maximum
- PSF
point spread function
- SMC
structural maintenance of chromosomes
Footnotes
This article was published online ahead of print in MBoC in Press (http://www.molbiolcell.org/cgi/doi/10.1091/mbc.E13-06-0325) on October 23, 2013.
REFERENCES
- Agard DA, Hiraoka Y, Shaw P, Sedat JW. Fluorescence microscopy in three dimensions. Methods Cell Biol. 1989;30:353–377. doi: 10.1016/s0091-679x(08)60986-3. [DOI] [PubMed] [Google Scholar]
- Alipour E, Marko JF. Self-organization of domain structures by DNA-loop-extruding enzymes. Nucleic Acids Res. 2012;40:11202–11212. doi: 10.1093/nar/gks925. [DOI] [PMC free article] [PubMed] [Google Scholar]
- Anderson DE, Losada A, Erickson HP, Hirano T. Condensin and cohesin display different arm conformations with characteristic hinge angles. J Cell Biol. 2002;156:419–424. doi: 10.1083/jcb.200111002. [DOI] [PMC free article] [PubMed] [Google Scholar]
- Anderson M, Haase J, Yeh E, Bloom K. Function and assembly of DNA looping, clustering, and microtubule attachment complexes within a eukaryotic kinetochore. Mol Biol Cell. 2009;20:4131–4139. doi: 10.1091/mbc.E09-05-0359. [DOI] [PMC free article] [PubMed] [Google Scholar]
- Bachellier-Bassi S, Gadal O, Bourout G, Nehrbass U. Cell cycle-dependent kinetochore localization of condensin complex in Saccharomyces cerevisiae. J Struct Biol. 2008;162:248–259. doi: 10.1016/j.jsb.2008.01.002. [DOI] [PubMed] [Google Scholar]
- Blat Y, Kleckner N. Cohesins bind to preferential sites along yeast chromosome III, with differential regulation along arms versus the centric region. Cell. 1999;98:249–259. doi: 10.1016/s0092-8674(00)81019-3. [DOI] [PubMed] [Google Scholar]
- Bouck DC, Bloom K. Pericentric chromatin is an elastic component of the mitotic spindle. Curr Biol. 2007;17:741–748. doi: 10.1016/j.cub.2007.03.033. [DOI] [PMC free article] [PubMed] [Google Scholar]
- Choy JS, Acuna R, Au WC, Basrai MA. A role for histone H4K16 hypoacetylation in Saccharomyces cerevisiae kinetochore function. Genetics. 2011;189:11–21. doi: 10.1534/genetics.111.130781. [DOI] [PMC free article] [PubMed] [Google Scholar]
- Choy JS, Mishra PK, Au WC, Basrai MA. Insights into assembly and regulation of centromeric chromatin in Saccharomyces cerevisiae. Biochim Biophys Acta. 2012;1819:776–783. doi: 10.1016/j.bbagrm.2012.02.008. [DOI] [PMC free article] [PubMed] [Google Scholar]
- D'Ambrosio C, Schmidt CK, Katou Y, Kelly G, Itoh T, Shirahige K, Uhlmann F. Identification of cis-acting sites for condensin loading onto budding yeast chromosomes. Genes Dev. 2008;22:2215–2227. doi: 10.1101/gad.1675708. [DOI] [PMC free article] [PubMed] [Google Scholar]
- De Wulf P, McAinsh AD, Sorger PK. Hierarchical assembly of the budding yeast kinetochore from multiple subcomplexes. Genes Dev. 2003;17:2902–2921. doi: 10.1101/gad.1144403. [DOI] [PMC free article] [PubMed] [Google Scholar]
- Eckert CA, Gravdahl DJ, Megee PC. The enhancement of pericentromeric cohesin association by conserved kinetochore components promotes high-fidelity chromosome segregation and is sensitive to microtubule-based tension. Genes Dev. 2007;21:278–291. doi: 10.1101/gad.1498707. [DOI] [PMC free article] [PubMed] [Google Scholar]
- Edwards AM, et al. Revisiting Levy flight search patterns of wandering albatrosses, bumblebees and deer. Nature. 2007;449:1044–1048. doi: 10.1038/nature06199. [DOI] [PubMed] [Google Scholar]
- Fernius J, Marston AL. Establishment of cohesion at the pericentromere by the Ctf19 kinetochore subcomplex and the replication fork-associated factor, Csm3. PLoS Genet. 2009;5:e1000629. doi: 10.1371/journal.pgen.1000629. [DOI] [PMC free article] [PubMed] [Google Scholar]
- Fisher JK, Bourniquel A, Witz G, Weiner B, Prentiss M, Kleckner N. Four-dimensional imaging of E. coli nucleoid organization and dynamics in living cells. Cell. 2013;153:882–895. doi: 10.1016/j.cell.2013.04.006. [DOI] [PMC free article] [PubMed] [Google Scholar]
- Gardner MK, et al. Chromosome congression by kinesin-5 motor-mediated disassembly of longer kinetochore microtubules. Cell. 2008;135:894–906. doi: 10.1016/j.cell.2008.09.046. [DOI] [PMC free article] [PubMed] [Google Scholar]
- Gardner MK, Pearson CG, Sprague BL, Zarzar TR, Bloom K, Salmon ED, Odde DJ. Tension-dependent regulation of microtubule dynamics at kinetochores can explain metaphase congression in yeast. Mol Biol Cell. 2005;16:3764–3775. doi: 10.1091/mbc.E05-04-0275. [DOI] [PMC free article] [PubMed] [Google Scholar]
- Gardner MK, Sprague BL, Pearson CG, Cosgrove BD, Bicek AD, Bloom K, Salmon ED, Odde DJ. Model convolution: a computational approach to digital image interpretation. Cell Mol Bioeng. 2010;3:163–170. doi: 10.1007/s12195-010-0101-7. [DOI] [PMC free article] [PubMed] [Google Scholar]
- Glynn EF, Megee PC, Yu HG, Mistrot C, Unal E, Koshland DE, DeRisi JL, Gerton JL. Genome-wide mapping of the cohesin complex in the yeast Saccharomyces cerevisiae. PLoS Biol. 2004;2:E259. doi: 10.1371/journal.pbio.0020259. [DOI] [PMC free article] [PubMed] [Google Scholar]
- Goshima G, Yanagida M. Establishing biorientation occurs with precocious separation of the sister kinetochores, but not the arms, in the early spindle of budding yeast. Cell. 2000;100:619–633. doi: 10.1016/s0092-8674(00)80699-6. [DOI] [PubMed] [Google Scholar]
- Gruber S, Haering CH, Nasmyth K. Chromosomal cohesin forms a ring. Cell. 2003;112:765–777. doi: 10.1016/s0092-8674(03)00162-4. [DOI] [PubMed] [Google Scholar]
- Haase J, Stephens A, Verdaasdonk J, Yeh E, Bloom K. Bub1 kinase and Sgo1 modulate pericentric chromatin in response to altered microtubule dynamics. Curr Biol. 2012;22:471–481. doi: 10.1016/j.cub.2012.02.006. [DOI] [PMC free article] [PubMed] [Google Scholar]
- Haering CH, Farcas AM, Arumugam P, Metson J, Nasmyth K. The cohesin ring concatenates sister DNA molecules. Nature. 2008;454:297–301. doi: 10.1038/nature07098. [DOI] [PubMed] [Google Scholar]
- Haering CH, Jessberger R. Cohesin in determining chromosome architecture. Exp Cell Res. 2012;318:1386–1393. doi: 10.1016/j.yexcr.2012.03.016. [DOI] [PubMed] [Google Scholar]
- Haering CH, Lowe J, Hochwagen A, Nasmyth K. Molecular architecture of SMC proteins and the yeast cohesin complex. Mol Cell. 2002;9:773–788. doi: 10.1016/s1097-2765(02)00515-4. [DOI] [PubMed] [Google Scholar]
- Haeusler RA, Pratt-Hyatt M, Good PD, Gipson TA, Engelke DR. Clustering of yeast tRNA genes is mediated by specific association of condensin with tRNA gene transcription complexes. Genes Dev. 2008;22:2204–2214. doi: 10.1101/gad.1675908. [DOI] [PMC free article] [PubMed] [Google Scholar]
- Hagstrom KA, Holmes VF, Cozzarelli NR, Meyer BJ. C. elegans condensin promotes mitotic chromosome architecture, centromere organization, and sister chromatid segregation during mitosis and meiosis. Genes Dev. 2002;16:729–742. doi: 10.1101/gad.968302. [DOI] [PMC free article] [PubMed] [Google Scholar]
- Hirano T. At the heart of the chromosome: SMC proteins in action. Nat Rev Mol Cell Biol. 2006;7:311–322. doi: 10.1038/nrm1909. [DOI] [PubMed] [Google Scholar]
- Hirano T. Condensins: universal organizers of chromosomes with diverse functions. Genes Dev. 2012;26:1659–1678. doi: 10.1101/gad.194746.112. [DOI] [PMC free article] [PubMed] [Google Scholar]
- Hu B, Itoh T, Mishra A, Katoh Y, Chan KL, Upcher W, Godlee C, Roig MB, Shirahige K, Nasmyth K. ATP hydrolysis is required for relocating cohesin from sites occupied by its Scc2/4 loading complex. Curr Biol. 2011;21:12–24. doi: 10.1016/j.cub.2010.12.004. [DOI] [PMC free article] [PubMed] [Google Scholar]
- Iwasaki O, Tanaka A, Tanizawa H, Grewal SI, Noma K. Centromeric localization of dispersed Pol III genes in fission yeast. Mol Biol Cell. 2010;21:254–265. doi: 10.1091/mbc.E09-09-0790. [DOI] [PMC free article] [PubMed] [Google Scholar]
- Johzuka K, Horiuchi T. RNA polymerase I transcription obstructs condensin association with 35S rRNA coding regions and can cause contraction of long repeat in Saccharomyces cerevisiae. Genes Cells. 2007;12:759–771. doi: 10.1111/j.1365-2443.2007.01085.x. [DOI] [PubMed] [Google Scholar]
- Johzuka K, Horiuchi T. The cis element and factors required for condensin recruitment to chromosomes. Mol Cell. 2009;34:26–35. doi: 10.1016/j.molcel.2009.02.021. [DOI] [PubMed] [Google Scholar]
- Jun S, Mulder B. Entropy-driven spatial organization of highly confined polymers: lessons for the bacterial chromosome. Proc Natl Acad Sci USA. 2006;103:12388–12393. doi: 10.1073/pnas.0605305103. [DOI] [PMC free article] [PubMed] [Google Scholar]
- Kimura K, Hirano T. ATP-dependent positive supercoiling of DNA by 13S condensin: a biochemical implication for chromosome condensation. Cell. 1997;90:625–634. doi: 10.1016/s0092-8674(00)80524-3. [DOI] [PubMed] [Google Scholar]
- Lawrimore J, Bloom KS, Salmon ED. Point centromeres contain more than a single centromere-specific Cse4 (CENP-A) nucleosome. J Cell Biol. 2011;195:573–582. doi: 10.1083/jcb.201106036. [DOI] [PMC free article] [PubMed] [Google Scholar]
- Lengronne A, Katou Y, Mori S, Yokobayashi S, Kelly GP, Itoh T, Watanabe Y, Shirahige K, Uhlmann F. Cohesin relocation from sites of chromosomal loading to places of convergent transcription. Nature. 2004;430:573–578. doi: 10.1038/nature02742. [DOI] [PMC free article] [PubMed] [Google Scholar]
- Li M, Valsakumar V, Poorey K, Bekiranov S, Smith JS. Genome-wide analysis of functional sirtuin chromatin targets in yeast. Genome Biol. 2013;14:R48. doi: 10.1186/gb-2013-14-5-r48. [DOI] [PMC free article] [PubMed] [Google Scholar]
- Machin F, Paschos K, Jarmuz A, Torres-Rosell J, Pade C, Aragon L. Condensin regulates rDNA silencing by modulating nucleolar Sir2p. Curr Biol. 2004;14:125–130. [PubMed] [Google Scholar]
- Megee PC, Mistrot C, Guacci V, Koshland D. The centromeric sister chromatid cohesion site directs Mcd1p binding to adjacent sequences. Mol Cell. 1999;4:445–450. doi: 10.1016/s1097-2765(00)80347-0. [DOI] [PubMed] [Google Scholar]
- Melby TE, Ciampaglio CN, Briscoe G, Erickson HP. The symmetrical structure of structural maintenance of chromosomes (SMC) and MukB proteins: long, antiparallel coiled coils, folded at a flexible hinge. J Cell Biol. 1998;142:1595–1604. doi: 10.1083/jcb.142.6.1595. [DOI] [PMC free article] [PubMed] [Google Scholar]
- Moore LL, Stanvitch G, Roth MB, Rosen D. HCP-4/CENP-C promotes the prophase timing of centromere resolution by enabling the centromere association of HCP-6 in Caenorhabditis elegans. Mol Cell Biol. 2005;25:2583–2592. doi: 10.1128/MCB.25.7.2583-2592.2005. [DOI] [PMC free article] [PubMed] [Google Scholar]
- Ng TM, Waples WG, Lavoie BD, Biggins S. Pericentromeric sister chromatid cohesion promotes kinetochore biorientation. Mol Biol Cell. 2009;20:3818–3827. doi: 10.1091/mbc.E09-04-0330. [DOI] [PMC free article] [PubMed] [Google Scholar]
- O'Toole ET, Winey M, McIntosh JR. High-voltage electron tomography of spindle pole bodies and early mitotic spindles in the yeast Saccharomyces cerevisiae. Mol Biol Cell. 1999;10:2017–2031. doi: 10.1091/mbc.10.6.2017. [DOI] [PMC free article] [PubMed] [Google Scholar]
- Pearson CG, Gardner MK, Paliulis LV, Salmon ED, Odde DJ, Bloom K. Measuring nanometer scale gradients in spindle microtubule dynamics using model convolution microscopy. Mol Biol Cell. 2006;17:4069–4079. doi: 10.1091/mbc.E06-04-0312. [DOI] [PMC free article] [PubMed] [Google Scholar]
- Pearson CG, Maddox PS, Zarzar TR, Salmon ED, Bloom K. Yeast kinetochores do not stabilize Stu2p-dependent spindle microtubule dynamics. Mol Biol Cell. 2003;14:4181–4195. doi: 10.1091/mbc.E03-03-0180. [DOI] [PMC free article] [PubMed] [Google Scholar]
- Pearson CG, Yeh E, Gardner M, Odde D, Salmon ED, Bloom K. Stable kinetochore-microtubule attachment constrains centromere positioning in metaphase. Curr Biol. 2004;14:1962–1967. doi: 10.1016/j.cub.2004.09.086. [DOI] [PubMed] [Google Scholar]
- Quammen CW, Richardson AC, Haase J, Harrison BD, Taylor RM, II, Bloom KS. FluoroSim: a visual problem-solving environment for fluorescence microscopy. Eurographics Workshop Vis Comput Biomed. 2008;2008:151–158. doi: 10.2312/VCBM/VCBM08/151-158. [DOI] [PMC free article] [PubMed] [Google Scholar]
- Sakuno T, Watanabe Y. [Kinetochore geometry defined by cohesin within the centromere] Tanpakushitsu Kakusan Koso. 2009;54:1842–1849. [PubMed] [Google Scholar]
- Sprague BL, Pearson CG, Maddox PS, Bloom KS, Salmon ED, Odde DJ. Mechanisms of microtubule-based kinetochore positioning in the yeast metaphase spindle. Biophys J. 2003;84:3529–3546. doi: 10.1016/S0006-3495(03)75087-5. [DOI] [PMC free article] [PubMed] [Google Scholar]
- Stephens AD, Haase J, Vicci L, Taylor RM, II, Bloom K. Cohesin, condensin, and the intramolecular centromere loop together generate the mitotic chromatin spring. J Cell Biol. 2011;193:1167–1180. doi: 10.1083/jcb.201103138. [DOI] [PMC free article] [PubMed] [Google Scholar]
- Stephens AD, et al. Pericentric chromatin loops function as a nonlinear spring in mitotic force balance. J Cell Biol. 2013;200:757–772. doi: 10.1083/jcb.201208163. [DOI] [PMC free article] [PubMed] [Google Scholar]
- Strick TR, Kawaguchi T, Hirano T. Real-time detection of single-molecule DNA compaction by condensin I. Curr Biol. 2004;14:874–880. doi: 10.1016/j.cub.2004.04.038. [DOI] [PubMed] [Google Scholar]
- Sun M, Nishino T, Marko JF. The SMC1-SMC3 cohesin heterodimer structures DNA through supercoiling-dependent loop formation. Nucleic Acids Res. 2013. [DOI] [PMC free article] [PubMed]
- Surcel A, Koshland D, Ma H, Simpson RT. Cohesin interaction with centromeric minichromosomes shows a multi-complex rod-shaped structure. PLoS One. 2008;3:e2453. doi: 10.1371/journal.pone.0002453. [DOI] [PMC free article] [PubMed] [Google Scholar]
- Tanaka T, Cosma MP, Wirth K, Nasmyth K. Identification of cohesin association sites at centromeres and along chromosome arms. Cell. 1999;98:847–858. doi: 10.1016/s0092-8674(00)81518-4. [DOI] [PubMed] [Google Scholar]
- Vas AC, Andrews CA, Kirkland Matesky K, Clarke DJ. In vivo analysis of chromosome condensation in Saccharomyces cerevisiae. Mol Biol Cell. 2007;18:557–568. doi: 10.1091/mbc.E06-05-0454. [DOI] [PMC free article] [PubMed] [Google Scholar]
- Wang BD, Eyre D, Basrai M, Lichten M, Strunnikov A. Condensin binding at distinct and specific chromosomal sites in the Saccharomyces cerevisiae genome. Mol Cell Biol. 2005;25:7216–7225. doi: 10.1128/MCB.25.16.7216-7225.2005. [DOI] [PMC free article] [PubMed] [Google Scholar]
- Winey M, Mamay CL, O'Toole ET, Mastronarde DN, Giddings TH, Jr., McDonald KL, McIntosh JR. Three-dimensional ultrastructural analysis of the Saccharomyces cerevisiae mitotic spindle. J Cell Biol. 1995;129:1601–1615. doi: 10.1083/jcb.129.6.1601. [DOI] [PMC free article] [PubMed] [Google Scholar]
- Wu CS, Chen YF, Gartenberg MR. Targeted sister chromatid cohesion by Sir2. PLoS Genet. 2011;7:e1002000. doi: 10.1371/journal.pgen.1002000. [DOI] [PMC free article] [PubMed] [Google Scholar]
- Yeh E, Haase J, Paliulis LV, Joglekar A, Bond L, Bouck D, Salmon ED, Bloom KS. Pericentric chromatin is organized into an intramolecular loop in mitosis. Curr Biol. 2008;18:81–90. doi: 10.1016/j.cub.2007.12.019. [DOI] [PMC free article] [PubMed] [Google Scholar]
- Yoshimura SH, Hizume K, Murakami A, Sutani T, Takeyasu K, Yanagida M. Condensin architecture and interaction with DNA: regulatory non-SMC subunits bind to the head of SMC heterodimer. Curr Biol. 2002;12:508–513. doi: 10.1016/s0960-9822(02)00719-4. [DOI] [PubMed] [Google Scholar]
Associated Data
This section collects any data citations, data availability statements, or supplementary materials included in this article.