

Abstract
Riboswitches are RNA elements that allosterically regulate gene expression by binding cellular metabolites. The SAM-III riboswitch, one of several classes that binds S-adenosylmethionine (SAM), represses translation upon binding SAM (OFF state) by encrypting the ribosome binding sequence. We have carried out simulations of the RNA by applying mechanical force (f) to the ends of SAM-III, with and without SAM, to get quantitative insights into the f-dependent structural changes. Force-extension (z) curves (FECs) for the apo (ON) state, obtained in simulations in which f is increased at a constant loading rate, show three intermediates, with the first one being the rupture of SAM binding region, which is greatly stabilized in the OFF state. Force-dependent free energy profiles, G(z, f), as a function of z, obtained in equilibrium constant force simulations, reveal the intermediates observed in FECs. The predicted stability difference between the ON and OFF states using G(z, f) is in excellent agreement with experiments. Remarkably, using G(z, f)s and estimate of an effective diffusion constant at a single value of f allows us to predict the f-dependent transition rates using theory of first passage times for both the apo and holo states. To resolve the kinetics of assembly of SAM-III riboswitch in structural terms, we use force stretch-quench pulse sequences in which the force on RNA is maintained at a low (fq) value starting from a high value for a time period tq. Variation of tq over a wide range results in resolution of elusive states involved in the SAM binding pocket, and leads to accurate determination of folding times down to fq = 0. Quantitative measure of the folding kinetics, obtained from the folding landscape, allows us to propose that, in contrast to riboswitches regulating transcription, SAM-III functions under thermodynamic control provided the basal concentration of SAM exceeds a small critical value. All of the predictions are amenable to tests in single molecule pulling experiments.
Introduction
About a decade ago it was established that riboswitches, which are RNA elements found in the untranslated region of mRNA, regulate gene expression in bacteria by binding to metabolites with exquisite specificity.1–4 In the intervening years, fundamental insights into their functions have been obtained through a remarkable number of experiments ranging from X-ray crystallography enabling the determination of their structures,5 biophysical techniques elucidating the mechanistic aspects, single molecule experiments,6,7 and more recently theory and simulations.8–14 Riboswitches consist of a conserved aptamer domain to which the metabolite binds, resulting in a conformational change and alteration in the folding pattern of the downstream expression platform leading to control of gene expression. Remarkably, there are variations in the functions of riboswitches even among structurally similar aptamer domains. For example, add adenine (A) riboswitch activates translation upon binding the metabolite purine whereas the structurally similar pbuE adenine riboswitch activates transcription in the presence of purine. Both of these are ON riboswitches, which means that translation or transcription is activated only upon binding of the metabolite. In contrast, an OFF riboswitches (FMN for example) shut down gene expression when the metabolite binds to the aptamer domain. Finally, some of the riboswitches are under kinetic control (FMN riboswitch15 and pbuE adenine riboswitch16) whereas others (for example add adenine riboswitch) are under thermodynamic control.
A first step toward a quantitative understanding of the diverse functions of riboswitches is to map their entire folding landscape so that transitions between various states involved in the conformational rearrangements can be quantitatively elucidated. Here, we consider a riboswitch that binds S-adenosylmethionine (SAM), and undergoes an allosteric transition thus enabling control of translation. At least five distinct classes of riboswitches that bind SAM or its derivative S-adenosylhomocysteine (SAH) have been identified: (i) SAM-I/SAM-IV riboswitches, carrying a common metabolite binding core,17,18 (ii) SAM-II/SAM-V ribsowitches,19,20 which also carry a common metabolite binding core, (iii) SAM-III or SMK riboswitches,21 (iv) SAM/SAH riboswitches that do not discriminate between SAM and SAH,22 and (v) SAH riboswitches that selectlively bind SAH, and strongly discriminate against SAM.23 Both SAM-II/SAM-V and SAM-III riboswitches are unusual because the residues that control gene expression are also the binding sites for the SAM ligand.24,25 The SAM-III riboswitch, found in the metK gene (which encodes SAM synthetase) from Lactobacillales species, inhibits translation by sequestering the Shine-Dalgarno (SD) sequence (Fig. 1), which is essential for engaging the 30S ribosomal subunit for translation initiation.21 When SAM is bound, the somewhat atypical SD sequence (GGGGG shown in the blue shaded area in Fig. 1A) is sequestered by base pairing with the anti-Shine-Dalgarno (ASD) sequence, which hinders the binding of the 30S ribosomal subunits to mRNA. In the absence of SAM (Fig. 1C shows the metabolite), the sequence outside the binding domain is involved to enable the riboswitch to adopt an alternative folding pattern, in which the SD sequence is exposed and free to bind the ribosomal subunit.26 In this sense, SAM-III is an OFF switch for translation, in contrast to add A-riboswitch, which is an ON switch for translation. Regulation of gene expression, which depends on the concentration of SAM, is determined by competition between the SD-ASD pairing and loading of ribosomal subunit onto the SD sequence. In order to function as a switch, the SD sequence has to be exposed for ribosome recognition, which implies that at least part of the riboswitch structure accommodating SAM III has to unfold (Fig. 1). Thus, it is important to quantitatively determine the folding landscape and the rates of conformational transitions between the ON and OFF states of the SAM-III riboswitch to understand its function.27
Figure 1.

(A) The secondary structure of SAM-III riboswitch. The blue shaded area shows the Shine-Dalgarno (SD) sequence, GGGGG. (B) The tertiary structure of SAM-III riboswitch. (C) The structure of the metabolite S-adenosylmethionine, which in the coarse-grained simulations is represented using two interaction centers corresponding to the regions shown in red dotted lines. One of the centers corresponds to the adenosol (base and the ribose on the right) and the other represents the methionine moiety on the left.
Single molecule pulling experiments have produced the folding landscapes of several riboswitches27 including the two (add and pbuE) that bind the metabolite purine.28,29 Although both these riboswitches are structurally similar their folding landscapes are different, which in part explains the remarkable discriminating capacity of the two riboswitches. These experiments and related computations8 demonstrated that quantitative insights into functions of riboswitches may be obtained by understanding the detailed folding landscapes of metabolite induced conformational change in the riboswitches. Our predictions for the free energy profile for add A-riboswitch were nearly quantitatively validated using laser optical tweezer experiments.29 In addition, our theory that the stability of isolated helices in the three-way junction determines the order of unfolding of the paired helices in the add and pbuE A-riboswitches explained the differences in the measured sequence-dependent folding landscapes.
Here, we study the force-triggered unfolding and refolding of SAM-III riboswitch using a coarse-grained self-organized polymer (SOP) model using Langevin dynamics simulations.30,31 The method has been successfully applied to determine the sequence-dependent folding landscapes of the purine riboswitch aptamers and other RNA structures.8,30 We use similar models to make a number of predictions for future single molecule laser optical tweezer (LOT) experiments for SAM-III riboswitch. (i) The force-dependent free energy profiles as a function of extension of SAM-III show two intermediates, besides the unfolded and folded states, which are populated both in equilibrium and kinetic simulations. Binding of SAM greatly stabilizes the native state and increases the barrier to formation of alternate structures required to function as a switch. (ii) Remarkably, we find that the free energy profiles along with an estimate of a collective diffusion coefficient can be used in the theory of first passage times to predict the hopping rates between the states of SAM-III, in quantitative agreement with simulations. (iii) We implement a novel force stretch-quench protocol to resolve elusive states that may be difficult to detect in conventional (force ramp or force clamp) single molecule pulling experiments. (iv) The simulated folding landscapes and transition rates are used to produce a model for function of SAM-III riboswitch, demonstrating that the function of this riboswitch is under thermodynamic control.
Results and Discussion
Structures of SAM-III riboswitch in the simulations
The SAM-III riboswitch, with an inverted Y-shape, has four helices, P1, P2, P3, and P4 (Fig. 1), in the SAM-bound (‘OFF’) state. The metabolite, SAM, is bound to the three-way junction formed by helices P1, P2, and P4. We calculated the complete folding landscape of the binding domain of the SAM-riboswitch using the native structure with SAM bound from the crystal structure25 (PDB code: 3E5C). In order to decipher the rates of switching between the ‘ON’ and ‘OFF’ states, we also performed simulations without SAM bound. The native structure of the metabolite-free riboswitch aptamer for coarse-grained simulations was taken from the the equilibrated structure generated during a 50 ns all atom molecular simulation run starting from the bound-state crystal structure (3E5C) with SAM removed. The full SAM-III riboswitch favors an alternative folding pattern with the SD sequence free to engage the ribosomal subunit in the absence of SAM. However, to function as a switch the RNA has to allosterically change its conformation to an ensemble of structures committed to bind the metabolite. Thus simulations in the presence and absence of SAM are needed to describe the molecular basis of function.
Force-ramp simulations
In the absence of the metabolite, the force-extension curve (FEC), at a constant loading rate of 96 pN/s, shows that there are two intermediate states, with extension z ~ 14 nm and z ~ 9 nm (black curve in Fig. 2A). At the unfolding force of ~ 9 pN, helices P1 and P4 rupture in a single step, and at f ~ 10 − 11 pN, a second unfolding step occurs, resulting in the unraveling of P2. Helix P3 unfolds fully only when f exceeds beyond 12 pN. When SAM is bound, the riboswitch unfolds cooperatively in a single step at f ~ 16 pN (Fig. 2A). The distribution of histograms of extensions (blue curve in Fig. 2A), shows the presence of two intermediate states ahead of global unfolding. The peak, at z ~ 9 nm, corresponds to rupture of P1 and P4 helices (see below for additional evidence), which are the initial unfolding events. At this stage of unfolding P2 and P3 are still intact. The last helix to unfold is P3, corresponding to the peak at z ~ 14 nm. Thus, upon unfolding at a constant loading rate, the hierarchical unfolding pathway of SAM-III riboswitch is F → ΔP1ΔP4 → ΔP2 → U, where ΔP1ΔP4 means helices P1 and P4 are ruptured, and ΔP2 represents additional unfolding of P2. At this stage, we note that pulling at a constant loading rate does not resolve the order of rupture of P1 and P4, an issue that we address below using a different protocol to alter forces.
Figure 2.

(A) Force-extension curve (FEC) for SAM-III riboswitch in the absence of metabolite (in black) when stretched at a constant loading rate of 96 pN/s. The distribution of the extension (shown in blue) during the force ramp simulation shows multiple intermediate states: (i) F, the folded state, (ii) P2/P3, where only P2 and P3 are folded, (iii) P3, where only P3 is folded, and (iv) U, unfolded state. The red curve is FEC with SAM bound. (B) Average number of contacts (over every 100 time steps at which coordinates are recorded) within different helices as a function of time for the riboswitch without SAM during a force ramp simulation. We define that two nucleotides form a contact if the distance between them is less than Rc = 1.3 nm.
The order of unfolding is also reflected in the unfolding dynamics, which is illustrated for a representative trajectory in Fig. 2B using the time dependent changes in the number of contacts involving the helices. In particular, the intermediate states, at z~14 nm and z~9 nm are identified, by tracking the number of contacts within the helices (Fig. 2B). The order of unfolding, represented by rupture of contacts involving the helices, shows that P1 and P4 are the first to unfold, occuring nearly simultaneously. Subsequently, P2 is destabilized, which is then followed by P3 unfolding. Thus, both in FEC as well as in the unfolding trajectories SAM-III unfolds by the same route.
After the riboswitch is completely unfolded, we reduced the force, with the same loading rate but with the opposite sign, to initiate refolding. During the refolding process, the two intermediate states with extension, z = 14 nm and z = 9 nm, corresponding to P3 folded state and P2/P3 folded state, respectively, are formed. Taken together, these results demonstrate that the same intermediates are populated during the folding and unfolding processes. Therefore, we conclude that these are equilibrium intermediates in the protocol used in our pulling simulations.
Refolding upon stepwise reduction in force
In single molecule pulling experiments different protocols can be used to quench the force from high to low values.32,33 Using a stepwise reduction in force (Fig. 3A), we initiated refolding to determine the order of folding of SAM-III riboswitch. Starting from f = 19 pN, we decreased the force by 1 pN every 17.7 ms (Fig. 3A), which corresponds to a loading rate of ~56 pN/s. A sample folding trajectory, measuring the end-to-end distance (or extension) of the SAM-III riboswitch as a function of time (Fig. 3B), shows that when the force is decreased to a value less than 16 pN, z(t) decreases to ~ 14 nm, which signals folding of P3. Note that formation of P3 when z ~ 14 nm (Fig. 3B) corresponds to the peak at the same distance in Fig. 2A, reporting the histograms of z during pulling simulations at a constant loading rate. Only at t > 90 ms there are signs of formation of P2 (indicated by a small plateau at z ~ 9 nm in Figs. 3B and 3C, and a peak in P(z) at the same distance in Fig. 2A). At f ~ 14 pN, P4 and P1 fold nearly simultaneously (indicated by grey lines in z(t) in Fig. 3B). Thus, even the protocol involving a stepwise reduction of force cannot fully resolve the folding of P1 and P4 because they form nearly concurrently.
Figure 3.

(A) Step wise reduction in force starting from an initial stretch force fs to a final quench force fq. The force starts at fs = 19 pN and decreases by 1 pN for every 17.7 ms till fq = 12 pN is reached. (B) End-to-end distance as a function of time for the refolding of the riboswitch in the presence of metabolite SAM upon stepwise decrease of force as shown in (A). (C) A blowup of the time traces of the extension from (B) between t = 100 ms and t = 130 ms, during which the f is reduced to 13 pN. Hopping between multiple values of the extension are seen.
If the value of the force is fixed at f = 13 pN the riboswitch hops between the four states (U, P3, P2/P3, and F) (Fig. 3C). Interestingly, Fig. 3C shows that there is no direct transition to the folded state from either U or P3. In contrast, P2/P3 state (blue color, z ~ (8–10 nm)) is kinetically connected to both the F and U states. Thus, it is likely that the major transition state to unfolding involves the rupture of P3/P2 states.
We also simulated the refolding of SAM-III riboswitch by quenching the force from an initial high force to a constant low force value in a single step. When the force is quenched from 20 pN to 0 pN, a completely unfolded SAM-III riboswitch is fully folded in less than 0.1 ms (Fig. 4A). The simulations, reporting distances between specific nucleotides on the four helices, show a folding pathway in which P3 folds first, P2 folds second, then P4 and finally P1 folds (U → P3 → P3/P2 → P3/P2/P4 → F), as shown in Fig. 4B. Thus, all probes of refolding establish that folding and unfolding occur by the same pathway in a hierarchical manner.
Figure 4.

(A) A typical folding trajectory expressed using various distances zi, j between nucleotides i and j of the riboswitch, with bound SAM, as a function of time when the force is quenched from fs = 19 pN to fq = 0 pN. The nucleotides i and j are chosen as reporters of the individual helices and the folded state. (B) Number of contacts within different helices as a function of t during refolding upon force quench. The riboswitch folds in four clear steps: (i) P3 folds at t ~ 0.01 ms, (ii) P2 at t ~ 0.032 ms, (iii) P4 folds at t ~ 0.052 ms, and (iv) P1 folds, resulting in the the fully folded state at t = τF ~ 0.065 ms. Here, τF is the folding time at fs = 0 pN.
Force-dependent folding landscapes
The multiple steps in the hierarchical folding of SAM-III are reflected in the probability distributions, P(z), of the extension, z. We calculated P(z) from the folding trajectories, reporting z as a function of t (see Fig. 5A for a sample trajectory at f = 9pN). The free energy profiles were obtained from the P(z) using G(z, f) = −kBTlnP(z). In the absence of SAM, when f < 9 pN, the folded state (Figs. 5 and 6A) is the most stable state. When 9 pN < f < 11 pN, the most stable state becomes the P3 folded state. Binding of SAM consolidates the formation of helix P1 and P4, further stabilizing the folded state. As shown in Fig. 6A, at f = 9 pN, SAM binding stabilizes the folded state by ~ 12 kBT, and increases the energy barrier for leaving the folded state by ~ 3 kBT. The distance from the folded state (~ 2 nm) to the first barrier in the absence of SAM is ~ 2 nm, which indicates unzipping of 2.5 base pairs, assuming a contour length increase of 0.4 nm/nt. The position of the barrier is in the middle of helix P1, which means that the main barrier in the first step towards global unfolding of the riboswitch is the unzipping of P1. In the presence of SAM, the position of the first barrier shifts to ~ 5 nm, implying that 4 base pairs of P1 next to the nucleotide G48 (Fig. 1A) that has direct contacts with SAM are ruptured at the transition state. Thus, disruption of contacts with SAM becomes the key barrier in the first unfolding step.
Figure 5.

(A) Time trace of extension, z, of the SAM-III riboswitch without the metabolite at f = 9 pN. (B) and (C) From time traces, such as the one in (A), we calculated the probability distributions, P(z)s of extension z. The time traces were obtained from constant force simulations with each at least 150 ms long. (B) Distributions P(z)s in the apo state of the RNA at various f values. P(z) at f = 9 pN (green curve) shows four peaks, corresponding to F, P2/P3, and P3 states, and one at z ~ 17.5 nm representing the unstable U state. The ΔP1 state (P1 unfolded, with other helices intact), at z ~ 5.5 nm, is visited transiently, with very low probability. The riboswitch stays mostly unfolded when f > 11 pN. In the force range, 9 pN < f < 11 pN, the P3 folded state is the most stable. At f = pN the riboswitch iss fully folded (red curve). The riboswitch goess from the unfolded to the folded state following the pathway, U → P3 → P2/P3 → F, when force decreases from a large to a small value. (C) Same as (B) except SAM is bound to RNA showing that the intermediate states in (B) are only transiently present. In the presence of SAM, the riboswitch stays mostly unfolded when f > 13 pN. As f decreases to below 13 pN, the riboswitch transits to the folded state with z = 2 nm with G1 and U53 not paired (Fig. 1A). At forces f < 8 pN, G1 and U53 forms a base pair with z = 1 nm.
Figure 6.

(a) Free energy profiles as a function of z for SAM-III riboswitch without (red) and with (purple) SAM at f = 9 pN. Without SAM, the folded state is slightly more stable than P2/P3 and P3 states by 1–2 kcal/mol. Binding of SAM significantly increases the stability of the folded state. (B) Transition rates between the folded state (F) and P2/P3 (both P2 and P3 are folded, but P1 and P4 disrupted) states without and with bound SAM. The lines show the rates calculated using Eq.(1), and the symbols are the rates obtained directly from an ensemble of folding trajectories, z(t). The diffusion coefficient is chosen as D ~ 1.24×10⁵ nm2/s by equating the rates of F → P2/P3 transition at f = 8 pN calculated by the two different methods. In the absence of SAM, the transition rate between F and P2/P3 state is ~ 102 –103 s−1 at f ~ 9 pN. The SAM binding stabilizes the folded state and reduces the F → P2/P3 transition rate by 2 orders of magnitude.
Hopping rates from folding landscapes
The utility of the free energy profiles, G(z, f), is that they can be used to obtain force-dependent transition rates using the theory of mean first-passage times.8,34 The rate of transition, from an initial point xA in one state to the final point xB in another, is given by
| (1) |
where DA→B is the diffusion coefficient along the extension coordinate for transition between states A and B, β =1/(kBT), x0 = −∞ if xA < xB, and x0 = ∞ if xA > xB. Following our earlier work,8 we calculated the diffusion coefficient, DA→B by equating the transition rate calculated using Eq.(1) to that obtained from time traces obtained in simulations at one particular force value, which for the SAM-III riboswitch is f = 8 pN.
In order to establish the efficacy of Eq.(1), we used G(f, z), calculated using simulations, and obtained the hopping rates kF→P2/P3 and kP2/P3→F. The results can be directly compared to the rates calculated from the folding trajectories (see Fig. 5A for an example). We chose the P2/P3 (P1 and P4 disrupted) because this state is poised to bind SAM, and hence is most relevant for control of translation. Moreover, the P2/P3 state (both P2 and P3 are folded, while P1 and P4 are disrupted) is kinetically connected to the F state. In the absence of the metabolite SAM, the transition rates between the folded state and the P2/P3 state calculated using Eq.(1) are in good agreement to those obtained from time traces of extension, as shown in Fig. 6B. The force at which kF→P2/P3 ≈ kP2/P3→F, without SAM, is about 9 pN, and the associated energy barrier for leaving the folded state is about 6 kBT. The transition rate is about 102–103 s−1. Binding of SAM stabilizes the folded state, and increases the energy barrier for escaping from the folded state by ~ 3kBT, which reduces the rate of F → P3 transition by 2 orders of magnitude at f = 9 pN. The force at which kF→P2/P3 ≈ kP2/P3→F increases to ~ 13 pN. The estimated transition rate for the F → P2/P3 transition, at zero force, is on the order of 10 s−1. With the binding of SAM, the rate of unfolding P1 and P4 decreases significantly (by nearly three orders of magnitude) due to the deeper well of the folded state and higher energy barrier for transition from the folded state. This stabilizes the formation of helices P1 and P4, and hinders the binding of 30S ribosomal subunits to the Shine-Dalgarno sequence of the SAM-III riboswitch. Consequently, translation is inhibited.
The folding landscape of the SAM-III riboswitch shows that rupture of P3 is the last step on global unfolding and only can be disrupted when f > 12 pN. This is relevant because switching between alternative folding patterns, controlled by the metabolite concentration, for a full SAM-III riboswitch only involves the unfolding of P1, P4, and P2.26 Helix P3 is folded in both the ‘OFF’ and the ‘ON’ states, which leads to the conclusion that P3 is stable during translation.
Force stretch-quench (fs − fq) cycles
In the conventional use of the single molecule force spectroscopy (SMFS) (force ramp or force clamp) only those states that are populated in the accessible force range can be determined. The ability to resolve all accessible states is determined by a number of factors including the drag on the beads, handle characteristics, and instrumental time resolution. In order to decipher if hidden states are populated, it is possible to use SMFS in unconventional ways. We showed elsewhere35 that force pulses during stretch-quench cycles can be used to uncover elusive states through which the biomolecule folds (see Figs. 7 and 8 for schematic illustrations). We started from a fully unfolded riboswitch, prepared at a high stretching force, fs, and quenched the force to fq, smaller than the critical unfolding force, fc, for folding for a time period tq to initiate refolding. We then increased the force to fs (> fc ≈ 12 pN for SAM-III riboswitch) rapidly, until the riboswitch was completely unfolded, and then quenched the force again. By repeating this process for varying time period, tq, folding can be interrupted, and the states that are difficult to capture in a single or stepwise quenching of force can be resolved.
Figure 7.

(A) A sample trajectory of the end-to-end distance as a function of time for the riboswitch in the presence of SAM during the stretch-quench (fs − fq) cycles with tq = 0.07 ms, fs = 20 pN, and fq = 0 pN. The green line represents the force changes during the fs − fq cycles. (B) Same as (A) except tq = 0.5 ms. Comparison of (A) and (B) shows finger print of states in (A) but are hidden in (B). (C) Distributions, P(τU) of unfolding times for the RNA riboswitch with SAM bound obtained during the fs − fq cycles (see (A) and (B)) with relaxation time period, tq = 0.01 ms, 0.03 ms, 0.07 ms, 0.2 ms, and 0.5 ms. During tq the force f = fq = 0 pN. For tq in red P(τU)s are invariant, which means that these tq values are large enough for the RNA to fold.
Figure 8.
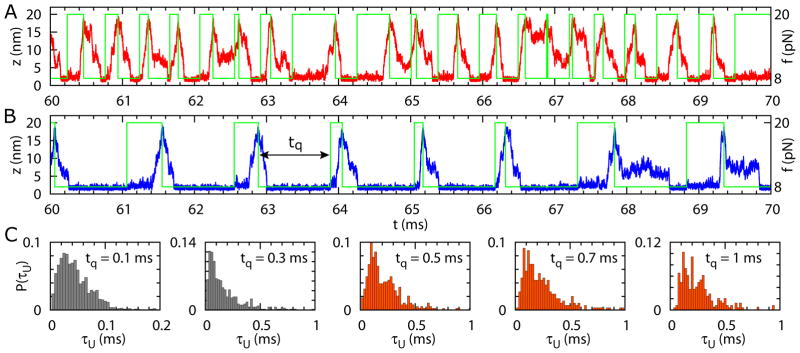
(A) A sample trajectory of the end-to-end distance as a function of time for the riboswitch in the presence of SAM during the stretch-quench (fs − fq) cycles with tq = 0.3 ms, fs = 20 pN, and fq = 8 pN. The green line represents the force changes during the fs − fq cycles. (B) Same as (A) except tq = 1 ms. (C) Distributions, P(τU) of unfolding times for the RNA riboswitch with SAM bound obtained during the fs − fq cycles (see (A) and (B)) with relaxation time period, tq = 0.1 ms, 0.3 ms, 0.5 ms, 0.7 ms, and 1 ms. During tq the force f = fq = 8 pN. For tq in red P(τU)s are invariant, which means that these tq values are large enough for the RNA to fold.
We executed the protocol of varying forces by fs−fq cycles in simulations in the presence of metabolite SAM, and calculated the distributions of unfolding times for various tq values. If tq is much smaller than the folding time τF, the riboswitch is unlikely to reach the folded state during the relaxation time period before it is stretched again. If tq is much larger than τF(fq), the riboswitch will fold with substantial probability during the relaxation time period. In the limit tq/τF ≫ 1, the distributions of unfolding times during the stretch-quench cycles reduce to the distributions of unfolding times probed in conventional experimental set up in which fq → fs reduction is achieved in a single step. When tq ~ τF, the riboswitch would sometimes reach the fully folded state during the relaxation time, and sometimes would not fully fold before the stretching starts (Fig. 7A). Fig. 7B shows that the riboswitch reaches the folded state if tq ≫ τF. Thus, by varying tq from tq ≪ τF to tq ≫ τF, we expect changes in the distribution, P(τU), of unfolding times when tq < τF, and a convergence in P(τU) when tq > τF, when most of the riboswitches reach the folded state. More importantly, variations in tq allow us to probe certain states of the riboswitch samples, which may be hard to detect in the normal use of SMFS.
The distributions of the unfolding times, at various tq values, in the presence of the metabolite SAM, during the stretch-quench cycles with fs = 20 pN and fq = 0 pN, are shown in Fig. 7C. For relaxation time periods tq > 0.07 ms, the distributions of unfolding time become similar, which means the riboswitch is likely to reach the fully folded state during the relaxation time period. The minimum value of tq above which P(τU) becomes similar is about the same value of the folding time at f = fq. Indeed, with tq = 0.5 ms, during which the riboswitch always reaches the folded state, the average folding time τF = 0.063 ms, which is consistent with the minimum tq above which P(τU) does not change significantly. The dependence of average τU on tq (Fig. 9) shows that τU increases sharply with tq when tq < τF. The increase slows down when tq > τF, and the value of τU reaches convergence when tq > 2τF.
Figure 9.
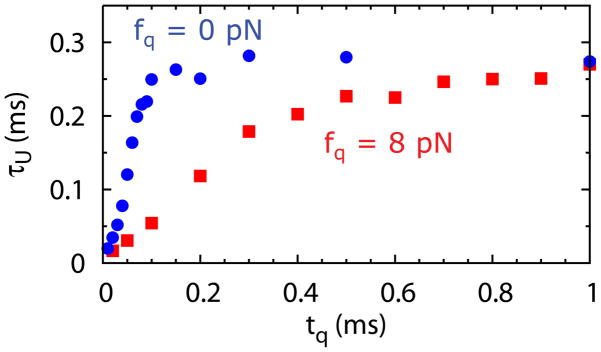
Average unfolding time, τU, as a function of tq for the SAM-III riboswitch with SAM bound obtained during the fs − fq cycles, with fs = 20 pN.
We summarize the results in Fig. 8 for fq ≠ 0, which is more easily realized in LOT experiments. Figures 8A and 8B show sample folding trajectories (z(t) as a function of t) during the cycles with fs = 20 pN and fq = 8 pN at two tq values. Just as in Figs. 7A and 7B, at smaller tq states that are not resolved at longer tq become visible. The distributions of unfolding times become similar when tq > 0.3 ms (Fig. 8C). The average folding time during the cycles with tq = 1 ms, during which the riboswitch is likely to reach the folded state, is τF = 0.305 ms. The dependence of τU on tq also shows that the increase of τU slows down when tq > 0.3 ms. The value of τU reaches a plateau when tq > 0.6 ms(~ 2τF). The simulations using the stretch-quench cycles provide a way to estimate the folding time and unfolding time of the riboswitch, over a wider range of forces, which may be difficult to access in the standard force clamp simulations.
Resolving the formation of P1 and P4 helices
The distributions of the extension, z, of the SAM-III riboswitch at the end of a quenching period during the fs − fq cycles, with fs = 20 pN and fq = 8 pN at various tq values are displayed in Fig. 10. For large tq (tq ≫ τF), the distribution is peaked around z ~ 2 nm because the riboswitch reaches the folded state with substantial probability. For small tq, however, several peaks appear in P(z). The positions of the peaks correspond to the extension of distinct intermediate states. When tq = 0.1 ms, z(t = tq) is most likely to be around 13 nm and 7.5 nm, corresponding to ΔP1ΔP2ΔP4 (helices P1, P2, and P4 are disrupted) and ΔP1ΔP4 states, respectively. Because of the short quenching time, the probability of complete folding (z(tq) ~ 2 nm) is low. As tq increases to 0.2 ms, the distribution of z(tq) around the fully folded state increases. In addition, a peak appears around z ~ 5 nm, which corresponds to the ΔP1 state (P1 is unfolded) as shown in the top panel in Fig. 10. The peak around the ΔP1 state, where only P1 is unfolded, appears to be transient since the peak does not appear at tq < 0.1 ms or tq > 0.3 ms. This is because there are 6 base pairs in P1 and only 2 base pairs in P4. When the force is large enough to unfold P1, it most likely unfolds P4 as well in a very short time. Conversely, when the force decreases enough to allow P4 to fold, P1 also folds rapidly following the formation of P4. It is worth pointing out that only through the use of fs − fq cycles we can resolve the differences in the folding of P1 and P4. In other ways of quenching or increasing the force (Figs. 2–4) the formation or disruption of P1 and P4 occurs nearly simultaneously. By varying tq, which is another experimental control, these events can be differentiated.
Figure 10.

The distribution of the extension, z, of the SAM-III riboswitch at the end of a quenching period (t =tq) during the stretch-quench cycles, with fs = 20 pN and fq = 8 pN. When tq = 0.1 ms, which is much smaller than the folding time, τF, there are several peaks in P(z), which correspond to the states that are sampled. The position of the peaks corresponds to the most probable extensions of the intermediate states. As tq increases, the distribution converges to around z(tq) ~ 2 nm, corresponding to the fully folded state. By varying tq elusive states can be captured. For example, with τq = 0.1ms a state with P2, P3, and P4 intact but P1 disordered is visible (z ~ 5 nm) in the histogram in red.
Dependence of folding rates on f
In order to obtain accurate estimates of the folding time, τU→F(fq), starting from the U state, we used a large stretching force fs (= 30 pN) to fuly unfold the riboswitch. Subsequently, we quenched the force to fq in a single step, and followed the dynamics till the riboswitches reaches the F state for the first time, which is the first passage time. Immediately after reaching the F state, we stretched the RNA to the U state, and maintained f = fs to ensure that the ribsowitch is fully unfolded. The force was then reduced again to fq and the first passage time was calculated. This process was repeated multiple times to obtain the distribution of first passage times from which the mean τU→F(fq) was calculated. The blue circles in Fig. 11 give the results obtained using this procedure. The value of τU→F(fq = 0) = 0.065 ms coincides with the result in Fig. 7A obtained from the minimum tq above which P(τU) is invariant, implying that different protocols used to calculate folding times yield the same results.
Figure 11.

The logarithm of the average folding time, τF(fq), as a function of fq for the riboswitch in the presence of SAM. The fs − fq cycles are initiated with fs = 30 pN and ts = 0.1 ms to unfold the RNA. The dots represent results obtained directly from the time traces of the extension generated during the fs − fq cycles. The line represents τF(fq) calculated from Eq.(1), with DU→F chosen as 8.46×10⁴ nm2/s. The insets show two sample folding trajectories with fq = 1 pN and fq = 8 pN.
In order to further establish the efficacy of Eq.(1) in estimating τU→F(fq) we used the simulated equilibrium free energy profile at f̄ = 12 pN (Fig. 6A), and calculated the profile at other values of f using
| (2) |
We used Eq.(1) with G(z, f) (Eq.(2)) to calculate τU→F(fq) with DU→F evaluated at f =9 pN from explicit simulations. Remarkably, the mean first passage time formula with a single parameter provides an excellent estimate of the folding times over the entire range of fq, including at fq = 12 pN, where the folding time is slow.
Concluding Remarks
We have studied the folding and unfolding of the SAM-III riboswitch under tension in order to estimate the forces and time scales associated with unfolding of specific regions that are likely to be involved in the control of translation. The folding landscape, with multiple intermediate states, shows that helix P3 (Fig. 1) is the last to unfold upon application of force, requiring an unfolding force ~ 2–4 pN larger than other helices in the riboswitch. This suggests that SAM-III may have evolved to control gene regulation using P3 as a scaffold, which might facilitate ribosome’s access to the SD sequence for ribosomal by formation and disruption of helices P1, P4, and P2. A corollary of this inference is that mutations, which stabilize P3, should compromise the dynamic range of SAM-III.
Relative stability of ON and OFF states of SAM-III
The stable P3 helix might serve as a scaffold for folding, enabling disruption of P1 and P4 helices for binding and unbinding of SAM without globally unfolding the RNA. Binding of SAM enhances the stability of P1 and P4, and substantially increases the free energy barrier for leaving the ‘OFF’ state. The difference in the free energy between the ‘ON’ (apo) and ‘OFF’ (holo) states at f = 0 can be estimated from the free energy profile, G(z), at f = 9 pN in Fig. 6B. The free energy difference between the ‘OFF’ and ‘ON’ states at zero force is approximately given by ΔG ≈ ΔG(zN, f)+ΔzN f, where ΔzN is the shift in the location of the minima between the ON and OFF states (Fig. 6B). With f = 9 pN, and ΔzN ≈ 1 nm we find that ΔG ≈ 9.1 kcal/mol. The estimate based on experiments is 8.6 kcal/mol,26 which is surprisingly close to the theoretical prediction, especially considering that the SOP energy function was not optimized to reproduce any measurement.
Detecting elusive states using fs − fq cycling
The proposed strategy of using force stretch-quench (fs − fq) cycles, which (in principle) can be implemented using the LOT setup, provides a unique way of obtaining a finger print of states (see Figs. 7 and 8) that may otherwise be elusive. In the case of the SAM-III riboswitch, the fs − fq cycling simulations have enabled us to resolve the folding of P4 and P1, which occur nearly simultaneously. In addition, this method also provides a way of measuring the distribution of unfolding and folding times provided repeated fs − fq cycling experiments on the same molecule can be performed. Of course, current experimental time resolution, achievable in LOT experiments,36,37 can make it difficult to implement the fs − fq cycling. Optimistically, the best time resolution in LOT experiments is ~ 100 μs reported in force-clamp studies of leucine zipper.38 The quench time, tq, for SAM-III riboswitch is in the range of tenths of milliseconds. It should be noted that tq depends on the system. Thus, for RNA molecules with transition times exceeding ~ 500 μs the proposed fs − fq cycling can be implemented. As the LOT time resolution improves we believe that the proposed way of detecting these elusive states may prove useful.
The mean unfolding (folding) time where is the smallest quench (stretch) time (Figs. 7 and 8) beyond which the distribution of unfolding (folding) times are invariant. In force clamp methods estimates of folding and unfolding times require that a number of transitions between the states of interest be observed. However, at high (low) forces the RNA molecule is essentially pinned in the unfolded (folded) states, which prevents getting accurate values of the folding and unfolding times. In contrast, in the novel fs − fq cycling method the folding times are obtained from the distribution of unfolding times, which can be obtained at arbitrary forces. This can be realized using current experimental setup.
Force-dependent hopping rates
Interestingly, the f-dependent transition rates between two distinct states can be accurately calculated using Eq.(1) over a limited force range, provided the force-dependent diffusion constant is known. In order to use Eq.(1), accurate measurement of G(z) from folding trajectories generated in a typical LOT setup is needed.39 The collective effects, in Eq.(1), are in DA→B, which in principle can be computed using simulations. However, the present work shows that, over a limited f range, DA→B does not depend sensitively on f nor on the shapes of G(z, f). For a quick estimate of DA→B, one can use dimensional arguments to obtain DA→B ≈ a2/τ0, where a ≈ 0.7 nm (approximate distance between phosphates in RNA) and τ0 ≈ 10−6 s, the value of prefactor in RNA folding.40 This produces an estimate of 4.9×10⁵ nm2/s, which is within one order of magnitude of the values used to generate the results in Fig. 6B and Fig. 11 (see the captions to these figures). We note in passing that the success of Eq. (1) in making reliable predictions for transition rates over a small range of forces does not imply that z is a good reaction coordinate (for additional discussion on this point see Lin et al.10). Rather, it only means that accurate measurements of G(z) can be used to obtain hopping rates provided the many dimensional aspects hidden in DA→B (or τ0) can be explicitly calculated.
Implications for function
It appears that the kinetic processes in riboswitches that control transcription may be different from those that regulate translation. In the former case, the ability to function as a switch efficiently depends on an interplay of a number of time scales.15,41,42 Nominally, they are the bimolecular binding rate (kb), the folding times of the aptamer and the time scales to switch and adopt alternate conformations with the downstream expression platform, and the rate of transcription. In the ‘OFF’ switches (transcription is terminated upon metabolite binding), a decision to terminate or complete transcription has to be made before the terminator is synthesized, which puts bounds on the transcription rate, kb, and the aptamer folding rates. For typical values of these parameters in both FMN15 and pbuE A-riboswitches,16 efficient function mandates that the riboswitches be under kinetic control, which implies that the ‘OFF’ and ‘ON’ states are not in equilibrium.
The SAM-III function, which controls translation, is different, as first demonstrated by Smith et al.43 The major time scales that control the function of SAM-III riboswitch, and presumably those that regulate translation in general, are kb, kdis, and kmRNA where kdis is the rate of disassociation of SAM from the complex with the riboswitch, and kmRNA is the degradation rate of mRNA. Thus, the only clear bound on the function of SAM-III is that both kdis and kb[M] ([M] is the concentration of SAM) be much greater than kmRNA. These conditions imply that the SAM concentration [M]≫ kmRNA/kb. Using the values of kb ~ 0.11 μM−1s−1 and kdis ≈ 0.089 s−1,43 we obtain that the SAM concentration has to exceed about 50 nM where we have used the estimate for kmRNA ≈ 3 min−1. It is worth pointing out that our estimates of folding and unfolding times (needed to accommodate SAM binding) based on simulations at low forces are much less than kmRNA, the inverse of which sets the longest time for translational control. Therefore, the transition between the OFF and ON states can occur multiple times before mRNA is degraded, which gives additional credence to the argument that the function of SAM-III is under thermodynamic control. It is worth noting that these arguments and the ones used in previous studies43 are tentative because it is assumed that transcription and translation are not coupled. There is evidence that in bacteria transcription and translational speeds are similar,44 which might complicate the model. However, because kmRNA is small relative to other rates, it is still possible that riboswitches regulating translation are more likely to be under thermodynamic even if the assumption of decoupling between transcription and translation is relaxed.
Methods
Self-organized polymer model
We represent the riboswitch using the self-organized polymer (SOP) model that has been successfully used in a number of studies.8,30,31,45,46 In the SOP model, each nucleotide is represented as a single interaction site. We model the metabolite SAM as two sites with one representing the adenosyl part (A), and the other corresponding to the methionine part including sulfur (M) (see Fig. 1C).
The SOP energy of the RNA in the presence of bound SAM is VT = VRIB +VRIB−SAM, where VRIB =VFENE +VNB with
| (3) |
| (4) |
In Eq.(3) the chain connectivity term is VFENE with k =2000 kcal/(mol·nm2), R0 =0.2 nm, ri,i+1 is the distance between two adjacent nucleotides i and i+1, and is the corresponding distance in the native structure. The term, VNB, in Eq.(3) describes the non-bonded interactions, which include the stabilizing forces between the nucleotides that are in contact in the native state. The interactions between the nucleotides that form non-native contacts are taken to be repulsive. Two nucleotides i and j are in native contact, Δi j = 1, when the distance between them in the native structure is within a cutoff distance, Rc = 1.3 nm, for |i − j| > 2. If the distance is larger than Rc, Δi j = 0.
We use two values for the parameter εh depending upon whether the interaction between two nucleotides in native contact are clarified as secondary or a tertiary interaction. If the two nucleotides are within a hairpin or helix, then εh = εs, otherwise, εh = εt. The largely hierarchical nature of RNA folding [16] suggests that the strength of the secondary interaction is greater than the tertiary interaction. In our simulations, we set εs = 0.7 kcal/mol, and εt/εs = 1/2, which capture the balance between secondary and tertiary interactions.8 The strength of the repulsive interaction for non-native contacts is parametrized by εl, which is set to 1.4 kcal/mol. We choose σ = 0.7 nm, and σ* = 0.35 nm (Eq. (4)) for i, i+2 pairs to prevent the flattening of the helical structure when the overall repulsion is large.
The interaction between SAM and the riboswitch, VRIB−SAM, is taken to be,
| (5) |
The parameter εSAM is set to εs for the interaction between SAM and the nucleotides that are in contact with SAM. In the native structure, there are 23 nucleotides that are in contact with either the adenosyl or the methionine part of SAM. To prevent SAM from drifting away from the riboswitch during the simulation, a bond is added between the site representing the adenosyl part of SAM and G7 of the riboswitch (Fig. 1).
Simulations
The dynamics of the system is described using the Langevin equation in the overdamped limit, or Brownian dynamics. The equation of motion for a nucleotide i is given by
| (6) |
where γ is the friction coefficient, and mi is the mass of nucleotide i. Fi(t), the random force, satisfies 〈Fi(t)〉 = 0 and 〈Fi(t)Fi(t′)〉 = 2kBTγmiδ(t − t′), where the averages are over an ensemble of realizations or trajectories.
The integration step in the simulation is , where the typical value for τL for nucleotides is 4 ps, and the integration step size is h = 0.05τL. For the overdamped limit, we use , which approximately corresponds to the friction coefficient for a nucleotide in water.47 For εh = 0.7 kcal/mol, this results in an integration time step of about 23 ps.
In the force clamp (or force jump) simulations, an external force is applied directly to the 5′-end of the riboswitch, while the 3′-end is fixed. In the force ramp simulations, the 5′-end is attached to a spring with spring constant ks = 0.15 pN/nm while the spring is pulled with a constant speed vs = 6.4×10² nm/s, which gives a loading rate of rf = ksvs = 96 pN/s. Such a value of rf can be realized in LOT experiments but is typically about a factor of (10–20) larger than usually employed in such experiments.
Acknowledgments
We thank Michael Hinczweski and Pavel Zhuravlev for useful discussions and comments on the manuscript. This work was supported by a grant from the National Institutes of Health (GM 089685).
References
- 1.Winkler WC, Breaker RR. Annual Review Microbiology. 2005;59:487–517. doi: 10.1146/annurev.micro.59.030804.121336. [DOI] [PubMed] [Google Scholar]
- 2.Cheah MT, Wachter A, Sudarsan N, Breaker RR. Nature. 2007;447:497–500. doi: 10.1038/nature05769. [DOI] [PubMed] [Google Scholar]
- 3.Breaker RR. Science. 2008;319:1795–1797. doi: 10.1126/science.1152621. [DOI] [PubMed] [Google Scholar]
- 4.Serganov A, Nudler E. Cell. 2013;152:17–24. doi: 10.1016/j.cell.2012.12.024. [DOI] [PMC free article] [PubMed] [Google Scholar]
- 5.Montange RK, Batey RT. Ann Rev Biophys. 2008;37:117–133. doi: 10.1146/annurev.biophys.37.032807.130000. [DOI] [PubMed] [Google Scholar]
- 6.Fiegland LR, Garst AD, Batey RT, Nesbitt DJ. Biochemistry. 2012;51:9223–9233. doi: 10.1021/bi3007753. [DOI] [PMC free article] [PubMed] [Google Scholar]
- 7.Larson MH, Landick R, Block SM. Mol Cell. 2011;41:249–262. doi: 10.1016/j.molcel.2011.01.008. [DOI] [PMC free article] [PubMed] [Google Scholar]
- 8.Lin JC, Thirumalai D. J Am Chem Soc. 2008;130:14080–14081. doi: 10.1021/ja8063638. [DOI] [PubMed] [Google Scholar]
- 9.Whitford PC, Schug A, Saunders J, Hennelly SP, Onuchic JN, Sanbonmatsu KY. Biophys J. 2009;96:L7–L9. doi: 10.1016/j.bpj.2008.10.033. [DOI] [PMC free article] [PubMed] [Google Scholar]
- 10.Lin JC, Hyeon C, Thirumalai D. J Phys Chem Lett. 2012;3:3616–3625. doi: 10.1021/jz301537t. [DOI] [PMC free article] [PubMed] [Google Scholar]
- 11.Allner O, Nilsson L, Villa A. RNA. 2013;19:916–926. doi: 10.1261/rna.037549.112. [DOI] [PMC free article] [PubMed] [Google Scholar]
- 12.Quarta G, Sin K, Schlick T. PLOS Comp Biol. 2012;8:e1002368. doi: 10.1371/journal.pcbi.1002368. [DOI] [PMC free article] [PubMed] [Google Scholar]
- 13.Feng J, Walter NG, Brooks CL., III J Amer Chem Soc. 2011;133:4196–4199. doi: 10.1021/ja110411m. [DOI] [PMC free article] [PubMed] [Google Scholar]
- 14.Priyakumar UD, MacKerell AD., Jr J Mol Biol. 2010;396:1422–1438. doi: 10.1016/j.jmb.2009.12.024. [DOI] [PMC free article] [PubMed] [Google Scholar]
- 15.Wickiser JK, Winkler WC, Breaker RR, Crothers DM. Molecular Cell. 2005;18:49. doi: 10.1016/j.molcel.2005.02.032. [DOI] [PubMed] [Google Scholar]
- 16.Frieda KL, Block SM. Science. 2012;338:397–400. doi: 10.1126/science.1225722. [DOI] [PMC free article] [PubMed] [Google Scholar]
- 17.Winkler WC, Nahvi A, Sudarsan N, Barrick JE, Breaker RR. Nat Struct Biol. 2003;10:701–707. doi: 10.1038/nsb967. [DOI] [PubMed] [Google Scholar]
- 18.Weinberg Z, Rugulski EE, Hammond MC, Barrick JE, Yao Z, Ruzzo WL, Breaker RR. RNA. 2008;14:822–828. doi: 10.1261/rna.988608. [DOI] [PMC free article] [PubMed] [Google Scholar]
- 19.Corbino KA, Barrick JE, Lim J, Weiz R, Tucker BJ, Puskarz I, Mandal M, Rudnick ND, Breaker RR. Genome Biology. 2005;6:R70. doi: 10.1186/gb-2005-6-8-r70. [DOI] [PMC free article] [PubMed] [Google Scholar]
- 20.Poiata E, Meyer MM, Ames TD, Breaker RR. RNA. 2009;15:2046–2056. doi: 10.1261/rna.1824209. [DOI] [PMC free article] [PubMed] [Google Scholar]
- 21.Fuchs RT, Grundy FJ, Henkins TM. Nat Struc Mol Biol. 2006;13:226–233. doi: 10.1038/nsmb1059. [DOI] [PubMed] [Google Scholar]
- 22.Weinberg Z, Wang JX, Bogue J, Yang J, Corbino K, Moy R, Breaker RR. Genome Biol. 2010;11:R31. doi: 10.1186/gb-2010-11-3-r31. [DOI] [PMC free article] [PubMed] [Google Scholar]
- 23.Wang JX, Lee ER, Morales DR, Lim J, Breaker RR. Mol Cell. 2008;28:691–702. doi: 10.1016/j.molcel.2008.01.012. [DOI] [PMC free article] [PubMed] [Google Scholar]
- 24.Gilbert SD, Rambo RP, Tyne DV, Batey RT. Nat Struc Mol Biol. 2008;15:177– 182. doi: 10.1038/nsmb.1371. [DOI] [PubMed] [Google Scholar]
- 25.Lu C, Smith AM, Fuchs RT, Ding R, Rajashankar K, Henkins TM, Ke A. Nat Struc Mol Biol. 2008;15:1076–1083. doi: 10.1038/nsmb.1494. [DOI] [PMC free article] [PubMed] [Google Scholar]
- 26.Lu C, Smith AM, Ding F, Chowdhury A, Henkin TM, Ke A. J Mol Biol. 2011;409:786–799. doi: 10.1016/j.jmb.2011.04.039. [DOI] [PMC free article] [PubMed] [Google Scholar]
- 27.Anthony PC, Perez CF, Garcia-Garcia C, Block SM. Proc Natl Acad Sci. 2012;109:1485–1489. doi: 10.1073/pnas.1115045109. [DOI] [PMC free article] [PubMed] [Google Scholar]
- 28.Greenleaf WJ, Frieda KL, Foster DAN, Woodside MT, Block SM. Science. 2008;319:630–633. doi: 10.1126/science.1151298. [DOI] [PMC free article] [PubMed] [Google Scholar]
- 29.Neupane K, Yu H, Foster DAN, Wang F, Woodside MT. Nuc Acids Res. 2011;39:7677–7687. doi: 10.1093/nar/gkr305. [DOI] [PMC free article] [PubMed] [Google Scholar]
- 30.Hyeon C, Thirumalai D. Biophy J. 2007;92:731–743. doi: 10.1529/biophysj.106.093062. [DOI] [PMC free article] [PubMed] [Google Scholar]
- 31.Hyeon C, Dima RI, Thirumalai D. Structure. 2006;14:1633–1645. doi: 10.1016/j.str.2006.09.002. [DOI] [PubMed] [Google Scholar]
- 32.Li PTX, Collin D, Smith SB, Bustamante C, Tinoco I., Jr Biophys J. 2006;90:250–260. doi: 10.1529/biophysj.105.068049. [DOI] [PMC free article] [PubMed] [Google Scholar]
- 33.Garcia-Manyes S, Dougan L, Badilla CL, Brujic J, Fernández JM. Proc Nat Acad Sci. 2009;106:10534–10539. doi: 10.1073/pnas.0901213106. [DOI] [PMC free article] [PubMed] [Google Scholar]
- 34.Hyeon C, Morrison G, Thirumalai D. Proc Natl Acad Sci. 2008;105:9604–9609. doi: 10.1073/pnas.0802484105. [DOI] [PMC free article] [PubMed] [Google Scholar]
- 35.Barsegov V, Thirumalai D. Phys Rev Lett. 2005;95:168302. doi: 10.1103/PhysRevLett.95.168302. [DOI] [PubMed] [Google Scholar]
- 36.Manosas M, Wen JD, Li PTX, Smith SB, Bustamante C, I, Tinoco J, Ritort F. Biophys J. 2007;92:3010–3021. doi: 10.1529/biophysj.106.094243. [DOI] [PMC free article] [PubMed] [Google Scholar]
- 37.Wen JD, Manosas M, Li PTX, Smith SB, Bustamante C, I, Tinoco J. Biophys J. 2007;92:2996–3009. doi: 10.1529/biophysj.106.094052. [DOI] [PMC free article] [PubMed] [Google Scholar]
- 38.Gebhardt JCM, Bornschlögl T, Rief M. Proc Natl Acad Sci USA. 2010;107:2013– 2018. doi: 10.1073/pnas.0909854107. [DOI] [PMC free article] [PubMed] [Google Scholar]
- 39.Hinczewski M, Gebhardt JCM, Rief M, Thirumalai D. Proc Natl Acad Sci. 2013;110:4500–4505. doi: 10.1073/pnas.1214051110. [DOI] [PMC free article] [PubMed] [Google Scholar]
- 40.Hyeon C, Thirumalai D. Biophys J. 2012;102:L11–L13. doi: 10.1016/j.bpj.2012.01.003. [DOI] [PMC free article] [PubMed] [Google Scholar]
- 41.Lin JC, Thirumalai D. Biophys J. 2012;103:2320. doi: 10.1016/j.bpj.2012.10.026. [DOI] [PMC free article] [PubMed] [Google Scholar]
- 42.Beisel CL, Smolke CD. PLoS Comp Biol. 2009;5:e1000363. doi: 10.1371/journal.pcbi.1000363. [DOI] [PMC free article] [PubMed] [Google Scholar]
- 43.Smith AM, Fuchs RT, Grundy FJ, Henkin TM. Mol Microbiol. 2010;78:1393– 1402. doi: 10.1111/j.1365-2958.2010.07410.x. [DOI] [PMC free article] [PubMed] [Google Scholar]
- 44.Proshkin S, Rahmourni AR, Mironov A, Nudler E. Science. 2010;328:504–508. doi: 10.1126/science.1184939. [DOI] [PMC free article] [PubMed] [Google Scholar]
- 45.Mickler M, Dima RI, Dietz H, Hyeon C, Thirumalai D, Rief M. Proc Natl Acad Sci. 2007;104:20268–20273. doi: 10.1073/pnas.0705458104. [DOI] [PMC free article] [PubMed] [Google Scholar]
- 46.Hyeon C, Lorimer GH, Thirumalai D. Proc Natl Acad Sci. 2006;103:18939–18944. doi: 10.1073/pnas.0608759103. [DOI] [PMC free article] [PubMed] [Google Scholar]
- 47.Veitshans T, Klimov D, Thirumalai D. Folding and Design. 1997;2:1–22. doi: 10.1016/S1359-0278(97)00002-3. [DOI] [PubMed] [Google Scholar]