

Abstract
Lysine succinylation is a newly identified protein post-translational modification pathway present in both prokaryotic and eukaryotic cells. However, succinylation substrates and regulatory enzyme(s) remain largely unknown, hindering the biological study of this modification. Here we report the identification of 2,580 bacterial lysine succinylation sites in 670 proteins and 2,803 lysine acetylation (Kac) sites in 782 proteins, representing the first lysine succinylation dataset and the largest Kac dataset in wild-type E. coli. We quantified dynamic changes of the lysine succinylation and Kac substrates in response to high glucose. Our data showed that high-glucose conditions led to more lysine-succinylated proteins and enhanced the abundance of succinyllysine peptides more significantly than Kac peptides, suggesting that glucose has a more profound effect on succinylation than on acetylation. We further identified CobB, a known Sir2-like bacterial lysine deacetylase, as the first prokaryotic desuccinylation enzyme. The identification of bacterial CobB as a bifunctional enzyme with lysine desuccinylation and deacetylation activities suggests that the eukaryotic Kac-regulatory enzymes may have enzymatic activities on various lysine acylations with very different structures. In addition, it is highly likely that lysine succinylation could have unique and more profound regulatory roles in cellular metabolism relative to lysine acetylation under some physiological conditions.
Lysine acetylation (Kac)1 is a dynamic and evolutionarily conserved post-translational modification (PTM) that is known to be involved in the regulation of diverse cellular processes (1–9). The status of this modification is controlled by two groups of enzymes with opposing enzymatic activities, lysine acetyltransferases that add an acetyl group to the lysine (Lys or K) residue, and histone lysine deacetylases (HDACs) that remove the acetyl group (10–16). HDACs are grouped into several categories (17): class I (HDAC1, -2, -3, and -8), class IIA (HDAC4, -5, -7, and -9), class IIB (HDAC6 and -10), class III (Sirt1–7), and class IV (HDAC11). The weak deacetylation activities of some HDACs (e.g. Sirt4–7 and HDAC4, -5, and -7–11), as well as the demonstration of Sirt5 as a desuccinylation and demalonylation enzyme, suggest that some HDAC enzymes have activities that are independent of acetylation (18, 19).
For a long period of time, lysine acetylation was considered as a protein modification that was restricted to nuclei (20). The identification of cytosolic Kac substrates and the localization of some HDACs outside nuclei suggest a non-nuclear function of lysine acetylation (13, 21, 22). The first proteomic screening identified hundreds of substrate proteins in cytosolic and mitochondrial fractions and demonstrated high abundance of Kac in mitochondrial proteins and metabolic enzymes (23). This result implies that Kac has diverse non-nuclear roles and can regulate functions of metabolism and mitochondria (23). Since then, we and others have extensively characterized the cellular acetylome (5, 9, 24–26).
The lysine succinylation (Ksucc) and lysine malonylation pathways are two PTM pathways that were recently identified and comprehensively validated in both bacterial and mammalian cells, with multiple substrate proteins identified, using HPLC-MS/MS, co-elution of synthetic peptides, isotopic labeling, Western blotting analysis using pan-anti-Ksucc antibodies, and proteomics analysis (18, 27). We also showed that Ksucc is present in core histones (29). In yeast histones, some Ksucc sites are located in regions where histones make close contact with DNA, suggesting that Ksucc sites may be involved in gene regulation by changing the chromatin structure (29). We then found that Sirt5, a member of the class III family of HDACs, can function as a desuccinylation enzyme in vitro and in vivo (18, 19). In a recent study, we revealed that Sirt5 is a key regulatory enzyme of Ksucc and that Ksucc proteins are abundant among a group of mitochondrial enzymes that are predominantly involved in fatty acid metabolism, amino acid degradation, and the tricarboxylic acid cycle (28). Importantly, Ksucc is very dynamic not only in mammalian cells, but also in bacteria (27, 29). These lines of evidence strongly suggest that lysine succinylation is likely an important PTM in the regulation of cellular functions.
Although key elements of the Ksucc pathway are being identified in mammalian cells, their counterparts in bacteria remain largely unknown. We and others have used a proteomics approach to identify Kac substrates in bacteria (26, 30, 31, 52). The Sir2-like enzyme CobB is the best-studied protein deacetylase in bacteria (8). CobB was initially identified as an enzyme required for the activation of acetyl-CoA synthetase (8). Recently, CobB was shown to play roles in bacterial energy metabolism (31) and stress response (32). Those studies indicated that Kac is an evolutionarily conserved PTM with a role in energy metabolism in prokaryotes. Nevertheless, dynamic changes of lysine acetylation in bacteria have not been studied. In addition, substrates of lysine succinylation and their regulatory enzymes are not known.
In this paper, we report a quantitative proteomic approach based on stable isotope labeling by amino acids in cell culture (SILAC) to identify and quantify changes in bacterial lysine succinylation, as well as lysine acetylation, in response to glucose, a major energy source. Our screening detected 2,580 lysine-succinylated sites in 670 proteins and 2,803 Kac sites in 782 proteins in Escherichia coli. Our quantitative proteomics data show that glucose had a more profound effect on Ksucc than on Kac. In addition, we found that CobB, a known prokaryotic deacetylase, had dual enzymatic activities to catalyze the removal of two structurally different lysine acyl groups, acetyl and succinyl, from the modified lysine residues.
MATERIALS AND METHODS
Materials
E. coli strains MG1655 and AT713 were obtained from the Coli Genetic Stock Center at Yale University (New Haven, CT), and BL21 (DE3) was obtained from Novagen (Millipore Corporation, Billerica, MA). M9 minimal salts, isotopically labeled lysine (l-lysine-13C6,15N2 hydrochloride) and arginine (l-arginine-13C6,15N4 hydrochloride), and other chemicals were purchased as high purity or analytical grade from Sigma-Aldrich, Inc. (St. Louis, MO). Modified sequencing-grade trypsin was purchased from Promega (Madison, WI). C18 ZipTips were purchased from Millipore Corporation (Billerica, MA). MS-grade water and acetonitrile were obtained from Thermo Fisher Scientific (Waltham, MA). Pan-anti-acetyllysine and anti-succinyllysine antibodies were purchased from PTM Biolabs, Inc. (Chicago, IL).
E. coli Cell Culture
E. coli cells were cultured in M9 medium (supplemented with each of the 20 amino acids at 100 mg/l) or M9 medium supplemented with 0.8% pyruvate, 0.8% succinate, or 0.8% glucose. The cells were harvested, lysed, and Western blotted with pan-antibodies against acetyllysine or succinyllysine. Coomassie Blue staining was used for the loading controls.
SILAC Labeling
300 ml of M9 growth medium (supplemented with each of the 20 amino acids at 100 mg/l) was inoculated with E. coli (strain AT713) culture and grown overnight. Cells were harvested when A600 reached 0.8. The cell pellets were washed twice with M9 medium and subsequently transferred into either M9 medium containing light lysine (12C614N2 Lys) and arginine (12C614N4 Arg) and no glucose or M9 medium containing heavy lysine (13C615N2 Lys) and arginine (13C615N4 Arg) and 0.8% glucose. The cells were incubated at 37 °C on a rotary shaker (225 rpm) for about 5 h and harvested during the exponential phase with a comparable OD value. The labeling efficiency of cells cultured in heavy media was greater than 98% as determined by mass spectrometry prior to the proteomics experiment.
Preparation of Protein Lysate, HPLC Fractionation, and Tryptic Digestion
E. coli cells were harvested via centrifugation at 2,000g for 10 min at 4 °C. The pellet was washed twice with ice-cold PBS. The cells were resuspended in ice-cold NETN buffer (100 mm NaCl, 20 mm Tris-Cl, pH 8.0, 0.5 mm EDTA, and 0.5% Nonidet P-40) and sonicated for 5 min with cooling at 1-min intervals. Equal amounts of protein lysate from E. coli grown in either heavy (13C615N2 Lys and 13C615N4 Arg) media or light (12C614N2 Lys and 12C614N4 Arg) media were mixed (40 mg each). The mixture was centrifuged at 100,000g for 10 min. The supernatant was removed and separated in a mixed-bed ion exchange column (polyCAT/WAX (250 × 21.2 mm), PolyLC, Inc.) using a Discovery VP preparative HPLC system (Shimadzu, Kyoto, Japan). The proteins were separated into 62 fractions using a salt gradient from 0% to 100% buffer B (10 mm MES, 800 mm NaCl, pH 6.0) in buffer A (10 mm MES, pH 6.0, 50 mm NaCl) at 4 °C at a flow rate of 16 ml/min. Adjacent fractions were pooled and finally combined into 10 final fractions. Each fraction was precipitated by using 10% trichloroacetic acid (final volume) and 1% sodium deoxycholate (final concentration). The protein pellets were collected, washed twice with ice-cold acetone, and then subjected to trypsin digestion as described previously (23).
Sequential Affinity Enrichment of Peptides Containing Ksucc or Kac Peptides
Peptides containing Ksucc or Kac (hereinafter referred to as Ksucc peptides and Kac peptides, respectively) were sequentially enriched using a procedure described previously (23). Briefly, tryptic peptides from each HPLC fraction were resolubilized in 100 mm NH4HCO3 (pH 8.0). Samples were centrifuged at 50,000g for 10 min to remove insoluble particles. Affinity purification was carried out by incubating the peptides with 20 to 40 μl of agarose beads conjugated with anti-succinyllysine or anti-acetyllysine antibody (PTM Biolabs Inc., Chicago, IL) at room temperature for 4 h with gentle rotation. The beads were washed three times with NETN buffer, twice with ETN buffer (50 mm Tris-Cl, pH 8.0, 100 mm NaCl, 1 mm EDTA), and once with water. Enriched Ksucc peptides were eluted from the beads by three washes with 0.1% trifluoroacetic acid. After Ksucc peptide enrichment, the remnant supernatants were further enriched for Kac peptides using anti-Kac antibody, similar to a recently reported approach (33). The eluted Ksucc and Kac peptides were dried in a SpeedVac prior to nano-HPLC-MS/MS analysis.
Nano-HPLC-MS/MS Analysis
The peptide fractions were desalted using OMIX C18 tips (Agilent Technologies, Santa Clara, CA) and dissolved in solvent A (0.1% formic acid in water). Samples were then injected onto a manually packed reversed-phase C12 column (100 mm × 75 μm, 4-μm particle size, Phenomenex, St. Torrance, CA) connected to an Eksigent NanoLC-1D plus HPLC system (AB SCIEX, Framingham, MA). Peptides were eluted from 5% to 80% solvent B (0.1% formic acid in acetonitrile) in solvent A with a 2-h gradient at a flow rate of 200 nl/min. The analytes were directly ionized and sprayed into an LTQ Orbitrap Velos mass spectrometer by a nanospray ion source. The mass spectrometric analysis was carried out in a data-dependent mode with an automatic switch between a full MS scan using Fourier transform MS in the Orbitrap and an MS/MS scan using collision-induced dissociation in the dual linear ion trap. Full MS spectra with an m/z range of 350 to 1500 were acquired with a resolution of 60,000 at m/z = 400 in profile mode. Lockmass at m/z 445.120024 was enabled for full MS analysis. The 20 most intense ions in each full MS spectrum were sequentially isolated for MS/MS fragmentation with a normalized collision energy of 35%. Ions with either a single charge or more than four charges were excluded from MS/MS fragmentation. The dynamic exclusion duration was set as 36 s with a repeat count of 2, and the exclusion window was set as 0.01% of the reference mass.
SILAC-based Data Processing and Analysis
The acquired MS raw data were processed with MaxQuant software (version 1.0.13.13) (34) and Mascot software (version 2.1) (35). Peaklist generation, precursor mass recalibration, SILAC pair extraction, and SILAC ratio calculation were generated by MaxQuant software. Trypsin was specified as the cleavage enzyme, and the maximum number of missed cleavages was set at 2. Methionine oxidation and protein N-terminal acetylation were specified as variable modifications, and cysteine alkylation by iodoacetamide was specified as a fixed modification for all database searching. Three sets of data analysis were performed: (1) SILAC was selected as “doublets” and 13C615N2-Lys, 13C615N4-Arg, and lysine succinylation (or acetylation) were specified as variable modifications to obtain the quantifiable lysine succinylation (or acetylation) site information (SILAC pair search); (2) SILAC was selected as “singlets” with 13C615N4-Arg specified as a fixed modification and 13C615N2-Lys and 13C615N2-Lys succinylation (or acetylation) specified as variable modifications to identify lysine succinylation (or acetylation) sites from cells grown in heavy media (heavy-only search); and (3) SILAC was selected as “singlets” with lysine succinylation (or acetylation) specified as a variable modification to identify lysine succinylation (or acetylation) sites from cells grown in light media (light-only search). Database searching was performed using Mascot against the NCBI RefSeq E. coli str. K-12 substr. DH10B protein sequence database concatenated with a reversed decoy database (4,128 sequences in the forward database, including common contaminants) with an initial precursor mass tolerance of 7 ppm and fragment mass deviation of 0.5 Da. All three sets of Mascot search results were further processed by MaxQuant. False discovery rate thresholds for protein, peptide, and modification site were fixed at 0.01. MaxQuant software assembled peptide/protein groups and calculated false discovery rates and SILAC quantification ratios. The identified peptides with Mascot ion scores below 20 or C-terminal peptide modifications were removed prior to bioinformatics analysis. Identified peptides were selectively verified by manual inspection using criteria as previously reported (36) to ensure the highest possible stringency of the mass spectrometry data analysis.
Motif Analysis for Lysine Succinylation and Lysine Acetylation Substrates
All identified Ksucc (or Kac) substrates in E. coli were used to analyze the flanking sequences at sites of lysine succinylation (or acetylation) with iceLogo software (version 1.2) (37). Six neighboring amino acid residues on each side of a modification site were selected as the positive set. The embedded Swiss-Prot “Escherichia coli (strain K12)” was used as the negative set.
Functional Enrichment Analysis
DAVID (38) was used for functional enrichment analysis of all Ksucc proteins for Gene Ontology (GO) biological process, molecular function (39), Kyoto Encyclopedia of Genes and Genomes (KEGG) metabolic pathways (40), and Pfam functional domains (41). The total E. coli genome information was used as the background. The GO ALL database from DAVID was selected in this analysis. A Benjamini (adjusted p value) cutoff of 0.05 was used to control the family-wide false discovery rate.
Protein–Protein Interaction Network Analysis
The STRING database (version 9.05) was used for enrichment analysis of E. coli Ksucc protein–protein interaction networks (42). Only high-confidence interactions (score > 7) between the succinylated proteins and high-confidence interactions (with score > 0.7) in the STRING database were fetched for the analysis. The MCODE plug-in toolkit was used to identify highly connected clusters, and the interaction network was visualized by Cytoscape software (version 3.0.1) (43).
HPLC Assay and Kinetics for CobB
The activity of CobB was determined with HPLC by quantifying the modified and unmodified amounts of histone H3 K9 peptide. The reaction mixture contained 20 mm Tris (pH 8.0), 100 mm NaCl, 1 mm DTT, 50 μm histone H3 K9 acetylated or succinylated peptide (19), 1 mm NAD+, and 0.5 μm CobB and was incubated at 37 °C for 1 h. The reaction was quenched with 1 volume of 10% (v/v) trifloroacetic acid and spun for 10 min at 18,000g (Beckman Coulter Microfuge) to separate the enzyme from the reaction. The supernatant was then analyzed via HPLC. To determine the kcat and Km values, HPLC was used to quantify the amount of product formed with various concentrations of the acetylated or succinylated H3 K9. The peptide concentrations used for H3 K9 acetyl peptide were 5, 8, 10, 12, 16, 32, 40, 67, and 268 μm, and for H3 K9 succinyl the concentrations were 2, 3, 4, 6, 8, 12, 16, 24, 32, and 128 μm, with an incubation time of 1 min (acetyl) or 2 min (succinyl) for wild-type CobB and 3 min for deacetylation of the mutated versions. The quenched reactions were then analyzed via HPLC using a reversed-phase analytical column (Kinetex XB-C18, 100 Å, 75 × 4.60 mm, 2.6 μm, Phenomenex) with a 0%–70% B gradient over 20 min at 0.5 ml/min. The product peak and the substrate peaks were both quantified and converted to initial rates, which were then plotted against the modified peptide concentration and fitted using the Kaleidagraph program.
Cloning, Expression, and Purification of Wild-type CobB and CobB Variants
The wild-type CobB gene was PCR-amplified from E. coli BL21 (DE3) and cloned into the pET-28a(+) vector using the BamHI and XhoI restriction sites. The CobB expression vector was then introduced into E. coli BL21 cells that also contained pRARE2 to increase expression of rare tRNAs. Successful transformants were selected by plating the cells on LB plates containing kanamycin (50 μg/ml) and chloramphenicol (20 μg/ml). Single colonies were selected and grown in LB with kanamycin (50 μg/ml) and chloramphenicol (20 μg/ml) overnight at 37 °C. The next day the cells were subcultured (1:1,000 dilution, v/v) into 2 l of LB with kanamycin (50 μg/ml) and chloramphenicol (20 μg/ml). The cells were induced with 500 μm isopropyl-β-d-1-thiogalactopyranoside at an A600 of 0.6 and grown overnight at 15 °C. The cells were harvested via centrifugation at 7,330g for 10 min at 4 °C (Beckman Coulter Refrigerated Floor Centrifuge) and passed through an EmulsiFlex-C3 cell disruptor (AVESTIN, Inc., Ottawa, Ontario, Canada) three times. Cellular debris was removed by centrifuging at 29,300g for 30 min at 4 °C (Beckman Coulter). CobB protein was then purified using gravity-flow Ni-affinity chromatography (Sigma) and dialyzed into a buffer containing 25 mm Tris pH 8.0, 150 mm NaCl, 1 mm DTT, and 10% (v/v) glycerol. The proteins were then aliquoted and kept frozen at −80 °C. The active site and catalytic variants of CobB, Y92F and R95M, were made via PCR site-directed mutagenesis and were expressed and purified in the same way as wild-type CobB.
Western Blotting Analysis of Kac and Ksucc in Wild-type CobB and CobB Knockout E. coli
Overnight LB cultures of wild-type and CobB knockout E. coli (AT713) cells were used to separately inoculate M9 medium supplemented with each amino acid at 0.1 mg/l, with or without different carbon sources (starting A600 < 0.1). The cells were grown at 37 °C for 16 h with continuous shaking (A600 = 1.0 to 1.8), and then cells were harvested and lysed for Western blotting analysis.
RESULTS
Quantitative Analysis of Lysine Succinylome in E. coli
Our previous study demonstrated the existence of Ksucc in both eukaryotic and bacterial cells and that Ksucc is dynamic in E. coli under diverse stress and energy conditions (27). To evaluate the dynamics of Ksucc in E. coli, we grew E. coli cells by supplementing three key metabolic intermediates in bacterial energy metabolism: glucose, pyruvate, and succinate. We performed Western blotting analysis of protein lysates of E. coli grown in minimal M9 medium, either without an additional carbon source or treated with pyruvate, succinate, or glucose (Fig. 1). Interestingly, these metabolic intermediates stimulated significant increases in lysine succinylation. Although the mechanism by which the metabolic intermediates modulate lysine succinylation remains unknown, our data suggest a possible link between the compounds and the lysine succinylation pathway in E. coli. Because glucose is the key energy source for E. coli, we selected low and high glucose as two experimental conditions for subsequent experiments.
Fig. 1.
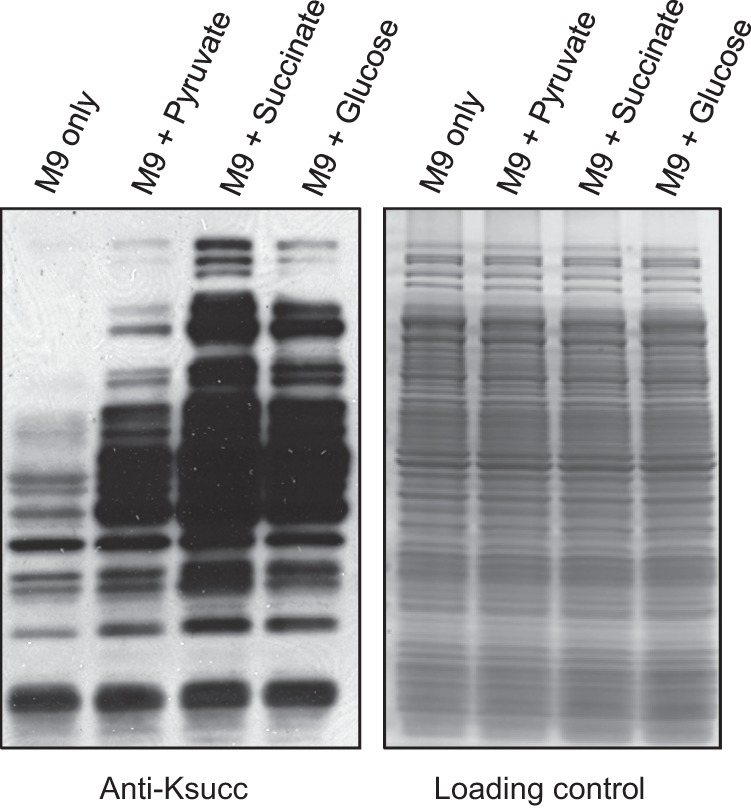
The dynamics of E. coli lysine succinylation in response to different carbon sources. Cells were grown in M9 minimal media or M9 media supplemented with 0.8% pyruvate, 0.8% succinate, or 0.8% glucose. Left: protein lysates were prepared and blotted with a pan-anti-Ksucc antibody. Right: SDS-PAGE gel stained with Colloidal Blue as the loading control.
The identification of lysine succinylation substrates is a critical step toward molecular characterization of this pathway. To this end, we carried out quantitative proteomic analysis of lysine succinylation substrates under different glucose concentrations involving SILAC, affinity enrichment of succinyllysine peptides, and HPLC-MS/MS analysis (Fig. 2A). E. coli cells were grown in heavy medium (heavy lysine (13C615N2 Lys) and heavy arginine (13C615N4 Arg)) supplemented with 0.8% glucose or in light medium (lysine (12C614N2) and arginine (12C614N4 Arg)) without additional glucose. After labeling, protein lysates from each group of cells were mixed at a 1:1 ratio (w/w), fractionated using ion exchange chromatography, and then tryptically digested. Affinity enrichment of Ksucc peptides was performed using agarose beads conjugated with a pan-anti-succinyllysine antibody. The enriched peptides were analyzed via nano-HPLC-MS/MS. The acquired mass spectrometric data were processed and analyzed by MaxQuant and Mascot software to identify Ksucc peptides and quantify their relative abundance in the two groups of cells.
Fig. 2.
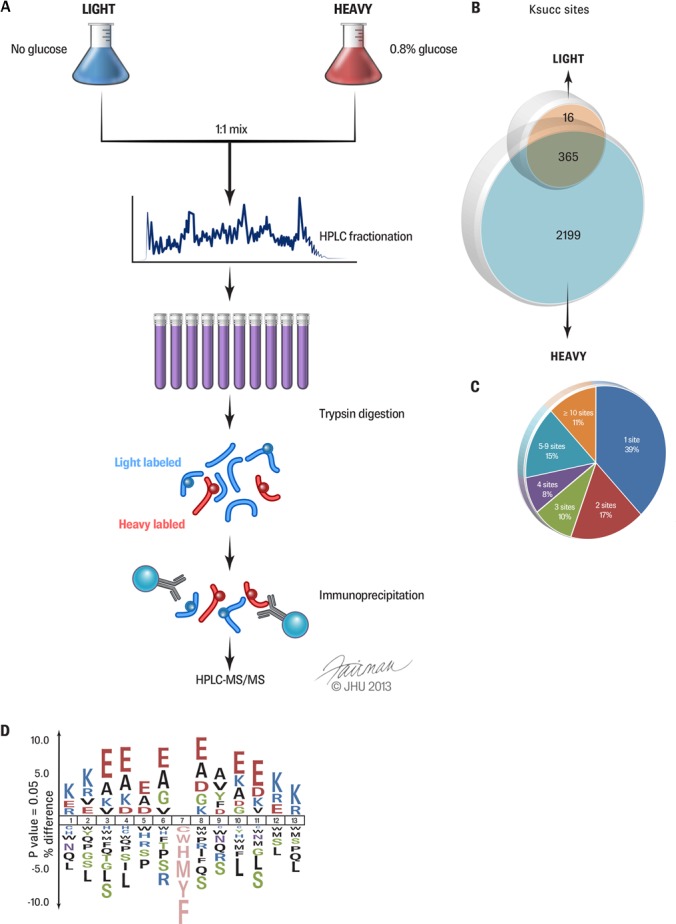
Quantitative proteomics of E. coli lysine succinylation. A, flowchart showing the experimental procedure for the quantitative proteomics study. E. coli cells were grown in M9 minimal medium with no glucose (left) or 0.8% glucose (right). Protein lysates from each group of cells were equally combined, then fractionated into 10 fractions via ion exchange HPLC. Fractions were digested with trypsin and enriched via immunoprecipitation using a pan-anti-Ksucc antibody. The isolated Ksucc peptides were analyzed via nano-HPLC-MS/MS. B, Venn diagram showing the total number of heavy-only (∼85%), light-only (∼0.6%), and overlapping (∼14%) lysine succinylation sites. C, pie chart showing the distribution of the total number of lysine-succinylated sites per protein. D, sequence motifs of lysine-succinylated sites generated by iceLogo software.
We used a 1% false recovery rate as the cutoff criterion for peptide and protein identification. In addition, we removed peptides with a Mascot ion score below 20 to ensure high-quality peptide identification. Using these criteria, we identified 2,580 lysine-succinylated sites in 670 proteins in E. coli (supplemental Tables S1A–S1C). In the Ksucc enriched samples, we identified 1,510 unique unmodified peptides. The percentage of the Ksucc peptides in the Ksucc immunoprecipitation sample was 63.1% (2,580 Ksucc peptides versus 1,510 unmodified peptides), indicating the high efficiency of our enrichment approach and high quality of the anti-Ksucc antibody. Our early study on small-scale analysis of Ksucc substrates identified 14 Ksucc proteins in E. coli (27). Those substrates were all identified here, providing a good positive control.
Of all the Ksucc sites, 365 were present in cells grown in both samples (Fig. 2B). Interestingly, 2,199 Ksucc sites were detected only in heavy-labeled cells grown in high-glucose medium. The heavy-only Ksucc peptides accounted for 85% of the succinylome (2,199 of 2,580 sites), which represents a clear dynamic difference between the two growth conditions.
Of the 670 Ksucc protein substrates, 39% were succinylated at only one site, whereas 11% were modified at 10 or more sites (Fig. 2C). The most heavily succinylated proteins included molecular chaperone DnaK (28 sites), elongation factor G (28 sites), pyruvate formatelyase I (24 sites), 30S ribosomal protein S1 (21 sites), and phosphoglycerate kinase (21 sites).
To evaluate the potential substrate motifs of Ksucc sites, we analyzed the flanking sequences of Ksucc sites in E. coli (Fig. 2D) using the iceLogo algorithm. This analysis showed that glutamate residues were overrepresented in the region surrounding Ksucc sites, whereas serine (Ser) residues were underrepresented. In addition to glutamate residues, alanine residue was also overrepresented in the −4 to +3 positions around Ksucc sites.
Dynamics of the Succinylome in Response to Glucose
Of all the Ksucc sites that overlapped between growth conditions, 324 (∼12% of all Ksucc sites) could be quantified by MaxQuant software (supplemental Table S1D). We examined the change of the quantifiable Ksucc sites in high-glucose medium (heavy) relative to no-glucose medium (light). The average SILAC heavy/light (H/L) ratio of the quantifiable Ksucc sites was 15.60, and the median SILAC H/L ratio was 12.04. Of the 324 quantifiable Ksucc sites, the abundance of 293 (∼90%) was increased at least 4-fold in response to high glucose (Figs. 3A and 3B). This result suggested that Ksucc was significantly enhanced by glucose. Given the fact that 85% of the succinylome (2,199 of 2,580 sites) is present only in cells grown in high glucose, the general increase in lysine succinylation is more significant than the results of the quantifiable Ksucc sites.
Fig. 3.
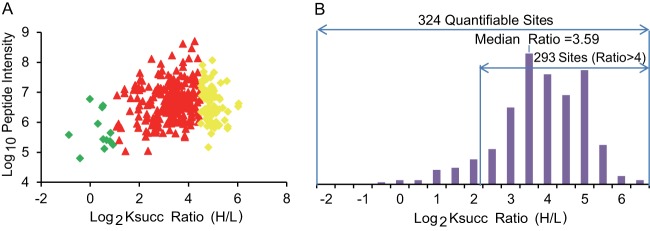
Distribution of the SILAC ratio (H/L) of lysine-succinylated peptides. A, scatter plot showing the peptide intensities (i.e. the summed precursor-ion intensities of each peptide, derived from MaxQuant software) of the quantifiable lysine-succinylated peptides in relation to their dynamic changes in response to high glucose. Ksucc ratio (H/L): MS signal intensity from high-glucose medium (heavy) divided by that from no-glucose medium (light). Green: −1 ≤ log2 ratio (H/L) ≤ 1; red: 1 ≤ log2 ratio (H/L) ≤ 4.5; yellow: 4.5 ≤ log2 ratio (H/L) ≤ 8. B, histogram showing the distribution of the SILAC ratios of Ksucc sites in high-glucose (heavy) relative to no-glucose (light) medium. The y-axis represents the number of Ksucc peptides in each category.
We next analyzed the range of SILAC ratios for modified peptides resulting from the same protein. The distribution of E. coli proteins identified with more than two quantifiable Ksucc sites is shown in supplemental Fig. S1. The fold change for the Ksucc sites in the same protein ranged from 1.0 to 11.4, suggesting that the succinylation level of different sites in the same protein varies from protein to protein.
We modified a previously reported algorithm (44) to estimate the absolute stoichiometry of lysine succinylation sites in the heavy and light cells. The calculation was based on the SILAC ratios of the Ksucc sites and MS intensity data for the corresponding unmodified peptide and protein (for details, see the supplemental Materials and Methods section on the estimation of the absolute stoichiometry of lysine succinylation and acetylation sites). Following these criteria, we were able to calculate absolute stoichiometries of three Ksucc sites in no-glucose and high-glucose conditions: K188 of the α subunit of the F1 sector of membrane-bound ATP synthase, K162 of pyruvate formatelyase I, and K45 of 30S ribosomal subunit protein S2 (supplemental Table S1E). In the no-glucose condition, the stoichiometries of these three Ksucc sites were 0.14%, 0.41%, and 1.00%, respectively. In the high-glucose condition, the stoichiometries of these three Ksucc sites increased to 2.58%, 10.20%, and 33.55%, respectively.
Functional Annotation Analysis of the Lysine Succinylome
To understand the possible roles of the lysine succinylation pathway, we performed enrichment analysis using the KEGG (33), GO (39), and Pfam databases (41). In the KEGG metabolic pathway analysis, the top three enriched categories for lysine-succinylated substrates were ribosome, purine metabolism, and aminoacyl-tRNA biosynthesis (Fig. 4A, supplemental Table S2). Illustrations of the top 10 enriched metabolic pathways are shown in supplemental Figs. S2A–S2J.
Fig. 4.

Functional annotation of lysine succinylome. A, KEGG pathway analysis for lysine-succinylated proteins. B, representative GO annotations of Ksucc sites for biological process (top panel), molecular function (middle panel), and Pfam domain (bottom panel).
Our GO analysis (supplemental Tables S3A–S3C) showed that Ksucc substrates are mostly enriched in protein expression metabolism, with specific enrichment in translation (adj p = 1.94 × 10−69), cellular amino acid metabolism (adj p = 2.94 × 10⁻³²), and gene expression (adj p = 2.26 × 10⁻²²) (Fig. 4B, upper panel). The molecular functions of lysine succinylation substrates include structural constituents of ribosome (adj p = 1.56 × 10−56) and tRNA binding (adj p = 2.06 × 10⁻¹⁰) (Fig. 4B, middle panel). Interestingly, Pfam domain analysis revealed that lysine-succinylated substrates were enriched with the GTP-EFTU domain, which binds and delivers an aminoacyl-tRNA to the A site of the ribosome (45) (supplemental Table S4). Therefore, KEGG pathway, GO annotation, and Pfam domain analyses suggested that lysine succinylation substrates are associated with the ribosome and protein expression/translation events.
Protein Interaction Networks of Lysine Succinylation Substrates in E. coli
Protein–protein interactions are critical to the function and regulation of cellular physiology. PTMs may mediate protein–protein interactions by providing a docking site to recruit binding partners, which are often proteins containing a specific PTM-binding domain. For example, proteins containing an SH2 domain can bind phosphotyrosine residues, whereas bromodomain-containing proteins bind acetyllysine (46). Using the STRING database (42), we evaluated protein interaction networks within lysine-succinylated substrates using the MCODE plugin tool in Cytoscape (43) and identified 14 highly interconnected networks in E. coli (supplemental Table S5). The complete interaction network is illustrated in supplemental Fig. S3. Fig. 5 shows the top seven enriched interaction clusters from this study (Figs. 5A–5G). Interestingly, the top cluster we identified (cluster 1) consisted of ribosome-associated proteins (Fig. 5A). This analysis is aligned with our KEGG pathway and functional annotation analyses in that they all show enrichment of Ksucc sites among ribosomal proteins.
Fig. 5.

The top seven clusters of highly interconnected lysine-succinylated protein networks. Interaction network of lysine-succinylated proteins (listed in gene names) were analyzed using the MCODE plug-in toolkit in the Cytoscape software (version 3.0.1). The lysine-succinylated proteins in the top seven clusters are shown in red, light blue, green, pink, blue, yellow, and purple, respectively. Proteins without a succinylation site are indicated in light green in each cluster. A, cluster 1: MCODE score = 32.197, nodes = 71, edges = 2,286. B, cluster 2: MCODE score = 3.235, nodes = 17, edges = 55. C, cluster 3: MCODE score = 3, nodes = 8, edges = 24. D, cluster 4: MCODE score = 2.75, nodes = 8, edges = 22. E, cluster 5: MCODE score = 2.722, nodes = 18, edges = 49. F, cluster 6: MCODE score = 2.571, nodes = 14, edges = 36. G, cluster 7: MCODE score = 1.75, nodes = 8, edges = 14. The detailed cluster information is listed in supplemental Table S5.
E. coli CobB Catalyzes Deacetylation and Desuccinylation with Similar Efficiency
HDACs are a group of enzymes that catalyze the removal of the acetyl group from acetyllysine residues (16). This group of enzymes was classified based on protein sequence homology (17). Recently, it was demonstrated that a human sirtuin protein, Sirt5, which is classified as an HDAC but has only weak deacetylase activity, is an efficient NAD+-dependent protein lysine desuccinylase and demalonylase (18, 19). E. coli has one sirtuin protein called CobB, which is able to deacetylate acetyl-CoA synthetase (8). According to Frye's bioinformatics analysis (17), human Sirt5 and E. coli CobB are both Class III sirtuins. Furthermore, sequence alignment showed that Tyr102 and Arg105 in Sirt5, which are important for Sirt5's desuccinylase activity, are conserved in CobB (Tyr92 and Arg95). Thus, it is highly possible that CobB could also have desuccinylase activity.
To test this possibility, we expressed and purified CobB. An HPLC assay showed that CobB could deacetylate and desuccinylate a histone H3 K9 peptide with similar efficiency (Fig. 6A). Kinetics measurements (Fig. 6B) confirmed that the deacetylase activity (kcat = 0.14 ± 0.01 s−1, Km = 15 ± 1 μm, kcat/Km = 8.9 × 10³ s−1 μm−1) was similar to the desuccinylase activity (kcat = 0.24 ± 0.04 s−1, Km = 86 ± 30 μm, kcat/Km = 2.8 × 10³ s−1 μm−1). Furthermore, when we mutated either Tyr92 to Phe (Y92F) or Arg95 to Met (R95M), the desuccinylase activity decreased about 42- or 100-fold, respectively. In contrast, each mutation decreased the deacetylase activity by only about 3-fold (Fig. 6B). These results suggest that Tyr92 and Arg105 are important for the desuccinylase activity of CobB but are dispensable for its deacetylase activity. Our data suggest that CobB is a multifunctional sirtuin that can remove both acetyl and negatively charged succinyl groups.
Fig. 6.

Identification of lysine desuccinylation enzyme CobB. A, HPLC analysis of CobB hydrolysis of lysine-acetylated (top two traces) and lysine-succinylated (bottom two traces) peptides. B, deacetylation and desuccinylation kinetic parameters (kcat, Km, kcat/Km) of wild-type (WT) and mutated CobB (Y92F and R95M). ND means “not determined” due to a lack of enzyme saturation with the highest substrate concentration used. C, Western blotting analysis of lysine acetylation and succinylation levels in protein lysates from CobB WT and CobB knockout (KO) E. coli cells. Left: Western blotting analysis with a pan-anti-acetyllysine antibody. Ponceau staining was used for the loading controls. Right: WT and CobB KO cells were cultured in the presence or absence of 40 mm acetate or 40 mm succinate. Cell lysates were blotted with a pan-anti-succinyllysine antibody. Ponceau staining was used for the loading controls.
To test the in vivo desuccinylase activity of CobB, we cultured wild-type CobB and CobB knockout (KO) E. coli cells. We blotted whole cell lysates with pan-antibodies against acetyllysine or succinyllysine (Fig. 6C). CobB KO cells showed slightly increased acetylation levels relative to the wild type (Fig. 6C, left). The succinylation level of CobB KO cells was also elevated relative to that of the wild-type cells under normal conditions (Fig. 6C, right, first two rows). In support of this observation, the lysine succinylation level also increased in CobB KO cells relative to wild-type cells when the cells were treated with 40 mm succinate (Fig. 6C, right, last two rows).
Dynamics of the E. coli Acetylome in Response to Glucose
In addition to lysine succinylation, lysine acetylation is known to be modulated by glucose (31). To analyze the dynamic changes of the lysine acetylome in response to high glucose, we performed quantitative proteomics analysis using the same experimental conditions described above for our lysine succinylation analysis, except that a pan-acetyllysine antibody was used for affinity enrichment of Kac peptides.
Our proteomic screening detected 2,803 Kac sites in 782 proteins, among which 1,778 Kac sites (∼63.4% of the total) were detected only in heavy (high-glucose) cells and 931 sites (∼33.5% of the total) were detected in both groups (Fig. 7A, supplemental Tables S6A–S6C). Similar to the Ksucc enrichment approach, the percentage of the Kac peptides in Kac enriched samples was 67.0% (2,803 Kac peptides versus 1,384 unmodified peptides), suggesting the antibody was of high quality. Of the Kac and Ksucc sites detected, 1,520 (39%) were overlapping and were seen to be modified by both modifications (Fig. 7B). The total number of acetyllysine sites per protein (supplemental Fig. S4A) had a distribution similar to that of succinyllysine sites (Fig. 2C).
Fig. 7.
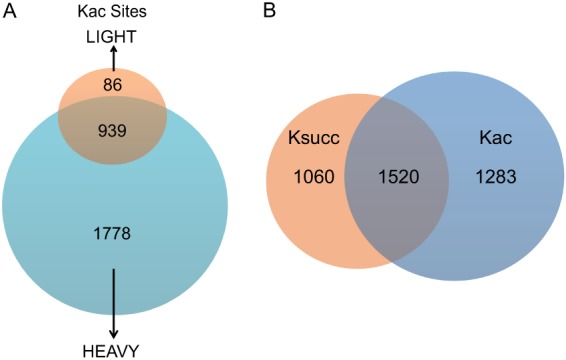
Quantitative analysis of E. coli acetylome. A, Venn diagram showing the total number of heavy-only (63.4%), light-only (3.1%), and overlapping (33.5%) lysine acetylation sites. B, Venn diagram showing the number of Ksucc-only, Kac-only, and overlapping sites between the two modifications.
To compare the sequence motifs of Kac and Ksucc modification sites, we analyzed the flanking sequences of lysine-acetylated sites in E .coli (supplemental Fig. S4B). Among the Kac sites, glutamate was overrepresented and serine was underrepresented at almost all of the five positions on either side of the modification site. These data suggest that both Ksucc sites and Kac sites are heavily surrounded by glutamate residues in E. coli. This analysis also showed that leucine was overrepresented at positions −2, +1, and +2 in Kac peptides (supplemental Fig. S4B), in contrast to the overrepresentation of alanine resides in Ksucc peptides at these positions (Fig. 2D).
Of the Kac sites observed in both light and heavy media, 823 could be quantified by MaxQuant (supplemental Figs. S5A and S5B and supplemental Table S6D). We analyzed the quantitative changes in the lysine acetylation proteome between no-glucose and high-glucose media. Among the quantified Kac sites, the average SILAC H/L ratio was 3.73, and the median SILAC H/L ratio was 2.69. At 283 sites (34% of the quantifiable sites), the abundance of Kac increased at least 4-fold in response to high glucose (supplemental Figs. S5A and S5B).
The SILAC data for both protein expression and Kac peptides enabled us to calculate the absolute stoichiometries of 32 Kac sites in the no-glucose and high-glucose media (supplemental Table S6E). The stoichiometries ranged from 0.2% to 74%. In no-glucose medium, 14 of 32 Kac sites had a stoichiometry of greater than 10%, with an average stoichiometry of 19%. These numbers increased to 21 sites with an average stoichiometry of 28% in high-glucose medium.
A Comparison between Succinylome and Acetylome
To gain insight into the dynamics of Ksucc and Kac in response to glucose, we determined the ratio distribution of quantified Ksucc and Kac sites. We plotted corresponding site counts by calculating the log2 SILAC H/L ratio of Ksucc and Kac sites (Fig. 8A). These data showed that glucose stimulated more significant changes at lysine succinylation sites (red) than at lysine acetylation sites (blue). To normalize the changes in protein expression between the light and heavy samples, we carried out HPLC-MS/MS analysis of the 10 HPLC fractionation digests (supplemental Table S7). The SILAC ratio distributions of identified proteins are shown in supplemental Fig. S7, with a median H/L ratio of 0.081. Compared with Fig. 8A, the results were similar (Fig. 8B) after normalization of the expression levels of the corresponding proteins.
Fig. 8.

A comparison between the lysine succinylome and the lysine acetylome. A, histogram showing the SILAC ratio (log2 (H/L)) distributions of Ksucc (red) and Kac (blue) sites. The y-axis represents the total number of modified peptides for each category. B, histogram showing the SILAC ratio (log2 (H/L)) distributions of normalized Ksucc (orange) and normalized Kac (purple) peptides. C, scatter plot showing normalized (H/L) SILAC ratio of Kac in relation to Ksucc. Red color: 0.5 < Ksucc/Kac ratio < 2; blue color: Ksucc/Kac ratio ≥ 2.
These results suggest that the glucose concentration in the culture medium for E. coli has a more profound effect on lysine succinylation than on lysine acetylation. To further investigate the influence of high glucose on the two PTMs, we compared the SILAC ratios of normalized Kac (H/L) versus normalized Ksucc (H/L) of the same PTM sites. Out of the total of 156 sites that could be quantified in both Ksucc and Kac experiments (supplemental Table S8), 121 had an increase of Ksucc over Kac of at least 2-fold, whereas no peptides showed a 2-fold decrease of Ksucc relative to Kac (Fig. 8C and supplemental Fig. S6). The average ratio of Ksucc (H/L)/Kac (H/L) was 5.92, and the median ratio was 3.76. This result again suggests that high-glucose conditions had a more profound effect on lysine succinylation than on lysine acetylation.
DISCUSSION
In this paper, we report the first global analysis of the lysine succinylome in E. coli. We quantified dynamic changes of the Ksucc and Kac proteomes in response to high glucose. Our proteomics data led to three interesting observations. First, we detected 2,580 Ksucc and 2,803 Kac sites, representing the most comprehensive Ksucc proteome in wild-type bacteria as of writing this work. Among the detected Ksucc sites, 41% were unique to lysine succinylation and did not overlap with Kac sites (Fig. 7B). Second, our data suggest that lysine succinylation undergoes more dynamic changes than lysine acetylation in response to glucose. Finally, the high abundance of lysine succinylation substrates among bacterial proteins indicates that prokaryotic PTMs, although not yet carefully studied, could be an important mechanism for regulating physiological changes.
Among the protein substrates bearing both Ksucc and Kac sites, 121 had a Ksucc (H/L)/Kac (H/L) ratio (the ratio of quantitative changes of Ksucc to those of Kac, for the same peptide sequence, in response to glucose) greater than 2 (supplemental Fig. S6 and supplemental Table S8) (45). There are several possible reasons for the occurrence of both Kac and Ksucc modifications at the same site. One possibility is that succinylation and acetylation at the same site will have different biological functions, similar to histone modifications in eukaryotes (47). Another possibility is that, similar to the well-documented interplay between O-GlcNAcylation and phosphorylation that is critical for various cellular functions (48), there is competition between Ksucc and Kac at the same lysine residue for fine-tuning the substrate's activity. In addition, Ksucc will induce a more significant chemical and structural change (from +1 charge to −1 charge at the lysine residue) for the protein than Kac. In turn, Ksucc could have a more profound effect on the protein's function. As an example, one interesting site on 50S ribosomal subunit protein L6 can be modified by both Ksucc and Kac (supplemental Table S8). The Ksucc site (KsuccLQLVGVGYR) of 50S subunit protein L6 is heavily succinylated under high-glucose conditions, with a SILAC Ksucc (H/L) ratio of 25.69. However, the SILAC Kac (H/L) ratio for the same site is only 0.85. The Ksucc (H/L)/Kac (H/L) ratio of this site is 30.36. Thus, although the peptide is both acetylated and succinylated, succinylation is likely to have a more significant effect on its structure and function. Quantification of both acetylation and succinylation can, in some cases, reveal which one is dynamic and therefore more likely have a regulatory role. Such information is important in guiding the design of subsequent experiments to dissect the functional consequences of the two modifications in the same substrate protein. 50S ribosomal protein L6 binds to a part of the 23S rRNA called domain VI, which contains the binding site for the EF-Tu-GTP-aminoacyl tRNA ternary complex (49). Therefore, increased lysine succinylation of 50S ribosomal protein L6 may be important for regulating protein translation under high-glucose conditions.
In addition to our findings in 50S ribosomal protein L6, we also observed that Ksucc is relatively common among ribosomal and translation-associated proteins. Our analysis using the KEGG database revealed the top 10 metabolic pathways that are enriched with succinylated proteins (Ssupplemental Fig. S2). In addition to translation, lysine succinylated proteins are highly enriched in purine/pyrimidine metabolism, glycolysis/gluconeogenesis, pyruvate metabolism, the tricarboxylic acid cycle, and fatty acid synthesis. Our previous mutagenesis experiment and sequence alignment analysis of isocitrate dehydrogenase, an important enzyme participating in the tricarboxylic acid cycle, suggested that lysine succinylation is likely to affect its enzymatic activity (27). Accordingly, these results suggested that protein translation and energy metabolism are the two global biological processes that lysine succinylation may play a critical role in.
Sirt5, the mammalian desuccinylase, has low deacetylation activity relative to its desuccinylation activity (18, 19). In contrast, the bacterial enzyme CobB showed comparable lysine deacetylation and lysine desuccinylation activities. According to the kinetic parameters of CobB and two mutated versions of CobB (Y92F, R95M), the enzyme is a faster desuccinylase (kcat = 0.242 ± 0.04 s−1) than deacetylase (kcat = 0.135 ± 0.007 s−1). However, desuccinylation (Km = 86 ± 11 mm) requires a higher substrate concentration than deacetylation (Km = 15.1 ± 0.5 mm). Therefore, kcat/Km (catalytic efficiency) for desuccinylation is lower (2.8 × 10³ s−1 μm−1) than kcat/Km for deacetylation (8.9 × 10³ s−1 μm−1). These data support the Western blot data showing that both Kac and Ksucc were increased in CobB KO E. coli cells, suggesting that CobB can catalyze both deacetylation and desuccinylation in a similar way (Fig. 6C), whereas the desuccinylation activity of CobB might be induced when cells are treated with succinate.
When seeking to understand a new protein modification pathway, the identification of protein substrates and regulatory enzymes controlling the modification is the major initial step. Although this study has identified major substrates of Lys succinylation and the first known desuccinylase, CobB, in bacteria, it remains unknown whether additional desuccinylases exist in prokaryotes. In addition to deacetylases, acetyltransferases, such as the enzyme Pat (50), have been identified in bacteria. It would be interesting to determine whether Pat has succinylation activity in addition to acetylation activity. Although the metabolic regulation of lysine acetylation has been studied for some time, the biological significance of lysine succinylation remains to be characterized. Lysine succinylation datasets from this study, as well as data from mammalian cells (28), provide a foundation for studying the biological functions of this modification.
Supplementary Material
Acknowledgments
We thank Dr. Hao Luo for technical assistance. The authors acknowledge that during the course of this paper's revision, a proteomic study to profile lysine succinylation substrates in E coli, S. cerevisiae, HeLa, and mouse liver cells was published by Choudhary and colleagues (51).
Footnotes
* This work is supported by the National Institutes of Health (GM103250, CA160036, GM098596, and T32GM08500), National Science and Technology Major Project of the Ministry of Science and Technology of China (No. 2012ZX09301001–007), Natural Science Foundation of China (Grant No. 31370814), and Shanghai Pujiang Program (Grant No. 13PJ1410300).
 This article contains supplemental material.
1 The abbreviations used are:
- Kac
- lysine acetylation
- GO
- gene ontology
- HDAC
- histone deacetylase
- H/L
- heavy/light
- HPLC
- high-performance liquid chromatography
- KEGG
- Kyoto Encyclopedia of Genes and Genomes
- KO
- knockout
- Ksucc
- lysine succinylation
- MS
- mass spectrometry
- PTM
- post-translational modification
- SILAC
- stable isotope labeling by amino acids in cell culture
- Sirt
- sirtuin.
REFERENCES
- 1. Yang X. J., Seto E. (2007) HATs and HDACs: from structure, function and regulation to novel strategies for therapy and prevention. Oncogene 26, 5310–5318 [DOI] [PubMed] [Google Scholar]
- 2. Finkel T., Deng C. X., Mostoslavsky R. (2009) Recent progress in the biology and physiology of sirtuins. Nature 460, 587–591 [DOI] [PMC free article] [PubMed] [Google Scholar]
- 3. Finley L. W., Carracedo A., Lee J., Souza A., Egia A., Zhang J., Teruya-Feldstein J., Moreira P. I., Cardoso S. M., Clish C. B., Pandolfi P. P., Haigis M. C. (2011) SIRT3 opposes reprogramming of cancer cell metabolism through HIF1alpha destabilization. Cancer Cell 19, 416–428 [DOI] [PMC free article] [PubMed] [Google Scholar]
- 4. Smith B. C., Settles B., Hallows W. C., Craven M. W., Denu J. M. (2011) SIRT3 substrate specificity determined by peptide arrays and machine learning. ACS Chem. Biol. 6, 146–157 [DOI] [PMC free article] [PubMed] [Google Scholar]
- 5. Hebert A. S., Dittenhafer-Reed K. E., Yu W., Bailey D. J., Selen E. S., Boersma M. D., Carson J. J., Tonelli M., Balloon A. J., Higbee A. J., Westphall M. S., Pagliarini D. J., Prolla T. A., Assadi-Porter F., Roy S., Denu J. M., Coon J. J. (2013) Calorie restriction and SIRT3 trigger global reprogramming of the mitochondrial protein acetylome. Mol. Cell. 49, 186–199 [DOI] [PMC free article] [PubMed] [Google Scholar]
- 6. Hirschey M. D., Shimazu T., Huang J. Y., Schwer B., Verdin E. (2011) SIRT3 regulates mitochondrial protein acetylation and intermediary metabolism. Cold Spring Harb. Symp. Quant. Biol. 76, 267–277 [DOI] [PubMed] [Google Scholar]
- 7. Lombard D. B., Tishkoff D. X., Zwaans B. M. (2012) Mitochondrial regulation by protein acetylation. In Mitochondrial Signaling in Health and Disease (Cadenas E., Orrenius S., Packer L., eds.), pp. 269–298, Taylor and Francis, London [Google Scholar]
- 8. Starai V. J., Celic I., Cole R. N., Boeke J. D., Escalante-Semerena J. C. (2002) Sir2-dependent activation of acetyl-CoA synthetase by deacetylation of active lysine. Science 298, 2390–2392 [DOI] [PubMed] [Google Scholar]
- 9. Zhao S., Xu W., Jiang W., Yu W., Lin Y., Zhang T., Yao J., Zhou L., Zeng Y., Li H., Li Y., Shi J., An W., Hancock S. M., He F., Qin L., Chin J., Yang P., Chen X., Lei Q., Xiong Y., Guan K. L. (2010) Regulation of cellular metabolism by protein lysine acetylation. Science 327, 1000–1004 [DOI] [PMC free article] [PubMed] [Google Scholar]
- 10. Shahbazian M. D., Grunstein M. (2007) Functions of site-specific histone acetylation and deacetylation. Annu. Rev. Biochem. 76, 75–100 [DOI] [PubMed] [Google Scholar]
- 11. Roth S. Y., Denu J. M., Allis C. D. (2001) Histone acetyltransferases. Annu. Rev. Biochem. 70, 81–120 [DOI] [PubMed] [Google Scholar]
- 12. Gu W., Roeder R. G. (1997) Activation of p53 sequence-specific DNA binding by acetylation of the p53 C-terminal domain. Cell 90, 595–606 [DOI] [PubMed] [Google Scholar]
- 13. Hubbert C., Guardiola A., Shao R., Kawaguchi Y., Ito A., Nixon A., Yoshida M., Wang X. F., Yao T. P. (2002) HDAC6 is a microtubule-associated deacetylase. Nature 417, 455–458 [DOI] [PubMed] [Google Scholar]
- 14. Smith B. C., Hallows W. C., Denu J. M. (2008) Mechanisms and molecular probes of sirtuins. Chem. Biol. 15, 1002–1013 [DOI] [PMC free article] [PubMed] [Google Scholar]
- 15. Imai S., Guarente L. (2010) Ten years of NAD-dependent SIR2 family deacetylases: implications for metabolic diseases. Trends Pharmacol. Sci. 31, 212–220 [DOI] [PMC free article] [PubMed] [Google Scholar]
- 16. Lee K. K., Workman J. L. (2007) Histone acetyltransferase complexes: one size doesn't fit all. Nat. Rev. Mol. Cell Biol. 8, 284–295 [DOI] [PubMed] [Google Scholar]
- 17. Frye R. A. (2000) Phylogenetic classification of prokaryotic and eukaryotic Sir2-like proteins. Biochem. Biophys. Res. Commun. 273, 793–798 [DOI] [PubMed] [Google Scholar]
- 18. Peng C., Lu Z., Xie Z., Cheng Z., Chen Y., Tan M., Luo H., Zhang Y., He W., Yang K., Zwaans B. M., Tishkoff D., Ho L., Lombard D., He T. C., Dai J., Verdin E., Ye Y., Zhao Y. (2011) The first identification of lysine malonylation substrates and its regulatory enzyme. Mol. Cell. Proteomics 10, M111.012658. [DOI] [PMC free article] [PubMed] [Google Scholar]
- 19. Du J., Zhou Y., Su X., Yu J. J., Khan S., Jiang H., Kim J., Woo J., Kim J. H., Choi B. H., He B., Chen W., Zhang S., Cerione R. A., Auwerx J., Hao Q., Lin H. (2011) Sirt5 is a NAD-dependent protein lysine demalonylase and desuccinylase. Science 334, 806–809 [DOI] [PMC free article] [PubMed] [Google Scholar]
- 20. Cohen T., Yao T. P. (2004) AcK-knowledge reversible acetylation. Sci. STKE 2004, pe42. [DOI] [PubMed] [Google Scholar]
- 21. Cohen H. Y., Lavu S., Bitterman K. J., Hekking B., Imahiyerobo T. A., Miller C., Frye R., Ploegh H., Kessler B. M., Sinclair D. A. (2004) Acetylation of the C terminus of Ku70 by CBP and PCAF controls Bax-mediated apoptosis. Mol. Cell 13, 627–638 [DOI] [PubMed] [Google Scholar]
- 22. Michishita E., Park J. Y., Burneskis J. M., Barrett J. C., Horikawa I. (2005) Evolutionarily conserved and nonconserved cellular localizations and functions of human SIRT proteins. Mol. Biol. Cell 16, 4623–4635 [DOI] [PMC free article] [PubMed] [Google Scholar]
- 23. Kim S. C., Sprung R., Chen Y., Xu Y., Ball H., Pei J., Cheng T., Kho Y., Xiao H., Xiao L., Grishin N. V., White M., Yang X. J., Zhao Y. (2006) Substrate and functional diversity of lysine acetylation revealed by a proteomics survey. Mol. Cell 23, 607–618 [DOI] [PubMed] [Google Scholar]
- 24. Chen Y., Zhao W., Yang J. S., Cheng Z., Luo H., Lu Z., Tan M., Gu W., Zhao Y. (2012) Quantitative acetylome analysis reveals the roles of SIRT1 in regulating diverse substrates and cellular pathways. Mol. Cell. Proteomics 11, 1048–1062 [DOI] [PMC free article] [PubMed] [Google Scholar]
- 25. Choudhary C., Kumar C., Gnad F., Nielsen M. L., Rehman M., Walther T. C., Olsen J. V., Mann M. (2009) Lysine acetylation targets protein complexes and co-regulates major cellular functions. Science 325, 834–840 [DOI] [PubMed] [Google Scholar]
- 26. Zhang K., Zheng S., Yang J. S., Chen Y., Cheng Z. (2013) Comprehensive profiling of protein lysine acetylation in Escherichia coli. J. Proteome Res. 12, 844–851 [DOI] [PubMed] [Google Scholar]
- 27. Zhang Z., Tan M., Xie Z., Dai L., Chen Y., Zhao Y. (2011) Identification of lysine succinylation as a new post-translational modification. Nat. Chem. Biol. 7, 58–63 [DOI] [PMC free article] [PubMed] [Google Scholar]
- 28. Park J., Chen Y., Tishkoff D. X., Peng C., Tan M., Dai L., Xie Z., Zhang Y., Zwaans B. M., Skinner M. E., Lombard D. B., Zhao Y. (2013) SIRT5-mediated lysine desuccinylation impacts diverse metabolic pathways. Mol. Cell 50, 919–930 [DOI] [PMC free article] [PubMed] [Google Scholar]
- 29. Xie Z., Dai J., Dai L., Tan M., Cheng Z., Wu Y., Boeke J. D., Zhao Y. (2012) Lysine succinylation and lysine malonylation in histones. Mol. Cell. Proteomics 11, 100–107 [DOI] [PMC free article] [PubMed] [Google Scholar]
- 30. Zhang J., Sprung R., Pei J., Tan X., Kim S., Zhu H., Liu C. F., Grishin N. V., Zhao Y. (2009) Lysine acetylation is a highly abundant and evolutionarily conserved modification in Escherichia coli. Mol. Cell. Proteomics 8, 215–225 [DOI] [PMC free article] [PubMed] [Google Scholar]
- 31. Wang Q., Zhang Y., Yang C., Xiong H., Lin Y., Yao J., Li H., Xie L., Zhao W., Yao Y., Ning Z. B., Zeng R., Xiong Y., Guan K. L., Zhao S., Zhao G. P. (2010) Acetylation of metabolic enzymes coordinates carbon source utilization and metabolic flux. Science 327, 1004–1007 [DOI] [PMC free article] [PubMed] [Google Scholar]
- 32. Ma Q., Wood T. K. (2011) Protein acetylation in prokaryotes increases stress resistance. Biochem. Biophys. Res. Commun. 410, 846–851 [DOI] [PMC free article] [PubMed] [Google Scholar]
- 33. Mertins P., Qiao J. W., Patel J., Udeshi N. D., Clauser K. R., Mani D. R., Burgess M. W., Gillette M. A., Jaffe J. D., Carr S. A. (2013) Integrated proteomic analysis of post-translational modifications by serial enrichment. Nat. Methods 10, 634–637 [DOI] [PMC free article] [PubMed] [Google Scholar]
- 34. Cox J., Mann M. (2008) MaxQuant enables high peptide identification rates, individualized p.p.b.-range mass accuracies and proteome-wide protein quantification. Nat. Biotechnol. 26, 1367–1372 [DOI] [PubMed] [Google Scholar]
- 35. Perkins D. N., Pappin D. J., Creasy D. M., Cottrell J. S. (1999) Probability-based protein identification by searching sequence databases using mass spectrometry data. Electrophoresis 20, 3551–3567 [DOI] [PubMed] [Google Scholar]
- 36. Chen Y., Kwon S. W., Kim S. C., Zhao Y. (2005) Integrated approach for manual evaluation of peptides identified by searching protein sequence databases with tandem mass spectra. J. Proteome Res. 4, 998–1005 [DOI] [PubMed] [Google Scholar]
- 37. Colaert N., Helsens K., Martens L., Vandekerckhove J., Gevaert K. (2009) Improved visualization of protein consensus sequences by iceLogo. Nat. Methods 6, 786–787 [DOI] [PubMed] [Google Scholar]
- 38. Huang da W., Sherman B. T., Lempicki R. A. (2009) Bioinformatics enrichment tools: paths toward the comprehensive functional analysis of large gene lists. Nucleic Acids Res. 37, 1–13 [DOI] [PMC free article] [PubMed] [Google Scholar]
- 39. Ashburner M., Ball C. A., Blake J. A., Botstein D., Butler H., Cherry J. M., Davis A. P., Dolinski K., Dwight S. S., Eppig J. T., Harris M. A., Hill D. P., Issel-Tarver L., Kasarskis A., Lewis S., Matese J. C., Richardson J. E., Ringwald M., Rubin G. M., Sherlock G. (2000) Gene Ontology: tool for the unification of biology. The Gene Ontology Consortium. Nat. Genet. 25, 25–29 [DOI] [PMC free article] [PubMed] [Google Scholar]
- 40. Kanehisa M., Goto S. (2000) KEGG: Kyoto Encyclopedia of Genes and Genomes. Nucleic Acids Res. 28, 27–30 [DOI] [PMC free article] [PubMed] [Google Scholar]
- 41. Finn R. D., Tate J., Mistry J., Coggill P. C., Sammut S. J., Hotz H. R., Ceric G., Forslund K., Eddy S. R., Sonnhammer E. L., Bateman A. (2008) The Pfam protein families database. Nucleic Acids Res. 36, D281–D288 [DOI] [PMC free article] [PubMed] [Google Scholar]
- 42. Jensen L. J., Kuhn M., Stark M., Chaffron S., Creevey C., Muller J., Doerks T., Julien P., Roth A., Simonovic M., Bork P., von Mering C. (2009) STRING 8—a global view on proteins and their functional interactions in 630 organisms. Nucleic Acids Res. 37, D412–D416 [DOI] [PMC free article] [PubMed] [Google Scholar]
- 43. Shannon P., Markiel A., Ozier O., Baliga N. S., Wang J. T., Ramage D., Amin N., Schwikowski B., Ideker T. (2003) Cytoscape: a software environment for integrated models of biomolecular interaction networks. Genome Res. 13, 2498–2504 [DOI] [PMC free article] [PubMed] [Google Scholar]
- 44. Olsen J. V., Vermeulen M., Santamaria A., Kumar C., Miller M. L., Jensen L. J., Gnad F., Cox J., Jensen T. S., Nigg E. A., Brunak S., Mann M. (2010) Quantitative phosphoproteomics reveals widespread full phosphorylation site occupancy during mitosis. Sci. Signal. 3, ra3. [DOI] [PubMed] [Google Scholar]
- 45. Agirrezabala X., Frank J. (2009) Elongation in translation as a dynamic interaction among the ribosome, tRNA, and elongation factors EF-G and EF-Tu. Q Rev. Biophys. 42, 159–200 [DOI] [PMC free article] [PubMed] [Google Scholar]
- 46. Yang X. J. (2004) Lysine acetylation and the bromodomain: a new partnership for signaling. Bioessays 26, 1076–1087 [DOI] [PubMed] [Google Scholar]
- 47. Kouzarides T. (2007) Chromatin modifications and their function. Cell 128, 693–705 [DOI] [PubMed] [Google Scholar]
- 48. Hart G. W., Slawson C., Ramirez-Correa G., Lagerlof O. (2011) Cross talk between O-GlcNAcylation and phosphorylation: roles in signaling, transcription, and chronic disease. Annu. Rev. Biochem. 80, 825–858 [DOI] [PMC free article] [PubMed] [Google Scholar]
- 49. Davies C., Bussiere D. E., Golden B. L., Porter S. J., Ramakrishnan V., White S. W. (1998) Ribosomal proteins S5 and L6: high resolution crystal structures and roles in protein synthesis and antibiotic resistance. J. Mol. Biol. 19, 873–888 [DOI] [PubMed] [Google Scholar]
- 50. Starai V. J., Escalante-Semerena J. C. (2004) Identification of the protein acetyltransferase (Pat) enzyme that acetylates acetyl-CoA synthetase in Salmonella enterica. J. Mol. Biol. 340, 1005–1012 [DOI] [PubMed] [Google Scholar]
- 51. Weinert B. T., Scholz C., Wagner S. A., Iesmantavicius V., Su D., Daniel J. A., Choudhary C. (2013) Lysine succinylation is a frequently occurring modification in prokaryotes and eukaryotes and extensively overlaps with acetylation. Cell Rep. 4, 842–851 [DOI] [PubMed] [Google Scholar]
- 52. Weinert B. T., Iesmantavicius V., Wagner S. A., Schölz C., Gummesson B., Beli P., Nyström T., Choudhary C. R. (2013) ‘Acetyl-Phosphate Is a Critical Determinant of Lysine Acetylation in E. coli.’ Molecular Cell vol 51, no. 2, pp. 265–272 [DOI] [PubMed] [Google Scholar]
Associated Data
This section collects any data citations, data availability statements, or supplementary materials included in this article.