

Abstract
Ethylene is an important plant hormone that regulates numerous cellular processes and stress responses. The mode of action of ethylene is both dose- and time-dependent. Protein phosphorylation plays a key role in ethylene signaling, which is mediated by the activities of ethylene receptors, constitutive triple response 1 (CTR1) kinase, and phosphatase. To address how ethylene alters the cellular protein phosphorylation profile in a time-dependent manner, differential and quantitative phosphoproteomics based on 15N stable isotope labeling in Arabidopsis was performed on both one-minute ethylene-treated Arabidopsis ethylene-overly-sensitive loss-of-function mutant rcn1-1, deficient in PP2A phosphatase activity, and a pair of long-term ethylene-treated wild-type and loss-of-function ethylene signaling ctr1-1 mutants, deficient in mitogen-activated kinase kinase kinase activity. In total, 1079 phosphopeptides were identified, among which 44 were novel. Several one-minute ethylene-regulated phosphoproteins were found from the rcn1-1. Bioinformatic analysis of the rcn1-1 phosphoproteome predicted nine phosphoproteins as the putative substrates for PP2A phosphatase. In addition, from CTR1 kinase-enhanced phosphosites, we also found putative CTR1 kinase substrates including plastid transcriptionally active protein and calcium-sensing receptor. These regulatory proteins are phosphorylated in the presence of ethylene. Analysis of ethylene-regulated phosphosites using the group-based prediction system with a protein–protein interaction filter revealed a total of 14 kinase–substrate relationships that may function in both CTR1 kinase- and PP2A phosphatase-mediated phosphor-relay pathways. Finally, several ethylene-regulated post-translational modification network models have been built using molecular systems biology tools. It is proposed that ethylene regulates the phosphorylation of arginine/serine-rich splicing factor 41, plasma membrane intrinsic protein 2A, light harvesting chlorophyll A/B binding protein 1.1, and flowering bHLH 3 proteins in a dual-and-opposing fashion.
Ethylene is a volatile plant hormone that regulates versatile molecular and physiological processes in higher plants (1). The perception of this gaseous two-carbon hormone is achieved by a group of membrane-associated dimeric ethylene receptors that resemble bacterial two-component signaling systems and are composed of hybrid histidine (or aspartic acid) kinases, a histidine-containing phosphor-transfer domain, and response regulators (2). These receptors are made of two membrane-bound protein subunits cross-linked at the N-terminal region through two disulfide bonds (3). In Arabidopsis, there are five different ethylene receptor subunits: ethylene response 1, ethylene response 2, ethylene insensitive 4 (EIN4),1 ethylene response sensor 1, and ethylene response sensor 2, each of which is encoded by an ethylene receptor gene of unique DNA sequence and structure (4). Ethylene gas binds to a pair of cross-linked transmembrane domains in a receptor with the help of an incorporated copper ion (5). The physical interaction of ethylene molecules with receptor complexes somehow induces inactivation of the negative regulation of another downstream signaling component, constitutive triple response 1 (CTR1) (AT5G03730) (6). This ethylene-signaling component has been perceived as a Raf-like Ser/Thr protein kinase, a putative mitogen-activated protein kinase kinase kinase (MAPKKK) (6, 7), and its primary function in the ethylene signal-transduction pathway has been defined as a negative regulator of ethylene responses according to molecular genetic studies (8). CRT1 physically interacts with both ethylene receptors (9, 10) and a downstream positive regulator of ethylene response, EIN2 (11, 12), and it directly inhibits the molecular function of EIN2 in ethylene signaling by phosphorylating EIN2 (12), which was identified as an endoplasmic reticulum (ER) membrane-localized natural resistance-associated macrophage protein homolog (13). When ethylene binds to ethylene receptors, the negative regulation of ethylene signaling output from CTR1 is reduced, dephosphorylation of EIN2 occurs, and the C terminus of EIN2 is subsequently cleaved from the putative metal ion channel and translocated into the nucleus to initiate the activation of transcriptional cascades for most ethylene-responsive gene expression (11). The EIN2 C-terminus-activated EIN3 and ethylene insensitive 3-like 1 ethylene response transcription factors (14–16) consequently orchestrate combinatorial control over the transcriptional activities of a large number of ethylene response factor proteins (17) that lead to plant ethylene responses.
Given the established ethylene-signaling pathway, an emerging and pressing issue is how to deploy the current mechanistic paradigm of ethylene signaling to address diverse ethylene responses in plants (18, 19). The mode of ethylene action is dose-dependent in Arabidopsis (20, 21), and its response to ethylene is achieved over a wide range of concentrations (22). At lower concentrations, ethylene promotes both gravicurvature of inflorescence stem and elongation of etiolated seedlings of Arabidopsis (20, 23), whereas at higher concentrations it inhibits both gravicurvature and elongation of the etiolated seedlings (21, 23). In addition, plant responses to ethylene are also time-dependent (20, 23, 24). A short-term exposure to ethylene inhibits gravicurvature of inflorescence stem in Arabidopsis, whereas a long-term pretreatment, regardless of the concentration of ethylene, stimulates gravicurvature (20, 24). Such a dual-and-opposing effect of ethylene on the Arabidopsis shoot gravitropic response was also found in the regulation of flowering (25). The sophisticated mode of action of ethylene is typified by the fact that it delays bolting and both the ethylene receptor mutant etr1-1 and the receptor-interacting signaling component mutant ctr1-1 exhibit similar delayed-bolting phenotypes (26, 27). Attempts to address the diverse and complex phenomena related to ethylene responses with a transcriptomics approach have confirmed the existence of a difference in gene expression profiles between ethylene-treated wild-type Arabidopsis and the constitutive ethylene response mutant ctr1-1 (11, 28, 29). Molecular biological analysis has successfully classified ethylene-regulated genes into early- and late-induction groups (30, 31). The integration of biochemical and cellular functions of each class of time-dependent gene products (i.e. either early or late ethylene-induced gene groups) should constitute separate yet overlapping molecular interaction matrices and networks to define diverse yet complex ethylene responses (32).
Moreover, post-translational modification (PTM) has recently emerged as one of the important mechanisms regulating the complex plant ethylene responses (19). One type of PTM involved in ethylene signaling is the ethylene-dependent and ubiquitin/26S proteasome-mediated protein degradation or stabilization of ethylene receptors and signaling components EIN2 and EIN3 (33–35). The other type of PTM-mediated ethylene signaling is interconversion between the phosphorylation and dephosphorylation statuses of signaling components catalyzed by both kinases and phosphatases (11, 12, 25, 33, 36, 37). Protein phosphor-relay has long been reported to participate in ethylene signaling events (2, 6, 38–40). Many ethylene signaling components, including ethylene receptor family proteins and their downstream regulator CTR1, have kinase activities (7, 34, 41, 42), and there are at least two MAPK cascades involved in the regulation of ethylene signaling and the ethylene-regulated phosphorylation of EIN3 (37, 43). Phosphorylation/dephosphrylation of the ethylene response factor 110 protein has been found to be EIN2-independent (25, 36). Thus, the diverse yet complex plant ethylene responses are actually consequences of the multifaceted and constant integration of ethylene signals mediated by both transcriptional activation cascades and PTM networks (i.e. protein phosphorylation/dephosphorylation, C-terminal cleavage, and ubiquitin/26S proteasome-mediated protein degradation).
The key issue is, therefore, how the ethylene receptor–MAPKKK (including CTR1) complexes convert the binding of ethylene into a signal output in the form of kinase activities in a quantitative and substrate-specific manner (12, 22). The hypothesis that ethylene inactivates kinase activities of CTR1 has not been substantiated in vivo thus far. It is possible that the binding of ethylene to receptors may alter the substrate specificity of the putative CTR1 serine/threonine kinase. The isolation of an enhanced ethylene response 1 (eer1-1) mutant further complicated the study of the already intriguing ethylene signaling in Arabidopsis (44). The enhanced ethylene responsiveness observed in eer1-1 results from a loss-of-function mutation in the A regulatory subunit roots curl in naphthylphthalamic acid 1 (RCN1) (AT1G25490) of protein phosphatase 2A (PP2A) (45), which is one of the three subunits of PP2A in Arabidopsis. This phosphatase is a heterotrimeric serine/threonine phosphatase comprising a catalytic subunit C and two regulatory subunits A and B (46). The phosphatase activity of PP2A decreases significantly in the loss-of-function mutant rcn1-1 (or eer1-1) (47), yet it enhances both ethylene sensitivity and the amplitude of ethylene responses (45). The in vitro demonstration of a strong association of PP2A catalytic subunit PP2A-1C with the kinase domain of CTR1 suggests an interesting kinase activity output model involving both CTR1 serine/threonine kinase and PP2A serine/threonine phosphatase that may act on one or a group of common phosphosites antagonistically in diverse plant ethylene responses (25).
To address the complex and interesting ethylene signaling, a differential and quantitative phosphoproteomics has been employed in the present study. A SILIA-assisted PTM proteomic approach (48) (supplemental Fig. S1) is similar in principle to stable isotope labeling with amino acids in cell culture (49), which has been used frequently in the discovery and quantification of differentially regulated PTMs in various organisms in the past (50–56). The most important advantage of the SILIA approach is that the in vitro–derived variability resulting from each step of multi-dimensional protein identification technology peptide preparation (57) and mass spectrometry analysis is eliminated when protein samples from different treatments are labeled with either light or heavy nitrogen isotopes in parallel, mixed at the beginning step, processed, and measured together (36, 58, 59). Other advantages of this approach include its efficiency, accuracy, repeatability, and economics, and it can allow us to profile protein phosphorylation in planta in response to treatments and developmental cues. In order to investigate the time-dependent phosphor-relay regulated by kinase activities of ethylene receptor–MAPKKK complexes, both short-term and long-term ethylene treatments were performed. First, a pulse of 1-min ethylene exposure was applied onto rcn1-1 (or eer1-1) to induce the initial phosphorylation in the ethylene response. A phosphatase loss-of-function mutant rcn1-1 was employed because both the sensitivity and the amplitude of the ethylene response are enhanced in this mutant (Fig. 1A), which may lead to easier detection of rapidly ethylene-induced phosphoproteins, whereas in the case of long-term ethylene-altered receptor complexes and cellular phosphor-relay networks, we focused on the identification of both direct and indirect putative in vivo substrates of CTR1 kinase. The application of a group-based prediction system (GPS) search engine with a protein–protein interaction (PPI) filter (60) allowed us to identify numerous novel putative kinase–substrate PTM networks under ethylene treatment. These studies provided us with a new perspective on the core issue of how the ethylene receptor–CTR1 MAPKKK complex transduces the ethylene-binding signal into a wide spectrum of downstream cellular processes in addition to its role in the activation of ethylene-inducible gene expression.
Fig. 1.
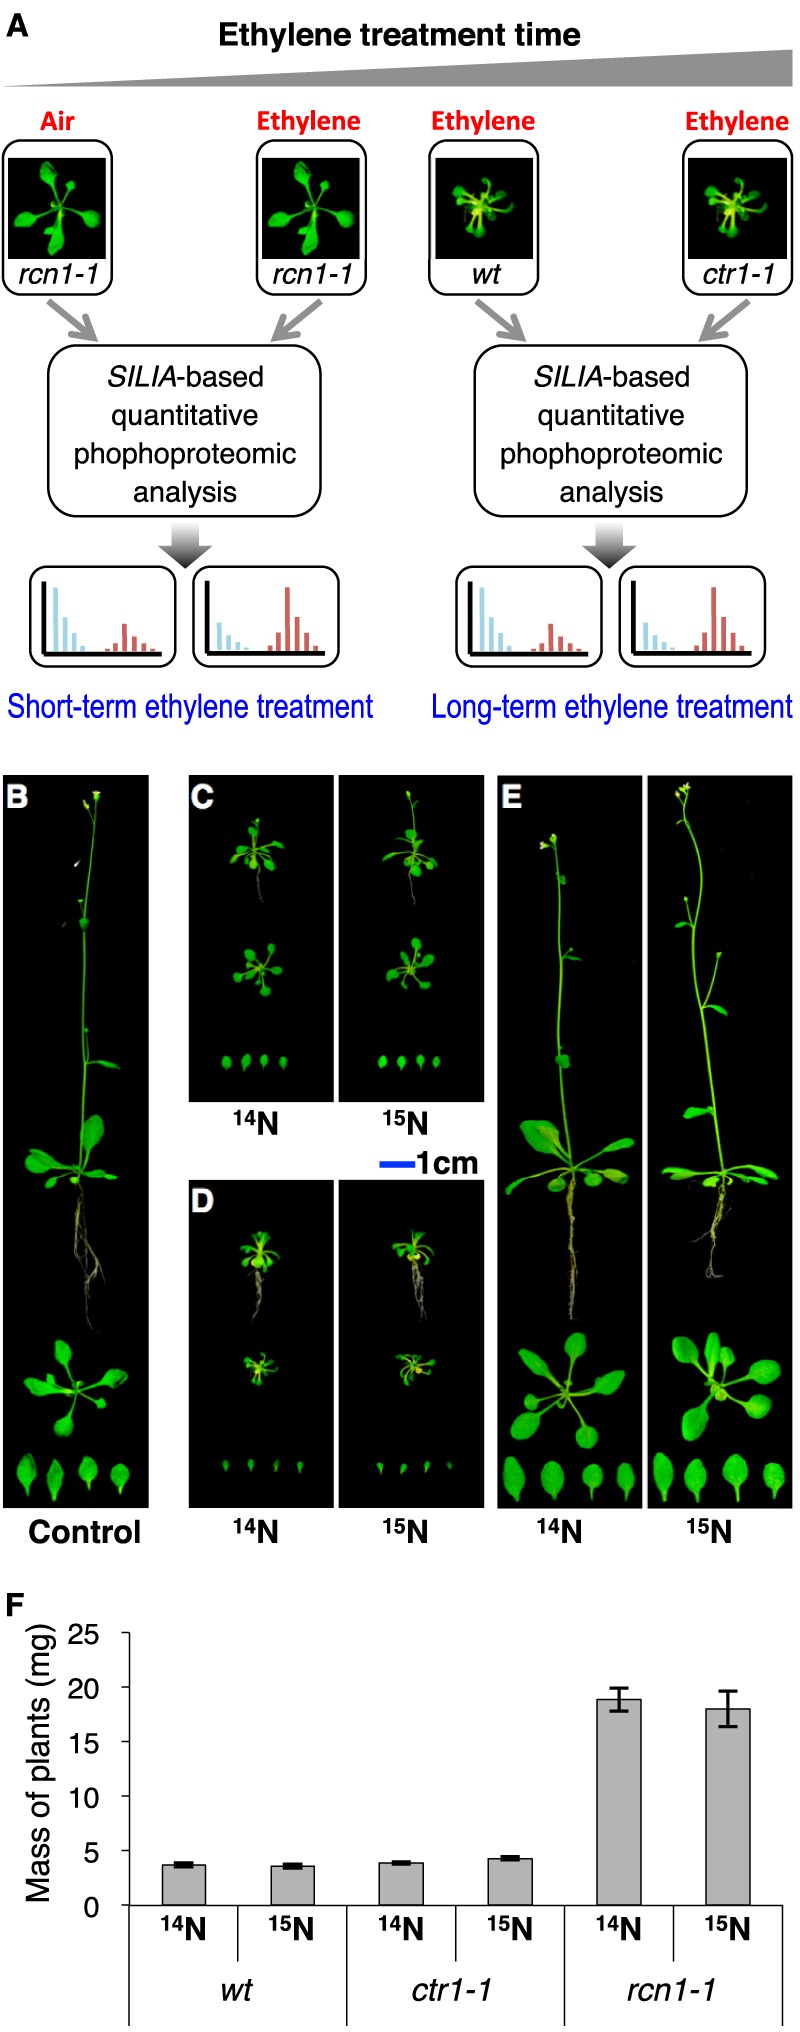
15N stable isotope metabolic labeling and workflow of differential and quantitative PTM proteomics. A, the metabolic labeling-based quantitative PTM proteomic experimental design for the study of the time-dependent regulation of phosphoproteomes by a plant hormone, ethylene. The left-hand panel is a short-term (1 min) ethylene treatment of rcn1-1, and the right-hand panel is a long-term (3 weeks) ethylene treatment of both the wild type (wt) and ctr1-1. B, overall morphology of Col-0 plants grown in a naturally 14N-abundant growth medium. C, overall morphology of wild-type Arabidopsis plants grown in the naturally 14N-abundant medium (left) and the medium enriched with 15N isotope (right). D, overall morphology of ctr1-1 plants, the loss-of-function line of CTR1 protein, a Raf-like kinase, and a member of the MAPKKK family that is thought to be a negative regulator in the ethylene signaling pathway, grown in the naturally 14N-abundant medium (left) or a medium enriched with 15N isotope (right). The immediate precursor of ethylene biosynthesis, 1-aminocyclopropane-1-carboxylic acid, was added to the growth media at a concentration of 5 μm for both the wild type (C) and ctr1-1 (D). E, overall morphology of 14N- (left) and 15N-labeled (right) rcn1-1, the loss-of-function line of the RCN1 gene, which encodes the A regulatory subunit of PP2A protein phosphatase, treated with 10 ppm ethylene.
EXPERIMENTAL PROCEDURES
Plant Growth, 15N Stable Isotope Labeling, and Ethylene Treatment
The wild-type Arabidopsis thaliana ecotypes Columbia-0 (Col-0) and ctr1-1 mutant were obtained from the Arabidopsis Biological Resource Center (Columbus, OH); eer1-1 and rcn1-1 mutants were gifts from Dr. Caren Chang and from Dr. Alison DeLong and Dr. Gloria K. Muday, respectively. Seeds were first surface-sterilized and imbibed on wet paper towels at 4 °C for 4 days in a sealed box. These seeds were then mixed with 0.1% (w/v) agar solution and sown on agar growth media dispensed in 9-cm-diameter glass jars containing 9 mm KNO3, 0.4 mm Ca5OH(PO4)3, 2 mm MgSO4, 1.3 mm H3PO4, 50 μm Fe-EDTA, 70 μm H3BO3, 14 μm MnCl2, 0.5 μm CuSO4, 1 μm ZnSO4, 0.2 μm Na2MoO4, 10 μm NaCl, 0.01 μm CoCl2, 10 g/l sucrose, 1 mg/l thiamine HCL, 0.1 mg/l pyridoxine, 0.1 mg/l nicotinic acid, 100 mg/l myo-inositol, and 0.8% bacteriological agar, pH 5.7. In each growth jar, 13 to 16 rcn1-1 seeds or 18 to 24 of both ACC-treated wild-type and ctr1-1 seeds were sown. Seeds for the normal-size plant were sown about 1.5 to 2 cm apart from each other, and dwarf plants were sown 1 to 1.5 cm apart. In each biological replicate, 10 to 20 jars of Arabidopsis plants were routinely grown for each treated or unique genotype plant group. These jars were then transferred to plant growth chambers with a 16-h light/8-h dark cycle with a constant temperature of 22 °C ± 2 °C. The flowering plants grown inside jars were harvested 3 weeks later in liquid nitrogen and stored in a refrigerator at −140 °C. Approximately 1.5 to 1.7 g tissue were collected often from each treated or unique genotype plant group.
To label the plant proteins with the heavy nitrogen stable isotope 15N, the natural light nitrogen isotope-coded KNO3 (K14NO3), used as the sole nitrogen source in the medium, was substituted with the heavy nitrogen-coded K15NO3 (Cambridge Isotope Laboratories, Inc., Andover, MA) based on the metabolic labeling approach (48).
Both Col-0 and ctr1-1 Arabidopsis plants were treated with constant ethylene by being grown on medium containing 5 mm ACC (the immediate precursor of ethylene). In the one-minute ethylene treatment of rcn1-1 mutant, the growth medium was supplemented with 0.15 mm aminooxyacetic acid, an inhibitor of ACC synthase. One minute of ethylene treatment was applied to rcn1-1 mutant just before it was harvested. To do that, two groups of 3-week-old rcn1-1 plants, one labeled with 14N and the other with 15N, were placed in an airflow chamber for 5 h to reduce the endogenous ethylene level. Afterward, one of the two groups (either 14N- or 15N-labeled plants) was treated with 10 ppm ethylene for 1 min, and the other group of plants was retained in air for the same amount of time. Both groups of plants were harvested in liquid nitrogen as described previously (38).
Isolation of 14N/15N-coded Total Cellular Proteins under Fully Denaturing Conditions
14N- and 15N-labeled Arabidopsis tissues were ground separately with a −20 °C pre-cooled mortar and pestle in the presence of a urea extraction buffer containing 150 mm Tris-HCl (pH 7.6), 8 m urea, 0.5% SDS, 1.2% Triton X-100, 20 mm EDTA, 20 mm EGTA, 50 mm NaF, 1% glycerol 2-phosphate, 1 mm PMSF, 5 mm DTT, 0.5% phosphatase inhibitor mixture 2 (Sigma), an EDTA-free protease-inhibitor mixture (Complete™), 5 mm ascorbic acid, and 2% polyvinylpolypyrrolidone. The ratio of Arabidopsis frozen powder to urea extraction buffer was 1:3 (w/v). Plant cell debris were removed via centrifugation at a lower speed of relative centrifugal force of 10,000 × g for 1 h at 4 °C and then a higher speed at a relative centrifugal force of 110,000 × g for 2 h at 13 °C. The protein supernatant was then mixed with three volumes of a cold acetone/methanol (12:1 v/v) organic mix for urea-methanol protein precipitation. The protein pellet was rinsed with 15 volumes (v/w) of a cold acetone:methanol:H2O mix (12:1:1.4 v/v) to remove residual pigment and urea precipitates. The protein pellet was air-dried and redissolved in a one-third volume of resuspension buffer containing 50 mm Tris-HCl (pH 6.8), 8 m urea, 5 mm DTT, 1% SDS, and 10 mm EDTA, and this was followed by another round of protein precipitation and resuspension. The cycling of protein precipitation and resuspension was repeated twice. The resulting total cellular protein was measured via protein DC assay (Bio-Rad) and calculated according to a bovine serum albumin (BSA) protein standard curve. With this method, 1 g of wild-type, ctr1-1, and rcn1-1 Arabidopsis routinely yield 5 to 15 mg of total cellular proteins. Both 14N- and 15N-coded proteins were stored at −80 °C for later use.
SDS-PAGE Fractionation of Total Cellular Proteins and In-gel Protease Digestion
In order to control the mixing ratio of proteins well and eliminate possible effects of the variable total cellular protein content (per gram of fresh weight) in the plants and the hand-mixing of frozen tissue powders, both 14N- and 15N-coded total cellular proteins were mixed together at a ratio of 1/q, where q is slightly greater than 1. The rationale was that metabolic labeling with heavy nitrogen often generates an incomplete incorporation, so that the 15N-coded monoisotopic peak is slightly shorter than the 14N-coded one on average. To give the 15N-coded peptide ion precursor an equal chance of MS/MS acquisition, various values of q (1.0–1.2) were adopted in different biological replicates. A total of 10 mg of protein mixture was loaded onto a 190 mm × 180 mm preparative SDS-PAGE slab gel (10%). Four to five SDS-PAGE slab gels were often used in each biological experiment for the first-dimension separation. Each slab gel was immersed in a Coomassie Brilliant Blue staining buffer for 0.5 h with gentle shaking and destained in a buffer for 0.5 to 2 h. The whole slab gel was sliced evenly into five strips and further diced into (1 × 1.5 × 1.5) mm3 cubes. The gel cubes were washed several times with 50% CH3CN/50 mm NH4HCO3 to remove residual Coomassie Brilliant Blue dye, dehydrated by 100% ACN, and flushed with compressed air until completely dry. Finally, the cubes were reduced using 10 mm DTT and alkylated using 55 mm iodoacetamide. Following two additional washes using 50% CH3CN/50 mm NH4HCO3 and complete dehydration, the dried gel cubes were rehydrated with 30 ng/μl trypsin (25 mm NH4HCO3, pH 8.0) on ice for 0.5 h and then digested overnight at 37 °C. The digested peptides were extracted by 1% formic acid in 50% ACN three times. The peptide mixture was evaporated to remove ACN, lyophilized to a completely dry powder, and then stored at −80 °C.
Ion Exchange Chromatography and Fe3+-IMAC/TiO2 Enrichment
The dehydrated peptide powder was reconstituted in 1 ml of strong cation exchange solvent A containing 5 mm KH2PO4, pH 2.7, and 30% ACN and centrifuged at 4 °C for 5 min at a maximum speed. An aliquot (20 μl) of the mixture was reserved for quality control testing and the later concentration measurement. A portion of the peptide sample (less than 1.6 mg) was subjected to an ion exchange chromatography separation. Peptides were eluted off the strong cation exchange column with solvent B containing 5 mm KH2PO4, 350 mm KCl, pH 2.7, and 30% ACN. The liquid chromatography (LC) gradient was set as follows: 0–1 min, 0% buffer B; 1–12 min, 15% buffer B; 12–18 min, 35% buffer B; 18–22 min, 100% buffer B; 22–26 min, 100% buffer B; 26–40 min, 0% buffer B. The flow rate was set at 1 ml/min. A total of 12 fractions were collected between 2 and 26 min of elution at 2 min per fraction. Groups of fractions 1–3 and 10–12 were combined. The ACN eluate from each fraction was evaporated, frozen by liquid nitrogen, and lyophilized to obtain a 50% reduction in volume. The peptide mixture solution was desalted via a C18 reverse-phase column (Oasis HLB, Waters, Milford, MA) and reconstituted in 200 μl of immobilized metal-ion-affinity chromatography (IMAC) loading buffer containing 1.5% acetic acid, 30% ACN, pH <3.0. The first IMAC beads used in our experiment were ferric nitrilotriacetate gel beads (Fe3+-NTA, Phos-Select Iron Affinity Gel, Sigma). The Fe3+-NTA beads were added to the peptide sample at a ratio of 1:30 (milligrams of peptides/microliters of pre-hydrated Fe3+-NTA beads) and incubated for 45 min. These beads were washed with 200 μl of loading buffer twice and once with an additional 200 μl water. The peptides were then eluted off the beads with 50 μl of 5% ammonium hydroxide (pH 12.0).
To enrich phosphopeptides, a second set of IMAC beads made of TiO2 was employed. In this IMAC protocol, 800 μl of TiO2 loading buffer containing 1.25 m glycolic acid, 6% trifluoroacetic acid (TFA), and 82.5% ACN was mixed with the flow-through fractions from Fe3+-NTA IMAC, and the flow-through peptides were incubated with 5 mg of TiO2 beads (GL Science Inc., Tokyo, Japan) for another 45 min. The TiO2 beads were washed twice using 200 μl of TiO2 equilibration/washing buffer containing 1 m glycolic acid, 5% TFA, and 80% ACN and once using 200 μl water. Phosphopeptides were eluted off the beads with 50 μl of elution buffer (5% ammonium hydroxide). Phosphopeptides eluted from both Fe3+-IMAC and TiO2 beads were combined and desalted using zip-tip C18 columns (Millipore, Billerica, MA) for later LC-MS/MS analysis.
LC-MS/MS Data Acquisition and Analysis
Tandem mass spectrometry (MS/MS) analysis of phosphopeptides was performed using a nanoflow LC (Nano Acquity™, Waters) coupled to an electrospray ionization hybrid Q-TOF Premier tandem mass spectrometer (Waters). Mass spectra of peptides were acquired using the data-dependent acquisition mode of electrospray ionization Q-TOF. The computer program MassLynx (version 4.1, Waters) was used for data acquisition and instrument control. A 180 μm × 20 mm Symmetry C18 trap column and a 75 μm × 250 mm BEH130 C18 analytical column were used. The mass spectrometer was operated in positive ion mode with the following basic parameters: source temperature of 80 °C, capillary voltage of 2.4 KV, sample cone voltage of 35 V, and collision cell gas flow rate of 0.5 ml/min. The collision energy is variable during MS/MS scans according to the z and m/z. The exact settings followed the instructions from the MS machine manufacturer. The data-dependent analysis settings were as follows: 1 s MS, m/z 250–2500 and a maximum of 3 s MS/MS, m/z 50–2500 (continuum mode), 60 s dynamic exclusion. The most abundant +2, +3, or +4 charged ions whose intensity rose above 40 counts/s were subjected to the subsequent MS/MS scan survey.
Identification of 14N/15N-coded Phosphopeptides
The resulting MS/MS spectra of phosphopeptide samples were converted to peak list files by Proteinlynx (version 2.2.5) and searched against the Arabidopsis Information Resource Arabidopsis protein database, version 10 (TAIR10, December 2012 release, 35,386 proteins included) using the Mascot search engine (version 2.3, Matrix Science, London, UK). The search parameters were set such that up to one missed cleavage site was allowed. Mass tolerances were set as ±50 ppm for MS precursor ions and 0.2 Da for MS/MS fragment ions. Carbamidomethylation (C) was specified as the fixed modification, and phosphorylation (S, T, and Y) and oxidation (M) were allowed as the variable modifications. The quantitation method “15N metabolic” was included in order to identify heavy nitrogen-labeled peptides.
In order to establish a stringent filter for the peptide identification, the false discovery rate (FDR) of peptide identification was estimated using target-decoy searching (61). According to the recommendation of Blanco et al. (62), MS/MS spectra were searched against the target and decoy databases independently. Then the FDR was calculated as the number of decoy hits divided by the number of target peptide identifications (63, 64), each of which possesses a satisfactory E-value (i.e. expectation value) that is defined as a composite score for the quality of peptide identification offered by the Mascot search engine. In addition to the FDR estimated for the identification of either 14N- or 15N-coded peptides, the FDR for peptides discovered in pairs (i.e. both 14N- and 15N-coded identical peptides) were also calculated (supplemental Fig. S2).
Quantitative Analysis of 14N/15N-coded Phosphopeptides
Ion chromatograms of a ±150 ppm m/z window were extracted around the monoisotopics of both 14N and 15N isotopic envelopes. These ion chromatograms were integrated for calculation of the areas under the chromatographic peaks, in which the phosphopeptide MS/MS survey was performed. The isotopologue distributions of both 14N- and 15N-coded phosphopeptides were obtained based on the Yergey algorithm (65). The ratio of the whole isotopic envelope of 14N/15N-coded phosphopeptides was calculated using ion counts from the monoisotopic peak and its isotopologue distribution,
 |
where M14 and M15 are the ion counts of the monoisotopic peaks of 14N- and 15N-coded phosphopeptides, respectively, and k14% and k15% are the percentages of monoisotopics in the isotopic envelopes of 14N- and 15N-coded phosphopeptides, respectively. When calculating the isotopologue distribution of 15N-coded phosphopeptides, a 97.43% incorporation rate of 15N into light nitrogen-coded peptides was measured following a procedure described previously (48).
To further eliminate the random variation resulting from the protein mixing, the median value mr of the log2 ratios of ion intensities of 14N/15N-coded phosphopeptide pairs was generated based on each experimental data set (either forward or reciprocal). The actual q of each protein-mixing pair was obtained from the equation mr = log2 (1/q). The log2 ratio of the ion intensity of each phosphopeptide pair was normalized against the median values (supplemental Fig. S3). Afterward, the average log2 ratio of the ion intensity of each phosphopeptide pair was calculated according to the normalized ratio of ion intensity of 14N/15N-coded phosphopeptides found from both forward and reciprocal experimental data sets. Only the phosphopeptides that were detected in both forward and reciprocal experiments and found in both 14N- and 15N-coded isoforms were included in the data set for quantification.
The up- or down-regulated phosphopeptides were obtained using the following method. First, the statistical significance of each selected phosphopeptide was determined via a two-tailed t test (unequal variance, p < 0.05) (66). Next, the averaged log2 ratios of each experiment were fitted by a normal distribution, and values outside the mean ±2 S.D. of this distribution of phosphopeptides were set as threshold values having a significant change. Only the phosphopeptides showing a significant difference at both individual (i.e. the statistically significant ones from the t test) and population (those with log2 ratios located more than ±2 S.D. apart from the mean of the distribution) levels were considered as regulated phosphopeptides. The detection limit (10%) of the SILIA method (48) was used as an additional filter for significantly changed phosphopeptides.
Bioinformatic Analysis of Phosphorylation Site and Motif Construction
BLAST-based phosphorylation site and motif mining was performed according to a method described previously (38). The newly identified putative phosphoprotein regions with 55.5% or greater homology to the query phosphoprotein sequence were further aligned based on amino acid sequences using the alignment program ClustalW. For the construction of a phosphosite motif, several amino acids on both sides of a phosphosite were chosen from BLAST-searched putative phosphoprotein sequences and subjected to alignment using the substitution matrix pam30. A phosphorylation motif was constructed from the MS-derived authentic phosphosite and three or more of those ClustalW-identified putative phosphoprotein sequences.
The in Vitro Plant Kinase Assay
His-tagged synthetic peptides containing phosphorylation sites were made and used as substrates in Arabidopsis kinase assays according to a modified protocol (25, 38). To prepare the plant kinase extract, 20 mg of frozen plant tissues were ground in liquid nitrogen in the presence of 60 μl kinase extraction buffer containing 20 mm HEPES, pH 7.5, 50 mm NaCl, 50 mm KCl, 0.3% Triton X-100, 2.5 mm sodium pyrophosphate, 1 mm sodium fluoride, 1 mm sodium orthovanadate, 1 mm sodium molybdate, 1 mm glycerol-2-phosphate, 1 mm PMSF, and an EDTA-free protease inhibitor mixture (Complete™). The phosphatase inhibitors were excluded in the case of RCN1 phosphatase-specific substrate discovery (sodium pyrophosphate, sodium fluoride, sodium orthovanadatae, sodium molybdate, and glycerol-2-phosphate) (67, 68). The kinase extract was centrifuged at for 1 min 4 °C and 14,000 × g to remove the cell debris and further subjected to a spun column containing Ni-NTA agarose beads (Qiagen, Venlo, Netherlands) to remove nonspecific histag-binding proteins present in the crude Arabidopsis protein extract. A flow-through fraction of 50 μl was mixed with 12.5 μl of kinase assay buffer consisting of 45% glycerol, 2.5 mm ATP, 50 mm MgCl2, and 125 mg/ml BSA. The peptide substrates of 2 nmoles were added, and the kinase assay mixture was incubated at 30 °C for 30 min. The kinase reaction was terminated by the addition of 130 μl of denaturing buffer (8 m urea, 50 mm Na2HPO4, pH 8.0). Polyhistidine-tagged peptides were enriched using 15 μl of Ni-NTA agarose beads as described above. An on-bead trypsin digestion was performed at 37 °C for 4 h. Digested peptides were desalted by C18 ZipTips and reconstituted in 0.1% HCOOH for the LC-MS/MS analysis. As a control, the substrate peptides were also digested alone by trypsin and subjected to LC-MS/MS.
During isobaric tag for relative and absolute quantitation (iTRAQ) labeling, the trypsin-digested substrate peptide mixtures were extracted from the incubation tube using a GE loader tip (GE Healthcare). The resulting mixtures containing 0-, 1-, 5- and 15-min ethylene-treated kinase extracts were lyophilized and incubated with iTRAQ 4-plex labeling buffer (Applied Biosystems, Foster City, CA) that contained isobaric reagents providing a chemical linker of m/z 114, 115, 116, and 117 in MS acquisition, respectively, for 1 h at room temperature as previously described (25). The differentially iTRAQ-labeled peptide samples were combined, purified by Fe3+-IMAC and TiO2 beads, desalted sequentially on C18 ZipTips, and resuspended in 0.1% TFA. MALDI-TOF/TOF analyses were performed with a Bruker Autoflex III MALDI-TOF/TOF MS/Dionex device (Ultraflex, Bruker, Billerica, MA), and the spectra of peptides were collected. The sample was directly spotted onto the MALDI plate because one peptide was analyzed at a time and the phosphor-isoform was enriched. The TOF mode was activated for the precursor ion profiling. When a matching precursor of the target peptide/phosphorylated peptide was found, the mass spectrometer was switched to LIFT-TOF/TOF mode to acquire the MS/MS spectrum. Finally, the iTRAQ reporter ions of 114, 115, 116, and 117 m/z were integrated. The ion intensity of the reporter ion of the 0-min ethylene-treated sample (m/z 114) was set as 100%. Consequently, changes in the relative phosphorylation level of the ethylene-treated sample at different time points were calculated by comparing the ion intensities of their reporter ions against that of the 0-min ethylene-treated sample. The experiment was repeated at least three times for each peptide.
Computational Prediction of the Kinases Associated to the Phosphorylation Sites
Previously, we developed a GPS software package for the prediction of kinase-specific phosphorylation sites (60). Because the plant kinases were not included in GPS 2.1 (60), here we first obtained 1056 Arabidopsis kinase sequences from our newly developed database, the Eukaryotic Kinase and Phosphatase Database (unpublished). Based on previously described rationales (69, 70), these kinases were preclassified in a hierarchical structure including group, family, and single kinase. With the classification information, we manually chose one predictor in GPS 2.1 for each Arabidopsis kinase, if available (supplemental Table S6A). In total, 932 kinases were selected with GPS predictors (supplemental Table S6B). Then experimentally identified phosphorylation sites were predicted by GPS 2.1 while the site-specific kinase–substrate relations were determined (supplemental Table S6A). We also collected experimentally identified PPIs in Arabidopsis (supplemental Table S6B) from several public databases, such as BioGRID (71), the Database of Interacting Proteins (72), IntAct (73), and MINT (74). The pre-predicted Arabidopsis PPIs (supplemental Table S6B) were taken from the STRING database (75). The GPS predictions were reserved if the relations of kinases and substrates were supported by either experimental or predicted PPIs.
RESULTS
15N Stable Isotope Labeling and Ethylene Treatment of Arabidopsis
The wild-type plant and two loss-of-function ethylene response mutants, ctr1-1 and rcn1-1 (or eer1-1), were selected for quantitative phosphoproteomics to study the phosphoproteomes of time-dependent ethylene responses in Arabidopsis. These plants were grown in either 14N or 15N stable isotope labeling medium (see “Experimental Procedures”). Because both wild-type and ethylene-response mutants are known to have internal ethylene biosynthesis (20, 24, 44, 76, 77), an ACC synthase inhibitor (aminooxyacetic acid) was added to rcn1-1 mutant growth media specifically to reduce the influence of endogenous ethylene. Morphologies of ethylene-treated wild-type Arabidopsis (ecotype Col-0), ctr1-1, and rcn1-1 are shown in Fig. 1. The long-term ethylene-treated forms of both Col-0 (Fig. 1C) and ctr1-1 (Fig. 1D) produce a uniform dwarf phenotype with smaller leaves (6) relative to those of untreated air-grown Arabidopsis (Fig. 1B). To confer a rapid ethylene response to Arabidopsis plants, the ethylene overly sensitive mutant rcn1-1 was also grown on the metabolic labeling medium and subjected to 1 min of ethylene gas fumigation. As a result, no visible morphological alteration was observed between 3-week-old rcn1-1 (Fig. 1E) and Col-0 (Fig. 1B). However, when a standard ethylene triple response assay was performed on rcn1-1, the hypocotyl length of the etiolated seedling of this mutant was reduced 14.9%, 10.2%, and 2.6% in the presence of 0.1, 0.5, and 1 ppm ethylene, respectively, as compared with that of Col-0 treated under the same conditions, which is consistent with the previous finding that rcn1-1 is more sensitive to a lower level of ethylene (44).
To perform SILIA-based quantitative phosphoproteomic analysis of both the short-term ethylene-treated rcn1-1 plants and the long-term ethylene-treated Col-0 and ctr1-1, each pair of plant groups was grown on either a medium containing a natural abundance of nitrogen isotope (14N-coded salt) or a medium containing the heavy nitrogen isotope (15N-coded salt). To confirm that heavy nitrogen had no detectable effect on the growth of these plants, the biomass of each Arabidopsis genotype was measured under both light and heavy nitrogen growth conditions. As expected, no significant difference was found in biomass at the time of tissue harvesting between the plant groups (Fig. 1F), which concurs with the previously published conclusion (66).
LC-MS/MS-based Phosphopeptide Profiling of Ethylene-treated Wild Type and Mutants
For quantitative phosphoproteomics analysis on both ethylene-treated wild-type Arabidopsis and ethylene-response mutants, the total cellular proteins were extracted separately from two groups of differentially labeled plant tissues (supplemental Fig. S1). Both 14N- and 15N-labeled proteins were mixed together at a chosen ratio depending on the actual heavy nitrogen labeling efficiency (see “Experimental Procedures”). Four biological replicates (both forward and reciprocal) were performed for both rcn1-1 and ctr1-1 experiments. The mixture of 14N-/15N-coded proteins was then analyzed according to a modified protocol combining gel electrophoresis with LC-MS/MS (38). By this approach, both isotope-coded proteins were processed into five fractions of trypsin-digested peptides derived from five strips of gels and further fractionated via strong cation exchange liquid chromatography. At the end, a total of 40 subfractions of peptides (5 peptide mixtures × 8 LC fractions) were collected and subjected to phosphopeptide enrichment using both Fe3+-IMAC and TiO2 beads in a sequential order (supplemental Fig. S1). The resulting 40 phosphopeptide mixtures were analyzed using a nano-LC electrospray ionization Q-TOF mass spectrometer. As a result, 67,576 peptides were identified by the Mascot search engine. The expectation value was defined as a composite score for the quality assessment of peptide identification, and the FDR of peptide identifications was consequently estimated using target-decoy searching (61). A decoy search independent from the target one was conducted according to a recommended method (62). The E-value thresholds for single isotope-coded peptide identification and double isotope-coded peptide identification were determined to be 0.275 and 1.65, respectively, for FDR ≤ 1% (see “Experimental Procedures”; supplemental Fig. S2). Thus, a data set containing a total of 4043 phosphopeptides was obtained based on these thresholds, by which 420, 543, and 3080 phosphopeptides were identified from the wild type, ctr1-1, and rcn1-1, respectively. Among the 4043 phosphopeptides identified, most phosphorylation events occurred on serine (3032, 69.7%) and threonine (1194, 27.5%) residues, with only a few on tyrosine residues (122, 2.8%) (Fig. 2A). Singly and doubly phosphorylated peptides accounted for 92.5% and 7.4% of all phosphopeptides, respectively, and the rest were triply phosphorylated (Fig. 2A). Eventually, the analyses yielded 1079 unique phosphopeptides representing 654 different phosphoproteins with unique Genebank accession numbers (Fig. 2B). The number of unique phosphorylation sites identified from each genotype of Arabidopsis irrespective of hormone treatments is shown in Fig. 2B also. There were 10, 52, and 785 genotype-specific phosphopeptides found for the wild type, ctr1-1, and rcn1-1, respectively (Fig. 2B). The number of genotype-specific phosphopeptides found in rcn1-1 was 78.5 and 15.1 times that in wild type Col-0 and ctr1-1, respectively. Such significant increases may result from notable differences in plant size (Fig. 1) or RCN1 phosphatase activity deficiency (45). Among the 1079 unique phosphopeptides, there were 1089 phosphosites. Among those, there were 1067 unique phosphosites on serine or threonine. Further bioinformatics analysis of amino acid sequences surrounding these 1067 unique phosphosites according to the substrate sequence specificity of Ser/Thr protein kinases (78) revealed that 21%, 19%, and 33% of the phosphorylated Ser/Thr phosphosite motifs were acidiphilic (p[S/T][D/E] or p[S/T]XX[D/E]), basophilic (RXXp[S/T]), and proline-directed (p[S/T]P) motifs, respectively (Fig. 2C). The ratio of basophilic to acidiphilic phosphorylation sites found in this study was 0.9 (Fig. 2C), which is 2.2-fold higher than that in PhosPhAT 4.0 (0.4; Fig. 2D). Notably, the proline-directed motif was nearly doubled (Figs. 2C and 2D). Because a large portion of the phosphorylated Ser/Thr (784 phosphosites) from our experiments had been reported previously in PhosPhAT 4.0, a similar analysis was performed on the overlapping portion of phosphopeptides. It was found that the ratio of basophilic to acidiphilic phosphorylation sites was still about 2-fold higher, and the sites were enriched in the proline-directed phosphosite motif (Fig. 2E).
Fig. 2.

Bioinformatic analysis of phosphopeptides from wild-type Arabidopsis and its ethylene response mutants. A, classification of the phosphopeptides based on the phosphosites identified in which. S, T, and Y represent phospho-Ser, phospho-Thr, and phospho-Tyr in a phosphopeptide, respectively. SS, TT, SY, and ST stand for doubly phosphorylated sites in a phosphopeptide, respectively. STY represents a triply phosphorylated phosphopeptide at three separate sites. The number of phosphopeptides in each class is labeled at the top of each bar. B, the phosphosites identified from Arabidopsis of different genotypes. The phosphosites found in all three genotypes, two genotypes, and the genotype-specific is displayed in cyan, white, and lime colored bars, respectively. The numbers of genotype-specific phosphosites are indicated at the top of the bars. C–E, classification of phosphorylation sites in four general amino acid sequence categories classified according to kinase specificity. The phosphorylation sites detected in this work (C), from PhosPhAt 4.0 (D), the overlapped of these two sets of data (E) were analyzed and classified. F–H, Gene Ontology analysis of the phosphoproteins identified from this work in three genotypes. F, molecular functions. G, biological processes. H, cellular components. In each category, the values presented are log2 ratios of percentages of phosphoproteins identified from three genotypes divided by the percentage of phosphoproteins of the whole phosphoproteome (see “Experimental Procedures” for details). Only parts of the bars of category 16 for the wild type and ctr1-1 are shown in panel H, because these two bars become infinitely negative (i.e. no protein detected in this category).
All these MS/MS-identified phosphopeptides were further validated with an in vitro kinase assay of 27 nonphosphorylated synthetic peptides linked with a polyhistidine tag (supplemental Table S2). These chemically synthesized peptides were randomly selected from the set of unique phosphopeptides and used as substrates in in vitro plant kinase assays according to an established protocol (25, 38). As a result, 16 His-tagged peptides were phosphorylated on the expected phosphosites (supplemental Table S2). Thus, 60% of randomly selected MS-identified phosphosites were further confirmed by the in vitro plant kinase assay.
To perform a bioinformatics-based differential phosphoproteomic analysis between the newly acquired unique phosphopeptides and those deposited in the PhosPhAt 4.0 database, we selected 627 repetitively detected phosphopeptides (i.e. those identified at least twice; supplemental Table S1) from the 1079 unique phosphopeptides and compared them with those in the PhosPhAt 4.0 database, in which a relatively stringent filter was defined to select the novel phosphopeptides detected. Considering the possible ambiguity in the assignment of phosphorylation sites based on MS/MS spectra, all phosphopeptides containing phosphosites deposited in PhosPhAt 4.0 were subtracted regardless of the actual position of Ser, Thr, or Tyr phosphorylation on the peptide. Afterward, the remaining phosphopeptides were examined based on the same criteria used in the PhosPhAt website, and those phosphopeptides collected after the release of PhosPhAt 4.0 were also manually removed. As a result, a total of 44 phosphopeptides were defined as novel phosphopeptides from this work (Table I). Among these novel phophopedtides, there were 33 rcn1-1-specific phosphopeptides (supplemental Table S3). This is a relatively larger portion of novel phosphopeptides found from rcn1-1, and it might be the result of a deficiency in dephosphorylation activities of PP2A in rcn1-1. Some of them probably serve as direct phosphoprotein substrates for Arabidopsis PP2A phosphatase, because some rcn1-1-specific phosphoproteins share a significant homology with those PP2A phosphatase substrates found from human cells (see supplemental Table S3 and the section below) (79).
Table I. Novel phosphopeptides identified.
| Accession number | Phosphopeptidea | Motif category | Protein | Subcellular location |
|---|---|---|---|---|
| Hydrolase activity | ||||
| AT1G22620 | 443ASQLSHANTAREPpSLR | Rxx[pS] | Suppressor of actin 1 (ATSAC1) | Golgi apparatus, nucleus |
| AT1G23240 | 1oxMSHQpTVALASK | Caleosin-related family protein | Extracellular region | |
| Kinase activity | ||||
| AT3G13530, AT3G07980 | 874,877ISLSANRTpSTDKLQK | MAP3K epsilon protein kinase 1/2 (MAP3KE1/E2) | Cytosol, plasma membrane, vacuole | |
| AT4G33240 | 1141NVpSLEKLSDEKVK | Rxx[pS] | Forms aploid and binucleate cells 1A (FAB1A) | Cytoplasm |
| Nucleic acid binding | ||||
| AT1G51140 | 276RPPLAHHMpSLPK | Flowering bHLH 3 (FBH3) | Nucleus | |
| AT1G58380, AT1G58983, AT1G59359, AT1G58684 | 270,270,270,270AVpSATKVITEGEDQA | XW6/ribosomal protein S5 family protein | Cell wall, chloroplast, intracellular, membrane, nucleus, plasma membrane, ribosome | |
| AT1G79950 | 106KSLGSFSpTR | [pT]xxD/E | RAD3-like DNA-binding helicase protein | Mitochondrion, nucleus |
| AT2G20280 | 358TSIQIREPNDEGSpS | Zinc finger C-x8-C-x5-C-x3-H type family protein | Cytoplasm | |
| AT2G41840 | 255FSRpSPYQEHTDFLASK | [pS]P | Ribosomal protein S5 family protein | Cytosol, intracellular, membrane, nucleolus, ribosome |
| AT3G07030 | 7VAKPKPEpSPINENEIR | [pS]P | Alba DNA/RNA-binding protein | Cytosol |
| AT4G35785 | 154pTPTPGHYLGLK | Rxx[pT]P | RNA-binding (RRM/RBD/RNP motifs) family protein | Nucleus |
| AT4G35785 | 154TPpTPGHYLGLK | Rxx[pT]P | RNA-binding (RRM/RBD/RNP motifs) family protein | Nucleus |
| Protein binding | ||||
| AT1G30280 | 48KFpSGDFSR | Rxx[pS] | Chaperone DnaJ-domain superfamily protein | Cytoplasm |
| AT2G16485 | 1274AIAPPELpSPR | [pS]P | Needed for RDR2-independent DNA methylation (NERD) | Cytosol, nucleus |
| AT3G53180 | 482LVPDLpSpTK | Nodulin/glutamine synthase-like protein (NODGS) | Cytoplasm, cytosol | |
| Other binding | ||||
| AT2G05100, AT2G05070, AT3G27690 | 40,40,41pTVKSTPQSIWYGPDRPK | Photosystem II light harvesting complex gene 2.1/2.2/2.3 (LHCB2.1/2.2/2.3) | Chloroplast, membrane, vacuolar membrane | |
| AT3G01500, AT5G14740 | 142,137EKYETNPALYGELAKGQpSPK | [pS]P | Carbonic anhydrase 1/2 (CA1/CA2) | Chloroplast, cytoplasm, cytosol, membrane |
| AT3G15290 | 285EATQKLpSPRL | [pS]P | 3-hydroxyacyl-CoA dehydrogenase family protein | Cytoplasm, peroxisome |
| AT5G66190 | 164LVYpTNDGGEIVK | Ferredoxin-NADP(+)-oxidoreductase 1 (FNR1) | Chloroplast | |
| Structural molecule activity | ||||
| AT3G60770, AT4G00100 | 20RSpSPSWLK | [pS]P | Ribosomal protein S13/S13A (RPS13/RPS13A) | Cell wall, chloroplast, cytosol, intracellular, membrane, nucleolus, ribosome |
| Transferase activity | ||||
| AT1G26850 | 111DpSoxMIYR | S-adenosyl-l-methionine-dependent methyltransferase superfamily protein | Golgi apparatus, membrane | |
| AT2G13360 | 31NNEDYRpSPAIPALTK | [pS]P | Alanine:glyoxylate aminotransferase (AGT) | Chloroplast, membrane, peroxisome, plasma membrane |
| Transporter activity | ||||
| AT1G75220 | 16RPFIHTGpSWYR | ERD6-like 6 (ERDL6) | Golgi apparatus, membrane, plant-type vacuole membrane, plasma membrane, vacuolar membrane | |
| AT1G62020, AT2G21390 | 358,358RPGpTPSLNQSPR | Rxx[pT]P | Coatomer, α subunit | Cytosol, intracellular, membrane, plasma membrane |
| AT4G33530 | 203IpSGFGLKVPSPELER | K+ uptake permease 5 (KUP5) | Membrane, plasma membrane, vacuolar membrane | |
| Unknown functions | ||||
| AT1G11110 | 162EpTFNFAEK | LisH and RanBPM domain-containing protein | Nucleus | |
| AT1G20890 | 45ETLPLKSGpSR | Unknown protein | ||
| AT1G35220 | 308LIDPSSVLHDKIGpSPR | [pS]P | Unknown protein | Nucleus |
| AT1G48550 | 290pSKLAKAQPK | Vacuolar protein sorting-associated protein 26 | Nucleus | |
| AT1G52100 | 249ApSPAIGKVTGSKFK | [pS]P | Mannose-binding lectin superfamily protein | Membrane |
| AT1G70100 | 97NApSFRPNIQNR | Rxx[pS] | Unknown protein | Nucleus |
| AT1G70180 | 224DIpSPPRDAGR | Rxx[pS]P | Sterile α motif (SAM) domain-containing protein | Nucleus |
| AT1G70180 | 182NAGSFIGIPREPpSPPR | Rxx[pS]P | Sterile α motif (SAM) domain-containing protein | Nucleus |
| AT3G50750, AT1G78700 | 33,25AIAAKIFpTGLR | BES1/BZR1 homolog 1/4 (BEH1/BEH4) | Nucleus, vacuole | |
| AT2G30105 | 165ISpSFGSMQK | Leucine-rich repeat | ||
| AT2G46180 | 319KLFPKpSTEDLSR | [pS]xxD/E | Golgin candidate 4 (GC4) | Golgi apparatus |
| AT3G08780 | 197GHYGSFpSPK | [pS]P | Unknown protein | Nucleus |
| AT3G58440 | 536LLFVDLEpSQLQK | TRAF-like superfamily protein | Cytoplasm | |
| AT3G60380 | 412KAEFFpSKK | [pS]xxD/E | Unknown protein | Nucleus |
| AT4G21930 | 90HVATpSAPVKVPDWSK | Protein of unknown function, DUF584 | Cellular component | |
| AT4G37210 | 478KPALEFSDKADGNpSS | Tetratricopeptide repeat (TPR)-like superfamily protein | Nucleus | |
| AT5G04550 | 347oxMGQpTPERPSISSVKK | [pT]P | Protein of unknown function (DUF668) | Nucleus |
| AT5G18590 | 16KVQLSDSVQGYKpSPLR | [pS]P | Galactose oxidase/kelch repeat superfamily protein | Cytosol, nucleus |
| AT5G63190 | 32SHTLFADLNIKpSPTGGK | [pS]P | MA3 domain-containing protein | Nucleus |
a The phosphorylated amino acids (Ser, Thr, or Tyr) are denoted by p, and oxidized Met is denoted by ox.
To determine the unique molecular and cellular functions and the subcellular locations of these newly identified phosphoproteins, gene ontology categories of phosphoproteins identified from the wild type (151 phosphoproteins), ctr1-1 (198 phosphoproteins), and rcn1-1 (639 phosphoproteins) were compared. The background for the comparison was the known phosphoproteome (2348 phosphoproteins) of light-grown Arabidopsis (>2 weeks old) deposited in the PhosPhAt 4.0 database (Figs. 2F–2H). The log2 change of each category presented in Figs. 2F–2H was calculated from the following equation:
 |
where ni and n′i represent the numbers of phosphoproteins belong to the ith category in a genotype-classified and Arabidopsis phosphoproteomes, respectively, and N and N′ are the total numbers of phosphoproteins in the genotype-classified and Arabidopsis phosphoproteomes, respectively. Comparative analysis of the phosphoproteins from three different genotypes and that of the light-grown Arabidopsis phosphoprotein data set in PhosPhAt 4.0 revealed several interesting findings (Figs. 2F–2H). Both ethylene-treated wild-type and ctr1-1 plants had relatively greater numbers of phosphoproteins in the categories of structure molecule activity (2.30- and 1.98-fold, respectively), nucleic acid (2.14- and 2.06-fold, respectively), protein binding (1.78- and 1.74-fold, respectively), and DNA and RNA binding (1.40- and 1.35-fold, respectively) (Fig. 2F) yet had reduced numbers of phosphoproteins in hydrolase (−1.39- and −1.28-fold, respectively), kinase (−1.92- and −1.60-fold, respectively), and transferase activities (−2.65- and −1.99-fold, respectively) (Fig. 2F). In contrast, phosphoproteins from rcn1-1 enriched in kinase (1.64-fold) and transferase (1.25-fold) and had fewer phosphoproteins in the functions of nucleic acid binding (1.07-fold) than the ethylene-treated wild type (2.14-fold) and ctr1-1 (2.06-fold). Other than that, in all three genotypes of Arabidopsis, phosphoproteins functioning in electron transport or energy pathways (1.81- to 3.76-fold; Fig. 2G) and ribosome localization (1.82- to 2.69-fold; Fig. 2H) or cytosol localization (1.79- to 2.48-fold; Fig. 2H) were much more abundant, and those phosphoproteins relatively less represented were in the categories of DNA or RNA metabolism (−1.40- to −1.91-fold; Fig. 2G) and ER (−1.94- to −4.81-fold; Fig. 2H). The fact that the proportion of proteins functioning in nucleic acid binding increased in both the wild type (2.14-fold) and ctr1-1 mutant (2.06-fold) but not in rcn1-1 mutant (1.07-fold) (Fig. 2F) is quite consistent with the fact that the proportion of phosphoproteins in both transcription and DNA-dependent categories is 1.5-fold in wild type, 1.2-fold in ctr1-1, and 1.1-fold in rcn1-1 (Fig. 2G). A more interesting finding is that the dramatic increase in the categories of kinase activity and transferase activity occurred in rcn1-1 (1.64- and 1.25-fold, respectively) (Fig. 2F); this is consistent with the fact that the phosphoproteins from rcn1-1 are also overrepresented in signal transduction.
Identification of Phosphosites in Short-term Ethylene-treated rcn1-1 and Long-term Ethylene-treated Wild-type/ctr1-1 Arabidopsis
The effects of ethylene on plants have been reported as time dependent (20, 23, 24). To elucidate the molecular basis underlying such a time-dependent ethylene response, SILIA-based quantitative phosphoproteomic analysis was first performed on rcn1-1 to investigate the rapid change in phosphorylation caused by a short-term (1 min) ethylene treatment, because rcn1-1 has been reported to be overly ethylene sensitive (44) and may protect some phosphosites from dephosphorylation because of deficiency in PP2A phosphatase activity. Out of 627 repetitively identified nonredundant phosphopeptides (supplemental Table S1), 595 phosphopeptides were detected in rcn1-1, and 138 phosphopeptides were selected from these for quantitative phosphoproteomic analysis. The criteria for selecting these measurable phosphopeptides were as follows: (1) they were detected in both forward and reciprocal experiments, (2) they were found in both 14N- and 15N-coded phosphopeptide isoforms, and (3) they were detected at least three times. Lastly, the light (14N-coded) and heavy (15N-coded) phosphopeptide isotopic envelopes were measured only after the MS spectrum of each phosphopeptide was verified by means of manual spectrum inspection and all MS spectra of overlapping noise ion(s) had been removed. As a result, 138 nonredundant phosphopeptides were selected for quantification, each of which was supported by 2 to 27 pairs of MS ion peaks.
Because light and heavy isoforms of a phosphopeptide produce distinct isotopic envelopes, the ratios of twin isotopic envelopes of each peptide were calculated based on the extracted ion chromatograms of monoisotopic peaks and the isotopologue distribution (48). For all nonredundant phosphopeptides quantified, each pair of MS ion peaks yielded a ratio, and a two-tailed t test (p < 0.05) was performed on the measurement of each nonredundant phosphopeptide to determine the statistical significance. In the rcn1-1 experiment, 17 out of 138 phosphopeptides that were quantified according to this method showed a statistically significant difference between 1-min ethylene-treated and air-treated samples (supplemental Table S4). The quantified phosphopeptides were further fitted using a normal distribution. Those phosphopeptides whose average variance was more than the mean ± 2 S.D. outside of the normal distribution were considered as significantly altered phosphopeptides (Figs. 3A–3C; supplemental Figs. S4A and S4B). As a result, three ethylene-enhanced and three ethylene-suppressed phosphopeptides were found from the 1-min ethylene-treated rcn1-1 mutant (Table II, supplemental Figs. S5 and S6).
Fig. 3.

SILIA-based quantitative and differential phosphoproteomic analysis of ethylene-treated Arabidopsis wild type and ethylene response mutants. A and D, quantitative analysis of 1-min ethylene-regulated phosphoproteome in rcn1-1 mutant, which lost the functional A regulatory subunit RCN1 of PP2A protein phosphatase (A), and a long-term ethylene-regulated phosphoproteome in both the wild type (wt) and ctr1-1, loss-of-function of CTR1 protein, which encodes a Raf-like kinase of the MAPKKK family (D). Each dot represents the average ratio of the peptide amount of a certain phosphopeptide identified from either the ethylene-treated to air control rcn1-1 (A) or the wild type to ctr1-1 (D). The phosphopeptides of statistical significance defined via t test are highlighted in red. The dashed lines delineate the mean ± 2 S.D. of the distribution. B and E, histograms of phosphopetides from A and D, respectively, fitted using a normal distribution (red curve). The dashed lines demarcate the mean ± 2 S.D. of the distribution of the log2 ratio of phosphopeptide ion intensities. C and F, MS spectra of 1-min ethylene-up-regulated, -independent, and -down-regulated phosphopeptides in rcn1-1 and the MS spectra of long-term ethylene-treated and CTR1-up-regulated, -independent, and -down-regulated phosphopeptides. “Forward” and “reciprocal” refer to the order of mixing of 15N-coded proteins with 14N-coded protein samples (see “Experimental Procedures”). E and A, the isotopologues of an identical phosphopeptide ion derived from ethylene-treated and air-treated rcn1-1 protein samples, respectively (C). “W” and “C” indicate isotopologues of an identical phosphopeptide ion derived from wild-type and ctr1-1 mutant plant protein samples, respectively (F). “M/z” represents the ratio of the ion mass to the charge of each phosphopeptide. p marks the amino acid type at a phosphosite.
Table II. Phosphopeptides affected by 1-min ethylene treatment in rcn1-1.
| Accession number | Fold-changea | p valueb | Phosphopeptidec | Motif category | Protein | Subcellular location |
|---|---|---|---|---|---|---|
| Ethylene enhanced | ||||||
| AT2G02070 | 1.15 | 3.16E-02 | 60TPNSDAEVIALpSPK | [pS]P | Indeterminate-domain 5 (IDD5) | Intracellular, nucleus |
| AT2G18960 | 1.14 | 3.12E-02 | 937GLDIDTAGHHYpTV | H+-ATPase 1 (AHA1) | Golgi apparatus, membrane, nucleus, plasma membrane, vacuole | |
| AT1G20693, AT1G20696 | 1.10 | 7.41E-03 | 79,76SLpSDSEKAPYVAK | [pS]D/E | High mobility group B2/3 (HMGB2/3) | Nucleus |
| Ethylene suppressed | ||||||
| AT1G07650 | −1.27 | 1.17E-02 | 987SLpSFSTSGPR | Rxx[pS] | Leucine-rich repeat transmembrane protein kinase | Plasma membrane |
| AT1G70730, AT1G23190 | −1.12 | 9.09E-03 | 115,114ATGAFILTApSHNPGGPTEDFGIK | Phosphoglucomutase 2/3 (PGM2/3) | Chloroplast, cytoplasm, cytosol, nucleus, plasma membrane | |
| AT5G52040 | −1.12 | 7.63E-04 | 270GEpSRpSPPPYEKR | Rxx[pS], [pS]P | Arginine/serine-rich splicing factor 41 (ATRSP41) | Nucleus |
a The two values in bold are those selected for in vitro phosphorylation assays.
b Given by two-tailed Student's t-test. All phosphopeptides listed were selected using two-tailed Student's t-test (p < 0.05).
c The phosphorylated amino acids (Ser, Thr, or Tyr) are marked by p.
Interestingly, the ethylene-induced alteration in phosphorylation level can be found on proteins ranging from plasma-membrane-bound leucine-rich repeat transmembrane protein kinase to nucleus-localized RNA-binding protein arginine/serine-rich splicing factor 41 (ATRSP41, AT5G52040). The phosphorylation level of 937GLDIDTAGHHYpTV derived from H+-ATPase 1 (AHA1, AT2G18960) was rapidly induced by ethylene. This protein is crucial in many processes such as nutrient uptake, cell elongation, pH homeostasis, stomatal movement, and salt tolerance (80). The phosphorylation of the conserved T948 residue at the C terminus modulates the enzymatic activity of proton pumps by either inducing or inhibiting association with 14–3-3 proteins (81). Thus, the altered phosphorylation level that we found may suggest a signaling pathway from ethylene to the inhibition of cell elongation via AHA1. Moreover, the phosphorylation level of high mobility group B2/3 (HMGB2/3, AT1G20693/AT1G20696) is up-regulated by ethylene within 1 min of ethylene induction. Previous research showed that both hydrophobic properties and negative charge determine the binding of proteins from this group to DNA (82, 83). In addition, protein sequence alignment shows that both hydrophobic and negatively charged residue surrounding the phosphorylation site are alternately allocated, and phosphorylated serine can contribute one extra negatively charged side chain and mimic aspartic acid (D) in DNA binding. Therefore, the conformational change resulting from the phosphorylation of serine on HMG proteins may result in enhanced stability and DNA-binding specificity for these proteins. Another interesting feature of HMGB proteins is that the phosphorylated sequence may possess a combinational code for functional modulation (84). Some of these combinations of PTMs will lead to higher residence in transcriptionally inactive heterochromatin.
To further confirm the significantly changed phosphorylation levels found via quantitative phosphoproteomic analysis on rcn1-1 phosphoproteins, additional validations were performed in which a slightly ethylene-enhanced phosphospeptide, 79,76SLpSDSEKAPYVAK (derived from HMGB2/B3), and a slightly ethylene-suppressed phosphopeptide, 270GEpSRpSPPPYEKR (derived from ATRSP41), were selected for time course measurements of dynamic change in response to ethylene treatment. To that end, these two His-tagged and nonphosphorylated synthetic peptides were subjected to the in vitro plant kinase assay as described (25, 38). As a result, both S81 of HMGB2 (S78 of HMGB3) and S274 of ATRSP41 were phosphorylated as expected by rcn1-1 kinase(s) (Figs. 4A–4D). To confirm such time-dependent phosphorylation on these phosphosites occurring within first 15 min of ethylene treatment, iTRAQ-based quantitative phosphoproteomics was employed to measure the phosphorylation levels of these two sites over a short period of time. Four groups of adult rcn1-1 Arabidopsis plants were treated with ethylene for 0, 1, 5, and 15 min, respectively, before being harvested. The plant kinases were then extracted and mixed with differentially isobaric tag-labeled synthetic peptides (25). As shown in Figs. 4E and 4F, the phosphorylation of S81 of HMBG2 (or S78 of HMBG3) and S274 of ATRSP41 was indeed up- and down-regulated, respectively, by a few minutes of ethylene treatment in rcn1-1. The phosphorylation level of the HMBG site changed to 172.3% ± 17.3%, 183.7% ± 30.9%, and 149.4% ± 11.5%, respectively, at 1, 5, and 15 min of ethylene treatment (supplemental Fig. S7). In contrast, the phosphorylation of S274 of ATRSP41 decreased to 99.4% ± 8.6%, 82.6% ± 3.1%, and 44.7% ± 7.6%, respectively, at 1, 5, and 15 min of ethylene treatment (supplemental Fig. S7). These phosphorylation changes are presented as a function of ethylene treatment time for both ethylene early responsive phosphopeptides (Figs. 4E and 4F). The trend of altered phosphorylation of these phosphosites measured by iTRAQ within 5 to 15 min is the same as that detected via SILIA-based quantitative phosphoproteomics at 1 min of induction. Thus, it is concluded that metabolic labeling-based quantitative phosphoproteomics is more suitable for identifying phosphorylation alterations occurring within 1 min of induction, whereas iTRAQ may be suitable for the multiplex quantitation of phosphopeptides collected from multiple time points simultaneously. Our results also showed that ethylene-triggered phosphorylation alteration quickly occurs on both plasma-membrane-bound and nucleus-localized nucleotide-binding proteins within a few minutes of induction.
Fig. 4.
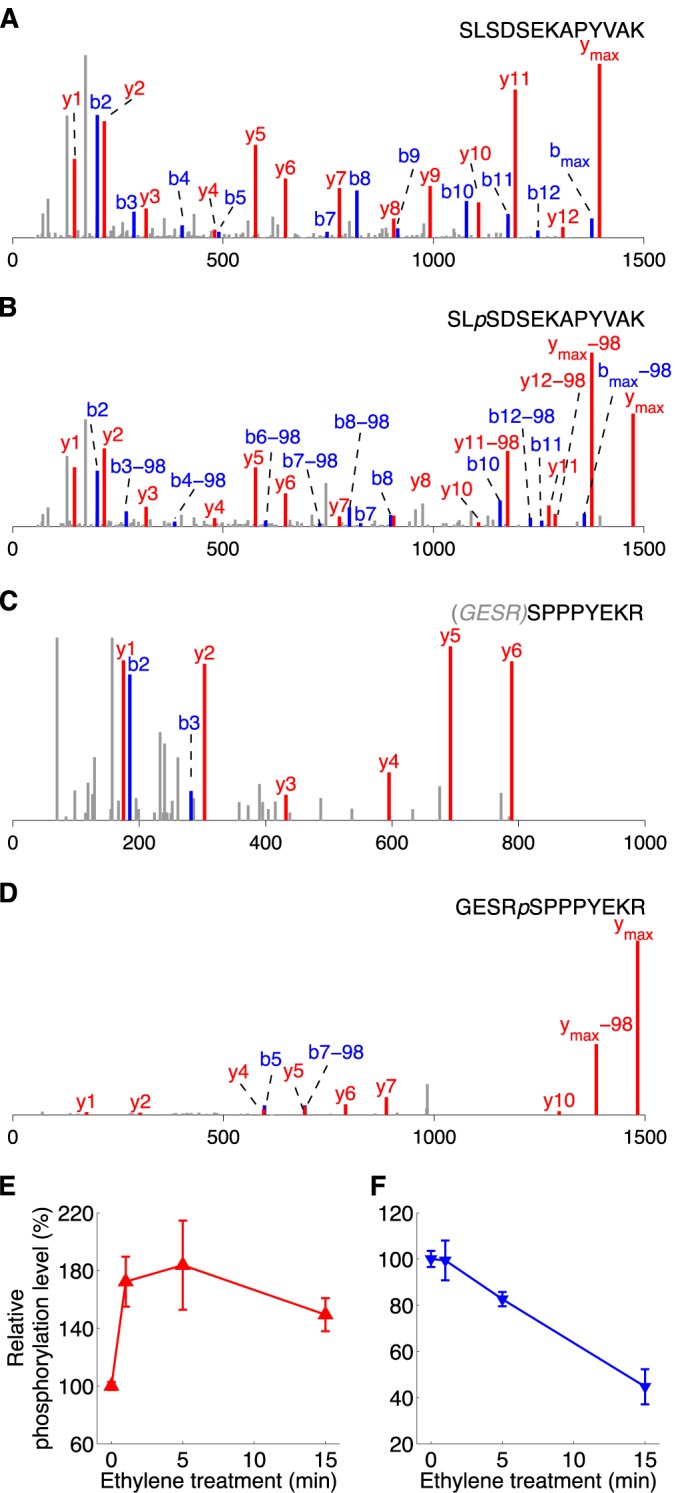
Validation of phosphosites using in vitro plant kinase assay. A and B, the MS/MS spectra of a synthetic peptide SLSDSEKAPYVAK and its phosphorylated isoform at the S3 position, respectively. C and D, the MS/MS spectra of another synthetic peptide, GESRSPPPYEKR, and its phosphorylated isoform at the S5 position, respectively. The gray letters in brackets denote the residues digested from the synthetic peptide. E and F, the time course of ethylene-regulated in vitro kinase activities of rcn1-1. The x-axis indicates the duration (in minutes) of the ethylene treatment. The phosphorylation level of phosphopeptides marked along the y-axis was determined according to the iTRAQ method (38), and the relative phosphorylation levels were calculated versus the intensity of a reporter ion from 0-min ethylene-treated samples (see “Experimental Procedures” for details). The deviation at each time point represents the average of three to five individual experimental results. The synthetic substrate peptides used for iTRAQ-based relative phosphorylation quantification were 79,76SLSDSEKAPYVAK (E) derived from high mobility group B2/3 protein (AT1G20693/AT1G20696) and 270GESRSPPPYEKR (F) derived from arginine/serine-rich splicing factor 41 (AT5G52040).
The CTR1 gene has been defined as a negative regulator of ethylene response in Arabidopsis according to molecular genetic results because the recessive and loss-of-function mutant ctr1-1 exhibits constitutive ethylene-treated phenotypes (equivalent to a long-term ethylene treatment) in the absence of external ethylene gas in both seedling and adult plant stages (6). This gene encodes a homolog of the Raf-like family of protein kinases and a member of the plant MAPKKK family (6). This MAPKKK enzyme interacts with the ethylene receptor complex. Such an interaction may be involved in the conversion of CTR1 kinase into a dimeric and active conformation (9, 10). Ethylene is therefore postulated to inactivate the kinase activity of CTR1 and dissociate it from ethylene receptor complexes, leading to the plant ethylene response. To determine whether CTR1 MAPKKK still has protein phosphorylation activities under ethylene treatment and whether there are other direct and indirect protein substrates (in addition to EIN2) for CTR1 kinase, SILIA-based quantitative and differential phosphoproteomics were performed simultaneously on both wild-type and ctr1-1 plants under long-term ethylene treatment. In this experimental design, the sole difference between ethylene-treated wild-type plants and ctr1-1 is the CTR1 kinase. In the wild-type Arabidopsis, CTR1 kinase is still physically present in plant cells under ethylene treatment, but CTR1's kinase activity is unknown. In contrast, in the ctr1-1 mutant, CTR1 (MAPKKK) kinase activity is completely lost. Differential and quantitative phosphoproteomic analyses of these plants grown under long-term ethylene treatment revealed 70 nonredundant measurable phosphopeptides, and each of them was supported by 2 to 21 pairs of MS ion peaks. Out of the quantified 70 phosphopeptides, there was a statistically significant difference between Col-0 and ctr1-1 samples for 17 (supplemental Table S5). All phosphopeptides quantified were fitted using a normal distribution. The mean ± 2 S.D. of the normal distribution was used for the selection of CTR1-regulated phosphopeptides (Figs. 3D–3F; supplemental Figs. S4C and S4D). Eventually, it was found that the phosphorylation levels of six phosphopeptides were indeed up-regulated and those of two phosphopeptides were down-regulated by the CTR1 gene under constant ethylene exposure (Table III, supplemental Figs. S8 and S9).
Table III. CTR1 gene-regulated phosphopeptides.
| Accession number | Fold-change | p valuea | Phosphopeptideb | Motif category | Protein | Subcellular location |
|---|---|---|---|---|---|---|
| CTR1 enhanced | ||||||
| AT3G46780 | 1.77 | 4.06E-03 | 447VQVApTVR | Plastid transcriptionally active 16 (PTAC16) | Chloroplast, membrane | |
| AT5G23060 | 1.73 | 3.08E-10 | 378pSGTKFLPSSD | Calcium sensing receptor (CaS) | Chloroplast, mitochondrion | |
| AT1G29920, AT1G29910, AT1G29930, AT2G34430, AT2G34420 | 1.71 | 2.05E-04 | 44,44,44,43,42GPSGpSPWYGSDRVK | [pS]P | Light harvesting chlorophyll A/B binding protein 1.1/1.2/1.3/1.4/1.5 (LHCB1.1/1.2/1.3/1.4/1.5) | Chloroplast, membrane, mitochondrion |
| AT1G64500 | 1.61 | 2.04E-02 | 112KSApSFHTLDELEVR | Glutaredoxin family protein | Nucleus | |
| AT1G29920, AT1G29910, AT1G29930, AT2G34430, AT2G34420 | 1.60 | 3.62E-03 | 44,44,44,43,42GPSGSPWYGpSDRVK | [pS]D/E | Light harvesting chlorophyll A/B binding protein 1.1/1.2/1.3/1.4/1.5 (LHCB1.1/1.2/1.3/1.4/1.5) | Chloroplast, membrane, mitochondrion |
| AT2G42600, AT3G14940, AT3G42628 | 1.54 | 1.79E-02 | 9,9,9oxMApSIDAQLR | PEP carboxylase 2/3 (PPC2/3)/PEP carboxylase-related | Chloroplast, cytoplasm, cytosol, plasma membrane | |
| CTR1 suppressed | ||||||
| AT3G53420, AT2G37170, AT2G37180 | −1.82 | 2.64E-03 | 277,275,275SLGpSFRpSAANV | Plasma membrane intrinsic protein 2A/B/C (PIP2A/B/C) | Chloroplast, membrane, plasma membrane, vacuole | |
| AT3G22850 | −1.42 | 8.53E-03 | 238VGpSVQNWSK | Rxx[pS] | Aluminum induced protein with YGL and LRDR motifs | Cytoplasm, cytosol, nucleus, plasma membrane |
Note: Both wild-type and ctr1-1 mutant Arabidopsis were grown in the presence of ACC.
a Given by two-tailed Student's t test. All phosphopeptides listed were selected using two-tailed Student's t test (p < 0.05).
b The phosphorylated amino acids (Ser, Thr, or Tyr) are denoted by p, and oxidized Met is denoted by ox.
Because both wild-type Arabidopsis and ctr1-1 were treated with a higher dose of ethylene (10 ppm), the differential phosphoproteome subtraction between Col-0 and ctr1-1 is believed to have subtracted the phosphorylation differences resulting from receptor histidine and serine/threonine kinase activities and other unknown kinase activities and to have provided informative results on the putative direct or indirect substrates for CTR1 MAPKKK under the influence of constant ethylene exposure. In particular, using the loss-of-function mutant ctr1-1 as a genetic background, the long-term ethylene-treated wild-type Arabidopsis accumulates in parallel phosphorylation at the T451 site of plastid transcriptionally active 16 (PTAC16, AT3G46780) protein, suggesting that the CTR1 kinase in the wild-type plant may use PTAC16 as a putative (either direct or indirect) downstream substrate under ethylene treatment. This result implies that CTR1 protein may be active under ethylene treatment, or at least partially active, as a kinase. Recent study has shown that phosphorylation at T451 of PTAC16 is thylakoid protein state transition 7 (STN7) kinase dependent and is excluded from the nucleoid (85). Chloroplast STN7 kinase, which is required for state transitions between photosystem I and photosystem II and for light adaptation, is one of the two light-regulated protein kinases (86). However, neither STN7 nor STN8 (the other light-regulated protein kinase in Arabidopsis) is required for the phosphorylation of S48, S47, or S46 on light harvesting chlorophyll A/B binding proteins 1.1–1.5 (LHCB1.1–1.5, AT1G29920/AT1G29910/AT1G29930/AT2G34430/AT2G34420) (85). Taken together, these data suggest that it is possible that the physical presence of wild-type CTR1 kinase may be required for the up-regulation of PTAC16, STN7, and LHCB protein phosphorylation upon ethylene induction.
However, the presence of CTR1 protein in Arabidopsis cells may suppress the phosphorylation of some proteins under ethylene treatment (Table III). For example, the fact that a 1.82-fold increase in the phosphorylation level of SLGpSFRpSAANV derived from plasma membrane intrinsic protein 2A (PIP2A, AT3G53420) resulted from the physical absence of CTR1 protein in the ctr1-1 plant under ethylene treatment indicates that CTR1 kinase may indirectly suppress the phosphorylation of PIP2A water channel protein via either enzyme activity or protein interaction. It is possible that ethylene regulates water channel activities via CTR1 kinase-independent phosphorylation of S280 and S283 sites of PIP2A.
Construction of Ethylene Signaling Network with Bioinformatics and GPS
Molecular evidence has shown that ethylene-triggered phosphor-relay in Arabidopsis cells may be achieved via multiple pathways (36–39). These newly identified and ethylene-regulated phosphoproteins may constitute an additional network of components in molecular signaling. Therefore, several bioinformatics methods were integrated in order to establish a novel workflow for the construction of an ethylene-regulated phosphor-relay network.
Because of the intrinsic limitations of mass spectrometry measurement, an exhaustive and complete phosphoproteomic analysis is difficult to achieve on an organism (87, 88). For this reason, we performed BLAST-based phosphosite motif mining (38, 89) on these short-ethylene-exposure and CTR1-regulated phosphopeptides in order to discover more ethylene-regulated phosphosites, as we have done before (25). As a result, we finally constructed several conserved phosphorylation motifs containing putative ethylene-regulated phosphosites (Fig. 5). A total of 10 highly conserved phosphorylation motifs were found, of which 5 were from 1-min ethylene-exposure-treated rcn1-1 and 5 were from from a proteomics study of ethylene-treated wild-type/ctr1-1. Figs. 5A and 5B show two and three ethylene-induced and -repressed phosphosite motifs, respectively. Figs. 5C and 5D show 4 and 1 CTR1-enhanced and -repressed motifs, respectively. In total, we found 45 bioinformatics-derived putative ethylene-regulated phosphopeptides. As a result of this homology-based alignment approach, some phosphoproteins of interest that are difficult to detect via MS were chosen for further functional analysis (25, 36), and both MS- and bioinformatics-derived ethylene-regulated phosphosites were used for the construction of a phosphor-relay network (Figs. 6A and 6B).
Fig. 5.

Construction of CTR1- and ethylene-regulated phosphorylation motifs. Sequence alignment of short segments of phosphoproteins harboring the newly identified phosphopeptides that are specific to both ethylene and CTR1 regulation. Alignment was performed using ClautalW. Arabidopsis Information Resource identification and annotations are marked on the right-hand side of each phosphosite motif. Asterisks (*) denote the conserved phosphorylation sites in each motif. A and B, the conserved phosphorylation motifs built from one-minute ethylene-up-regulated and -down-regulated phosphopeptides, respectively. C and D, the conserved phosphorylation motifs built from CTR1-enhanced and CTR1-suppressed phosphopeptides under long-term ethylene regulation, respectively. In each motif, the MS-derived authentic phosphopeptide is placed at the top of the amino acid sequence alignment, and the rest are the putative phosphoprotein sequences deposited in the TAIR10 database.
Fig. 6.

Bioinformatic analysis of ethylene signaling-related kinase-substrates networks. A, phosphoproteins up- or down-regulated by ethylene and the putative kinases involved in the early stage (1 min) of ethylene-regulated protein phosphorylation. B, phosphoproteins up- or down-regulated by CTR1 MAPKKK in the presence of ethylene and the putative kinases involved in ethylene- and CTR1 kinase-regulated protein phosphorylation. C, prediction of putative substrates of PP2A. Green box: PP2A; green circle: CTR1 kinase; red octagons: authentic positively regulated substrates; pink octagons: predicted positively regulated substrates; gray ellipses: authentic negatively regulated substrates; violet ellipses: predicted negatively regulated substrates; peach circles: kinases found from the literature; lime circles: kinases predicted by GPS; dashed lines with arrows: putative positive regulation; dashed lines with stop ends: putative negative regulation; solid lines with arrows: kinase phosphorylation reported in the literature; double lines with arrows: direct kinase phosphorylation predicted by GPS; separated arrows: authentic positive regulation; separated stops ends: authentic negative regulation.
Although few substrates for plant PP2A are known, a phosphatase–substrate interaction network has recently been reconstructed in human cells (79), and PP2A is a highly conserved phosphatase across species. Thus, applying the same alignment strategy, a segment of polypeptides (±50 amino acids) surrounding the rcn1-1-specific phosphorylation sites (supplemental Table S3) was searched against the human genome using BLAST software. Eventually, nine Arabidopsis homologs of human PP2A phosphatase-interacting proteins were found (supplemental Table S3). These homologs are considered as putative substrates of Arabidopsis PP2A phosphatase (Fig. 6C).
Furthermore, in order to identify those kinases/phosphatases responsible for phosphorylating/dephosphorylating ethylene-regulated phosphosites (Tables II and III; Fig. 5), two bioinformatics methods were employed. One was a literature-based kinase search, and the other was a GPS-based kinase search. For example, it was found that the phosphorylation of T451 of PTAC16 is STN7 kinase dependent (85). Thus, ethylene signaling from CTR1 to PTAC16 may be transduced through STN7 kinase, as the phosphorylation of T451 requires STN7 kinase activities exclusively. As another example, it was also reported in the literature that Arabidopsis HMGB2 and HMGB3 are phosphorylated by casein kinase 2α of maize. As Arabidopsis casein kinase 2α shares 86% amino acid sequence identity with Arabidopsis, Arabidopsis HMGB2/3 proteins may be phosphorylated by Arabidopsis casein kinase 2α (90).
For GPS (60) identification of upstream kinases for these ethylene-regulated phoshosites, we first obtained 1056 Arabidopsis kinase sequences from our newly developed database, the Eukaryotic Kinase and Phosphatase Database, because classification information on plant kinases was not included in GPS 2.1 (60). As previously described (69, 70), these Arabidopsis kinases were preclassified into a hierarchical structure with four levels (group, family, subfamily, and single protein kinase) (supplemental Table S6A) with the identification of preconstructed hidden Markov model profiles. Based on the hypothesis that kinases in the same group, family, or subfamily would recognize similar patterns/motifs in substrates for modification, the corresponding predictor in GPS 2.1 was assigned for each Arabidopsis kinase if available (see “Experimental Procedures”) (60). In the end, 932 kinases were selected with GPS predictors (supplemental Table S6B). Each ethylene-regulated phosphosite was analyzed with GPS 2.1, and the default threshold (medium) (60) was chosen with false positive rates of 6% and 9% for serine/threonine kinases and tyrosine kinases, respectively. The site-specific kinase–substrate relations were then determined based on the kinase-predictor mapping list (supplemental Table S6A) and further filtered using the existing PPI databases to reduce false positive predictions (see “Experimental Procedures”). As a result, a total of 23,674 experimentally identified PPIs and 717,810 predicted PPIs in Arabidopsis were taken from online databases (supplemental Table S6B; see “Experimental Procedures”). A predicted site-specific kinase–substrate relation was accepted only if the relationship between kinase and substrate was supported by either experimental results or predicted PPIs.
A total of 14 site-specific kinase–substrate relations covering 11 kinases and 11 phosphosites on 10 substrate proteins were eventually predicted (supplemental Table S6C, Fig. 6). Firstly, in the case of the ethylene-regulated phosphosites detected from rcn1-1 mutant, calmodulin-binding receptor-like cytoplasmic kinase 2 (AT4G00330) was predicted as a protein kinase modifying leucine-rich repeat transmembrane protein kinase AT1G07650 (see Fig. 6A). Secondly, in the ctr1-1 experiment, the CTR1 up-regulated phosphorylated α/β-hydrolase superfamily protein AT5G38520 was predicted as a substrate of a protein kinase superfamily protein AT1G54820, LHCB1.1 and LHCB 1.5 as substrates of protein kinase 2B (APK2B, AT2G02800), glutaredoxin family protein AT1G64500 as a substrate of both SNF1-related protein kinase 2C (AT1G78290) and CBL-interacting protein kinase 1 (CIPK1, AT3G17510), PIP2A as a substrate of altered seed germination 5 protein kinase (ASG5, AT1G20650), and finally PIP3 (AT4G35100) as a substrate of D6 protein kinase (AT5G55910) (see Fig. 6B). Lastly, in the case of the putative substrates of PP2A phosphatase obtained from homologous alignment, both octicosapeptide/Phox/Bem1p domain superfamily protein kinase AT5G57610 and calmodulin-domain protein kinase 9 (AT3G20410) were predicted as protein kinases that modify the flowering bHLH 3 protein (FBH3, AT1G51140). In addition, both cyclin-dependent kinase B1 (AT3G54180) and inflorescence meristem receptor-like kinase 2 (AT3G51740) were predicted as protein kinases modifying ribosomal protein S13 (AT3G60770), and the inflorescence meristem receptor-like kinase 2 was also predicted as a protein kinase modifying tetratricopeptide repeat-like superfamily protein AT4G37210 (see Fig. 6C).
The cascades of enzyme–substrate relationships defined by the GPS predictor were further substantiated by data presented in the literature. The previous work has already revealed that more than half of the predicted kinases are regulated by ethylene (35). Calmodulin-binding receptor-like cytoplasmic kinase 2 (kinase of leucine-rich repeat transmembrane protein kinase AT1G07650), SNF1-related protein kinase 2C (kinase of glutaredoxin family protein AT1G64500), and calmodulin-domain protein kinase 9 (kinase of FBH3) are enhanced by ethylene, and protein kinase superfamily protein AT1G54820 (kinase of α/β-hydrolase superfamily protein AT5G38520), CIPK1 (kinase of glutaredoxin family protein AT1G64500), ASG5 (kinase of PIP2A), and inflorescence meristem receptor-like kinase 2 (kinase of RPS13 and tetratricopeptide repeat-like superfamily protein AT4G37210) are suppressed by ethylene (35). Interestingly, FBH3 is also a putative PP2A phosphatase substrate as determined by this work (supplemental Table S3). Thus, calmodulin-domain protein kinase 9 and PP2A may constitute a modifying/demodifying enzyme pair that regulates the phosphorylation of FBH3 in an antagonistic fashion. Furthermore, the glutaredoxin family protein AT1G64500 may be directly phosphorylated by CIPK1 according to the GPS predictor. Interestingly, the expression of CIPK1 happens to be regulated by CTR1 (91). In our quantitative phosphoproteomics experiment on ethylene-treated wild-type/ctr1-1 pairs, CTR1 was found to enhance the phosphorylation of glutaredoxin family protein AT1G64500 (Fig. 6B, Table III). It is therefore likely that CTR1 may regulate the phosphorylation of glutaredoxin family protein AT1G64500 by regulating CIPK1.
In short, via the application of both GPS predictor analysis and bioinformatics analysis of rapidly ethylene-regulated and CTR1-regulated phosphoproteins, we have established several ethylene-signaling networks that have not been reported in the literature previously (Fig. 6). The integration of quantitative phosphoproteomics and PPI GPS prediction is able to provide useful information for directing the future functional validation of these phosphoproteins and kinases in the context of cell signaling.
DISCUSSION
In vivo stable isotope metabolic labeling, especially heavy nitrogen (15N) labeling, has been successfully applied to characterize PTMs in various organisms (66, 92, 93). Given the availability of a huge collection of Arabidopsis mutant lines, we chose to apply 15N stable isotope metabolic labeling-based quantitative PTM proteomics to analyze two highly selected and well-characterized ethylene response mutants, ctr1-1 and rcn1-1 (or eer1-1), to identify phosphorylation events induced by both short-term and long-term ethylene treatment. Ethylene was found to quickly trigger phosphorylation alteration of proteins located in various cellular compartments ranging from the cytosol to the nucleus (Table II). The 1-min ethylene-induced protein phosphorylation profile is dramatically different from that resulting from constant ethylene treatment of the wild type and ctr1-1 (Table III). The successful identification of novel rapidly ethylene-induced phosphosites may be attributed to the SILIA-based quantitative phosphoproteomic approach (48), in which all protein molecules including proteases and phosphatases are instantly denatured by a high concentration of urea (8 m) once the frozen cells are dissolved into the protein isolation solution. A second contributor to this success was the use of a mutant defective in phosphatase (PP2A) activity. The application of quantitative phosphoproteomics on various phosphatase-deficient Arabidopsis mutants may become a powerful way to profile more novel phosphosites and contribute to the establishment of phosphor-relay-mediated signaling networks in Arabidopsis, especially given that Arabidopsis contains more than 150 phosphatases (94). The usefulness of this approach is further confirmed by the identification of several putative substrates for PP2A from the integration of quantitative phosphoproteomic and bioinformatic analysis (supplemental Table S3). Lastly, the success may be attributed to the employment of the stable isotope metabolic labeling strategy. Given that the total amount of cellular proteins is similar in each pair of plant tissues (air- versus ethylene-treated rcn1-1 and ethylene-treated wild type versus ctr1-1), this 15N metabolic labeling technique emphasizes the mixing of two differentially labeled total cellular proteins at the initial step, which allows targeted proteins 14N/15N differentially coded under two separate physiological conditions to go through identical protein separation, peptide generation and isolation, peptide ionization, and ion intensity quantification processes so that variations occurring from each step mentioned above are eliminated, unlike with the iTRAQ technique (36, 58, 59).
Molecular genetics and biochemical data have demonstrated that both ethylene response 1 and ethylene response sensor 1 physically interact with CTR1 kinase, and these interactions are required in ethylene signaling (9, 10). Once an ethylene receptor–CTR1 kinase complex interacts with ethylene, its signal is transduced downstream through altered kinase activities and phosphor-relay to other signaling components. However, the finding that CTR1 kinase interacts separately with both ethylene receptor and EIN2 and consequently phosphorylates EIN2 (11, 12) to inactivate the central positive regulator of ethylene responses still does not explain how the ethylene receptor–CTR1 kinase complex physically transduces the ethylene binding of receptor complexes to both histidine (or aspartic acid) kinase activity of the receptor and serine/threonine kinase activity of CTR1, because it is still uncertain how many ethylene receptor–CTR1 kinase complex-dependent substrates are present in plant cells. The physical association of Arabidopsis PP2A with the kinase domain of CTR1 in vitro has further complicated the mode of action of ethylene receptor–CTR1 kinase complexes. It has been hypothesized that the increased sensitivity and amplitude of plant responses to ethylene observed in the rcn1 (or eer1-1) loss-of-function mutant are achieved through the enhanced effectiveness of CTR1 kinase inactivation resulting from the binding of ethylene, which in turn lowers the threshold of induction required for the development of the ethylene response phenotype (45). Moreover, in the regulation of CTR1 MAPKKK on the stability of EIN3, the role of the mitogen-activated protein kinase kinase 9–mitogen-activated protein kinase 3/6 cascade is still controversial (37, 95); protein phosphorylation-mediated ethylene signaling may include all these possible kinase activity outputs and multiple signaling pathways. Our quantitative phosphoproteomics performed on wild-type Arabidopsis and ctr1-1 plants, which were of a similar morphological phenotype (Fig. 1) and exposed to identical ethylene treatments, revealed distinct and differential phosphopeptide profiles between them (Table III). Given the existing model by which ethylene inactivates CTR1 kinase activities, leading to the dephosphorylation of EIN2 S645 and S924 (11, 12), our differential phosphoproteomics results strongly suggested that kinase activities of the ethylene receptor–CTR1 complex may still exist after ethylene treatment (Table III). Alternatively, it is likely that the physical presence of CTR1 protein enhances the phosphorylation of some phosphosites indirectly. It is also possible that there are ethylene-induced kinase activities other than that of CTR1 kinase, which transduces the ethylene binding of the receptor to downstream protein phosphorylation events in parallel with CTR1 kinase. Furthermore, it is also possible that the ethylene signaling from the binding of ethylene to protein kinase activity output may occur through alteration of the protein substrate specificity of CTR1 kinase by the ethylene-modified receptor complex. Nevertheless, these multiple protein phosphorylation-mediated signal transduction pathways may integrate with EIN2-mediated transcriptional activities to constitute an intricate dual-and-opposing effect of ethylene on the production of phosphorylated isoforms that have been shown to be required in the regulation of several biological processes (20, 25).
In conclusion, the ethylene receptor–CTR1 kinase complex may initiate its signaling cascade through multiple protein phosphorylation pathways (Fig. 7A). Bioinformatic analysis of ethylene-regulated phosphoproteins further indicates that ethylene has a dual-and-opposing effect on the production of the phosphorylated isoform of ATRSP41, which is very similar to that of ERF110, whose transcription is regulated by ethylene via EIN2 but whose phosphorylation/dephosphrylation is EIN2 independent (18, 25). Based on our results, phosphorylation of ATRSP41 is suppressed by a 1-min ethylene treatment (Table II). This down-regulation of phosphorylation levels may be due to the reduced activities of CTR1 kinase or increased phosphatase activities (Fig. 7B). In contrast, the gene expression of this phosphoprotein is stimulated by ethylene through EIN3/EIL1 ethylene response transcription factors (35) (Fig. 7B).
Fig. 7.

Proposed models for ethylene signaling networks. A, a model of the ethylene signaling network is reconstructed by integrating the phosphoproteins regulated by either ethylene or CTR1 protein with the well-known linear ethylene signaling pathway. B, dual-and-opposing effect of ethylene on arginine/serine-rich splicing factor (ATRSP41, AT5G52040). C, dual-and-opposing effect of ethylene on plasma membrane intrinsic protein 2A (PIP2A, AT3G53420). D, dual-and-opposing effect of CTR1 on light harvesting chlorophyll A/B binding protein 1.1 (LHCB1.1, AT1G29920). E, dual-and-opposing effect of ethylene on flowering gene bHLH 3 (FBH3, AT1G51140). Octagons, circles, boxes, and hexagons represent receptors, kinases, phosphatases, and other components of the ethylene signaling network, respectively. Arrows represent positive effects, whereas stop ends represent negative effects. Red and gray lines represent protein phosphorylation and protein dephosphorylation, respectively, and cyan lines represent the regulation of gene expression. Black line represents the effect on the synthesis of hormones. Solid lines represent direct regulation, and double solid lines represent direct or indirect regulation. Dashed lines represent putative interactions. A dashed line with a question mark means the regulation is assumed.
Another, more complex regulation model that we found is the regulation of phosphorylation of PIP2A by ethylene. Previous studies revealed that the dephosphorylation of S274 within a highly conserved C-terminus region of spinach PIP2 triggers the closure of the PIP2 water channel (96–98). Further studies revealed that the phosphorylation of PIP2A at S280 and S283 positions is salt-enhanced (99) and abscisic-acid-repressed (66), respectively, in Arabidopsis. Thus, the opening and closing of the PIP water channel is consistent with its role in response to salt and drought stresses, respectively. In the comparative study of ethylene-treated phosphoproteomes of wild-type Arabidopsis and ctr1-1, a decrease in the phosphorylation level of these two phosphosites on PIP2A may have resulted from ethylene down-regulated kinase activity of CTR1 (Fig. 7C). As a predicted protein kinase to PIP2A, ASG5 is suppressed by ethylene at the transcriptional level (35), and such an effect may be mediated by the CTR1-EIN2-EIN3/EIL1 pathway (i.e. by reducing the kinase activity of CTR1), as are most other ethylene-responsive genes. Thus, ethylene may have a dual-and-opposing effect on the activated isoform of PIP2A, as in the case of ERF110 (Fig. 7C), in which ethylene may dually and oppositely regulate the phosphorylated PIP2A through ASG5 and other kinases/phosphatases (Fig. 7C). The multifaceted regulation of PIP2A phosphorylation is further complicated by the crosstalk present between ethylene and auxin. Although the expression of PIP2A is repressed by auxin (100), the synthesis of this hormone and plants' perception of auxin are up-regulated by ethylene (101) (Fig. 7C). Moreover, studies of the transcriptional profile of PIP2A further revealed quite different expression patterns for this gene (29, 35). Thus, discovering how ethylene regulates PIP2A gene expression and water-channel activities is an interesting yet challenging task and remains to be further investigated.
Our quantitative phosphoproteomics study also revealed several chloroplast proteins whose phosphorylation is regulated by CTR1 kinase. This finding suggests possible linkages from ethylene signaling to light harvesting. Among those CTR1 kinase-up-regulated and chloroplast-located phosphopeptides, it has been reported that phosphorylation of the T451 amino acid of PTAC16 and the S48 amino acid of LHCB1.1–1.3 (S47 of LHCB1.4 or S46 of LHCB1.5) are STN7-dependent and -independent, respectively (85). Thus, it is likely that there is more than one pathway from CTR1 kinase to chloroplast. Even though the changes are relatively small, it was revealed via Student's t test from the rcn1-1 experiment that the phosphorylation levels of both T451 of PTAC16 and S48 of LHCB1.1–1.3 (S47 of LHCB1.4 or S46 of LHCB1.5) in 1-min ethylene-treated plants are lower than those in air-treated plants (see supplemental Tables S4 and S5). This may be caused by reduced kinase activity of CTR1 under ethylene treatment. This observation clearly indictes that the kinase activity of CTR1 is reduced but not completely inhibited. The light-harvesting chlorophyll a/b-binding protein family is required for stomatal movement (102). Because the expression of LHCB1.1 is repressed by both glucose and fructose in wild-type Arabidopsis but not in ctr1-1 mutant, it is concluded that the sugar-mediated repression of LHCB1.1 is CTR1-dependent (103, 104). Because CTR1 kinase also enhances the phosphorylation of LHCB1.1, it is likely that the production of the phosphorylated isoform of LHCB1.1 can be dually and oppositely affected by CTR1 kinase or CTR1-regulated kinase/phosphatase in the cell signaling systems (Fig. 7D).
Finally, FBH3 (AT1G51140) is one of four flowering bHLH proteins. The overexpression of FBH3 causes early flowering in Arabidopsis (105). FBH3 was suggested as one of the putative substrates for PP2A in our differential phophoproteomic analysis, and it was also predicted as a substrate of calmodulin-domain protein kinase 9 (AT3G20410), the expression of which happened to be enhanced by ethylene (35). Thus, again ethylene is proposed to have a dual-and-opposing effect on the phosphorylation state of FBH3 through the opposing enzyme activities of kinase against phosphatase on the phosphosite (Fig. 7E).
Although significant changes in phosphopeptide profiles have been uncovered by our PTM proteomic analysis, no single case has been observed in our experiments in which a complete phosphorylation/dephosphorylation event (e.g. only the 14N-coded peak in forward experiments or the 15N-coded one in reciprocal experiments) occurred in either differential hormone treatments or different genotypes.
GPS, as a predictor for site-specific kinase–substrate relations, has been used in many investigations on protein phosphorylation in animals (60). In the present study, we analyzed the results of quantitative phosphoproteomics with GPS to predict site-specific protein kinases involved in ethylene signaling (35, 91). Some of these putative kinases (supplemental Table S6) have been successfully constructed in models of ethylene signaling networks (Fig. 7). These findings indicate that GPS not only can be used in the prediction of plant kinases, but also can be integrated with stable-isotope-assisted quantitative phosphoproteomics to construct kinase–substrate relationships and establish the PTM networks during cell signaling and development (Figs. 6 and 7). The resulting quantitative proteomics and molecular systems-biology-based cell signaling networks may serve as guidelines for further experimental validation and functional studies.
Supplementary Material
Footnotes
* This work is supported by grants CAS10SC01, SEG-HKUST05, HKUST10/CRF/10, NMESL11SC01, HKUST12/CRF/11G, CGPL02-07L01907/08PN, CGPL03-07L01908/09PN, CGPL05-07L01908/09PN, CGPL02-07L01912/13PN and HKCT01-07L01910/11PN and internal funding from the Energy Institute of HKUST. Arabidopsis mutants eer1-1 and rcn1-1 were gifts from Dr. Caren Chang at the University of Maryland and from Dr. Alison DeLong at Brown University and Dr. Gloria K. Muday at Wake Forest University, respectively.
 This article contains supplemental material.
1 The abbreviations used are:
- ACC
- aminocyclopropane-1-carboxylic acid
- ACN
- acetonitrile
- CIPK1
- CBL-interacting protein kinase 1
- CTR1
- constitutive triple response 1
- eer1-1
- enhanced ethylene response 1
- EIN
- ethylene insensitive
- FBH3
- flowering bHLH 3 protein
- FDR
- false discovery rate
- GPS
- group-based prediction system
- HMG
- high mobility group
- IMAC
- immobilized metal-ion-affinity chromatography
- iTRAQ
- isobaric tag for relative and absolute quantitation
- LHCB
- light harvetsting chlorophyll A/B binding protein
- MAPKKK
- mitogen-activated protein kinase kinase kinase
- PIP
- plasma membrane intrinsic protein
- PPI
- protein–protein interaction
- PP2A
- protein phosphatase 2A
- PTAC16
- plastic transcriptionally active 16
- PTM
- post-translational modification
- RCN1
- roots curl in naphthylphthalamic acid 1
- SILIA
- 15N stable isotope labeling in Arabidopsis
- STN
- state transition.
REFERENCES
- 1. Mattoo A. K., Suttle J. C. (1991) The Plant Hormone Ethylene, CRC Press, Boca Raton, FL [Google Scholar]
- 2. Chang C., Kwok S. F., Bleecker A. B., Meyerowitz E. M. (1993) Arabidopsis ethylene-response gene ETR1: similarity of product to two-component regulators. Science 262, 539–544 [DOI] [PubMed] [Google Scholar]
- 3. Schaller G. E., Ladd A. N., Lanahan M. B., Spanbauer J. M., Bleecker A. B. (1995) The ethylene response mediator ETR1 from Arabidopsis forms a disulfide-linked dimer. J. Biol. Chem. 270, 12526–12530 [DOI] [PubMed] [Google Scholar]
- 4. Hua J., Meyerowitz E. M. (1998) Ethylene responses are negatively regulated by a receptor gene family in Arabidopsis thaliana. Cell 94, 261–271 [DOI] [PubMed] [Google Scholar]
- 5. Rodriguez F. I., Esch J. J., Hall A. E., Binder B. M., Schaller G. E., Bleecker A. B. (1999) A copper cofactor for the ethylene receptor ETR1 from Arabidopsis. Science 283, 996–998 [DOI] [PubMed] [Google Scholar]
- 6. Kieber J. J., Rothenberg M., Roman G., Feldmann K. A., Ecker J. R. (1993) CTR1, a negative regulator of the ethylene response pathway in Arabidopsis, encodes a member of the raf family of protein kinases. Cell 72, 427–441 [DOI] [PubMed] [Google Scholar]
- 7. Gao Z., Chen Y. F., Randlett M. D., Zhao X. C., Findell J. L., Kieber J. J., Schaller G. E. (2003) Localization of the Raf-like kinase CTR1 to the endoplasmic reticulum of Arabidopsis through participation in ethylene receptor signaling complexes. J. Biol. Chem. 278, 34725–34732 [DOI] [PubMed] [Google Scholar]
- 8. Kieber J. J. (1997) The ethylene response pathway in Arabidopsis. Annu. Rev. Plant Physiol. Plant Mol. Biol. 48, 277–296 [DOI] [PubMed] [Google Scholar]
- 9. Clark K. L., Larsen P. B., Wang X., Chang C. (1998) Association of the Arabidopsis CTR1 Raf-like kinase with the ETR1 and ERS ethylene receptors. Proc. Natl. Acad. Sci. U.S.A. 95, 5401–5406 [DOI] [PMC free article] [PubMed] [Google Scholar]
- 10. Huang Y., Li H., Hutchison C. E., Laskey J., Kieber J. J. (2003) Biochemical and functional analysis of CTR1, a protein kinase that negatively regulates ethylene signaling in Arabidopsis. Plant J. 33, 221–233 [DOI] [PubMed] [Google Scholar]
- 11. Qiao H., Shen Z., Huang S. S., Schmitz R. J., Urich M. A., Briggs S. P., Ecker J. R. (2012) Processing and subcellular trafficking of ER-tethered EIN2 control response to ethylene gas. Science 338, 390–393 [DOI] [PMC free article] [PubMed] [Google Scholar]
- 12. Ju C., Yoon G. M., Shemansky J. M., Lin D. Y., Ying Z. I., Chang J., Garrett W. M., Kessenbrock M., Groth G., Tucker M. L., Cooper B., Kieber J. J., Chang C. (2012) CTR1 phosphorylates the central regulator EIN2 to control ethylene hormone signaling from the ER membrane to the nucleus in Arabidopsis. Proc. Natl. Acad. Sci. U.S.A. 109, 19486–19491 [DOI] [PMC free article] [PubMed] [Google Scholar]
- 13. Alonso J. M., Hirayama T., Roman G., Nourizadeh S., Ecker J. R. (1999) EIN2, a bifunctional transducer of ethylene and stress responses in Arabidopsis. Science 284, 2148–2152 [DOI] [PubMed] [Google Scholar]
- 14. Chao Q., Rothenberg M., Solano R., Roman G., Terzaghi W., Ecker J. R. (1997) Activation of the ethylene gas response pathway in Arabidopsis by the nuclear protein ETHYLENE-INSENSITIVE3 and related proteins. Cell 89, 1133–1144 [DOI] [PubMed] [Google Scholar]
- 15. Guo H., Ecker J. R. (2003) Plant responses to ethylene gas are mediated by SCF(EBF1/EBF2)-dependent proteolysis of EIN3 transcription factor. Cell 115, 667–677 [DOI] [PubMed] [Google Scholar]
- 16. Potuschak T., Lechner E., Parmentier Y., Yanagisawa S., Grava S., Koncz C., Genschik P. (2003) EIN3-dependent regulation of plant ethylene hormone signaling by two arabidopsis F box proteins: EBF1 and EBF2. Cell 115, 679–689 [DOI] [PubMed] [Google Scholar]
- 17. Ohme-Takagi M., Shinshi H. (1995) Ethylene-inducible DNA binding proteins that interact with an ethylene-responsive element. Plant Cell 7, 173–182 [DOI] [PMC free article] [PubMed] [Google Scholar]
- 18. Lin Z., Zhong S., Grierson D. (2009) Recent advances in ethylene research. J. Exp. Botany 60, 3311–3336 [DOI] [PubMed] [Google Scholar]
- 19. Zhao Q., Guo H. W. (2011) Paradigms and paradox in the ethylene signaling pathway and interaction network. Mol. Plant 4, 626–634 [DOI] [PubMed] [Google Scholar]
- 20. Lu B. W., Pei L. K., Chan W. K., Zhang H., Zhu G., Li J. Y., Li N. (2001) The dual effects of ethylene on the negative gravicurvature of arabidopsis inflorescence, an intriguing action model for the plant hormone ethylene. Chinese Sci. Bull. 46, 279–283 [Google Scholar]
- 21. Madlung A., Behringer F. J., Lomax T. L. (1999) Ethylene plays multiple nonprimary roles in modulating the gravitropic response in tomato. Plant Physiol. 120, 897–906 [DOI] [PMC free article] [PubMed] [Google Scholar]
- 22. Binder B. M. (2008) The ethylene receptors: complex perception for a simple gas. Plant Sci. 175, 8–17 [Google Scholar]
- 23. Binder B. M., Mortimore L. A., Stepanova A. N., Ecker J. R., Bleecker A. B. (2004) Short-term growth responses to ethylene in Arabidopsis seedlings are EIN3/EIL1 independent. Plant Physiol. 136, 2921–2927 [DOI] [PMC free article] [PubMed] [Google Scholar]
- 24. Lu B. W., Yu H. Y., Pei L. K., Wong M. Y., Li N. (2002) Prolonged exposure to ethylene stimulates the negative gravitropic responses of Arabidopsis inflorescence stems and hypocotyls. Funct. Plant Biol. 29, 987–997 [DOI] [PubMed] [Google Scholar]
- 25. Zhu L., Liu D., Li Y., Li N. (2013) Functional phosphoproteomic analysis reveals that a serine-62-phosphorylated isoform of ethylene response factor110 is involved in Arabidopsis bolting. Plant Physiol. 161, 904–917 [DOI] [PMC free article] [PubMed] [Google Scholar]
- 26. Achard P., Baghour M., Chapple A., Hedden P., Van Der Straeten D., Genschik P., Moritz T., Harberd N. P. (2007) The plant stress hormone ethylene controls floral transition via DELLA-dependent regulation of floral meristem-identity genes. Proc. Natl. Acad. Sci. U.S.A. 104, 6484–6489 [DOI] [PMC free article] [PubMed] [Google Scholar]
- 27. Ogawara T., Higashi K., Kamada H., Ezura H. (2003) Ethylene advances the transition from vegetative growth to flowering in Arabidopsis thaliana. J. Plant Physiol. 160, 1335–1340 [DOI] [PubMed] [Google Scholar]
- 28. De Paepe A., Vuylsteke M., Van Hummelen P., Zabeau M., Van Der Straeten D. (2004) Transcriptional profiling by cDNA-AFLP and microarray analysis reveals novel insights into the early response to ethylene in Arabidopsis. Plant J. 39, 537–559 [DOI] [PubMed] [Google Scholar]
- 29. Zhong G. Y., Burns J. K. (2003) Profiling ethylene-regulated gene expression in Arabidopsis thaliana by microarray analysis. Plant Mol. Biol. 53, 117–131 [DOI] [PubMed] [Google Scholar]
- 30. Yang T., Poovaiah B. W. (2000) An early ethylene up-regulated gene encoding a calmodulin-binding protein involved in plant senescence and death. J. Biol. Chem. 275, 38467–38473 [DOI] [PubMed] [Google Scholar]
- 31. Zegzouti H., Jones B., Frasse P., Marty C., Maitre B., Latch A., Pech J. C., Bouzayen M. (1999) Ethylene-regulated gene expression in tomato fruit: characterization of novel ethylene-responsive and ripening-related genes isolated by differential display. Plant J. 18, 589–600 [DOI] [PubMed] [Google Scholar]
- 32. Li N. (2008) The dual-and-opposing-effect of ethylene on the negative gravitropism of Arabidopsis inflorescence stem and light-grown hypocotyls. Plant Sci. 175, 71–86 [Google Scholar]
- 33. Etheridge N., Chen Y. F., Schaller G. E. (2005) Dissecting the ethylene pathway of Arabidopsis. Brief. Funct. Genomic. Proteomic. 3, 372–381 [DOI] [PubMed] [Google Scholar]
- 34. Kendrick M. D., Chang C. (2008) Ethylene signaling: new levels of complexity and regulation. Curr. Opin. Plant Biol. 11, 479–485 [DOI] [PMC free article] [PubMed] [Google Scholar]
- 35. Qiao H., Chang K. N., Yazaki J., Ecker J. R. (2009) Interplay between ethylene, ETP1/ETP2 F-box proteins, and degradation of EIN2 triggers ethylene responses in Arabidopsis. Genes Dev. 23, 512–521 [DOI] [PMC free article] [PubMed] [Google Scholar]
- 36. Li Y., Shu Y., Peng C., Zhu L., Guo G., Li N. (2012) Absolute quantitation of isoforms of post-translationally modified proteins in transgenic organism. Mol. Cell. Proteomics 11, 272–285 [DOI] [PMC free article] [PubMed] [Google Scholar]
- 37. Yoo S. D., Cho Y. H., Tena G., Xiong Y., Sheen J. (2008) Dual control of nuclear EIN3 by bifurcate MAPK cascades in C2H4 signalling. Nature 451, 789–795 [DOI] [PMC free article] [PubMed] [Google Scholar]
- 38. Li H., Wong W. S., Zhu L., Guo H. W., Ecker J., Li N. (2009) Phosphoproteomic analysis of ethylene-regulated protein phosphorylation in etiolated seedlings of Arabidopsis mutant ein2 using two-dimensional separations coupled with a hybrid quadrupole time-of-flight mass spectrometer. Proteomics 9, 1646–1661 [DOI] [PubMed] [Google Scholar]
- 39. Moshkov I. E., Mur L. A., Novikova G. V., Smith A. R., Hall M. A. (2003) Ethylene regulates monomeric GTP-binding protein gene expression and activity in Arabidopsis. Plant Physiol. 131, 1705–1717 [DOI] [PMC free article] [PubMed] [Google Scholar]
- 40. Raz V., Fluhr R. (1993) Ethylene signal is transduced via protein phosphorylation events in plants. Plant Cell 5, 523–530 [DOI] [PMC free article] [PubMed] [Google Scholar]
- 41. Gamble R. L., Qu X., Schaller G. E. (2002) Mutational analysis of the ethylene receptor ETR1. Role of the histidine kinase domain in dominant ethylene insensitivity. Plant Physiol. 128, 1428–1438 [DOI] [PMC free article] [PubMed] [Google Scholar]
- 42. Wang W., Hall A. E., O'Malley R., Bleecker A. B. (2003) Canonical histidine kinase activity of the transmitter domain of the ETR1 ethylene receptor from Arabidopsis is not required for signal transmission. Proc. Natl. Acad. Sci. U.S.A. 100, 352–357 [DOI] [PMC free article] [PubMed] [Google Scholar]
- 43. Ouaked F., Rozhon W., Lecourieux D., Hirt H. (2003) A MAPK pathway mediates ethylene signaling in plants. EMBO J. 22, 1282–1288 [DOI] [PMC free article] [PubMed] [Google Scholar]
- 44. Larsen P. B., Chang C. (2001) The Arabidopsis eer1 mutant has enhanced ethylene responses in the hypocotyl and stem. Plant Physiol. 125, 1061–1073 [DOI] [PMC free article] [PubMed] [Google Scholar]
- 45. Larsen P. B., Cancel J. D. (2003) Enhanced ethylene responsiveness in the Arabidopsis eer1 mutant results from a loss-of-function mutation in the protein phosphatase 2A A regulatory subunit, RCN1. Plant J. 34, 709–718 [DOI] [PubMed] [Google Scholar]
- 46. Mayer-Jaekel R. E., Hemmings B. A. (1994) Protein phosphatase 2A—a “menage a trois.” Trends Cell Biol. 4, 287–291 [DOI] [PubMed] [Google Scholar]
- 47. Garbers C., DeLong A., Deruere J., Bernasconi P., Soll D. (1996) A mutation in protein phosphatase 2A regulatory subunit A affects auxin transport in Arabidopsis. EMBO J. 15, 2115–2124 [PMC free article] [PubMed] [Google Scholar]
- 48. Guo G., Li N. (2011) Relative and accurate measurement of protein abundance using 15N stable isotope labeling in Arabidopsis (SILIA). Phytochemistry 72, 1028–1039 [DOI] [PubMed] [Google Scholar]
- 49. Ong S. E., Blagoev B., Kratchmarova I., Kristensen D. B., Steen H., Pandey A., Mann M. (2002) Stable isotope labeling by amino acids in cell culture, SILAC, as a simple and accurate approach to expression proteomics. Mol. Cell. Proteomics 1, 376–386 [DOI] [PubMed] [Google Scholar]
- 50. Goshe M. B., Blonder J., Smith R. D. (2003) Affinity labeling of highly hydrophobic integral membrane proteins for proteome-wide analysis. J. Proteome Res. 2, 153–161 [DOI] [PubMed] [Google Scholar]
- 51. Gygi S. P., Rist B., Gerber S. A., Turecek F., Gelb M. H., Aebersold R. (1999) Quantitative analysis of complex protein mixtures using isotope-coded affinity tags. Nat. Biotechnol. 17, 994–999 [DOI] [PubMed] [Google Scholar]
- 52. Huttlin E. L., Hegeman A. D., Harms A. C., Sussman M. R. (2007) Comparison of full versus partial metabolic labeling for quantitative proteomics analysis in Arabidopsis thaliana. Mol. Cell. Proteomics 6, 860–881 [DOI] [PubMed] [Google Scholar]
- 53. Ong S. E., Mann M. (2005) Mass spectrometry-based proteomics turns quantitative. Nat. Chem. Biol. 1, 252–262 [DOI] [PubMed] [Google Scholar]
- 54. Ross P. L., Huang Y. N., Marchese J. N., Williamson B., Parker K., Hattan S., Khainovski N., Pillai S., Dey S., Daniels S., Purkayastha S., Juhasz P., Martin S., Bartlet-Jones M., He F., Jacobson A., Pappin D. J. (2004) Multiplexed protein quantitation in Saccharomyces cerevisiae using amine-reactive isobaric tagging reagents. Mol. Cell. Proteomics 3, 1154–1169 [DOI] [PubMed] [Google Scholar]
- 55. Whitelegge J. P., Katz J. E., Pihakari K. A., Hale R., Aguilera R., Gomez S. M., Faull K. F., Vavilin D., Vermaas W. (2004) Subtle modification of isotope ratio proteomics; an integrated strategy for expression proteomics. Phytochemistry 65, 1507–1515 [DOI] [PubMed] [Google Scholar]
- 56. Yao X., Freas A., Ramirez J., Demirev P. A., Fenselau C. (2001) Proteolytic 18O labeling for comparative proteomics: model studies with two serotypes of adenovirus. Anal. Chem. 73, 2836–2842 [DOI] [PubMed] [Google Scholar]
- 57. Washburn M. P., Wolters D., Yates J. R., 3rd (2001) Large-scale analysis of the yeast proteome by multidimensional protein identification technology. Nat. Biotechnol. 19, 242–247 [DOI] [PubMed] [Google Scholar]
- 58. Kline K. G., Sussman M. R. (2010) Protein quantitation using isotope-assisted mass spectrometry. Annu. Rev. Biophys. 39, 291–308 [DOI] [PubMed] [Google Scholar]
- 59. Schulze W. X., Usadel B. (2010) Quantitation in mass-spectrometry-based proteomics. Annu. Rev. Plant Biol. 61, 491–516 [DOI] [PubMed] [Google Scholar]
- 60. Xue Y., Ren J., Gao X., Jin C., Wen L., Yao X. (2008) GPS 2.0, a tool to predict kinase-specific phosphorylation sites in hierarchy. Mol. Cell. Proteomics 7, 1598–1608 [DOI] [PMC free article] [PubMed] [Google Scholar]
- 61. Peng J., Elias J. E., Thoreen C. C., Licklider L. J., Gygi S. P. (2003) Evaluation of multidimensional chromatography coupled with tandem mass spectrometry (LC/LC-MS/MS) for large-scale protein analysis: the yeast proteome. J. Proteome Res. 2, 43–50 [DOI] [PubMed] [Google Scholar]
- 62. Blanco L., Mead J. A., Bessant C. (2009) Comparison of novel decoy database designs for optimizing protein identification searches using ABRF sPRG2006 standard MS/MS data sets. J. Proteome Res. 8, 1782–1791 [DOI] [PubMed] [Google Scholar]
- 63. Choi H., Nesvizhskii A. I. (2008) False discovery rates and related statistical concepts in mass spectrometry-based proteomics. J. Proteome Res. 7, 47–50 [DOI] [PubMed] [Google Scholar]
- 64. Tabb D. L. (2008) What's driving false discovery rates? J. Proteome Res. 7, 45–46 [DOI] [PMC free article] [PubMed] [Google Scholar]
- 65. Li L., Kresh J. A., Karabacak N. M., Cobb J. S., Agar J. N., Hong P. (2008) A hierarchical algorithm for calculating the isotopic fine structures of molecules. J. Am. Soc. Mass Spectrom. 19, 1867–1874 [DOI] [PubMed] [Google Scholar]
- 66. Kline K. G., Barrett-Wilt G. A., Sussman M. R. (2010) In planta changes in protein phosphorylation induced by the plant hormone abscisic acid. Proc. Natl. Acad. Sci. U.S.A. 107, 15986–15991 [DOI] [PMC free article] [PubMed] [Google Scholar]
- 67. Swarup G., Cohen S., Garbers D. L. (1982) Inhibition of membrane phosphotyrosyl-protein phosphatase activity by vanadate. Biochem. Biophys. Res. Commun. 107, 1104–1109 [DOI] [PubMed] [Google Scholar]
- 68. Tsuboi K. K., Wiener G., Hudson P. B. (1957) Acid phosphatase. VII. Yeast phosphomonoesterase; isolation procedure and stability characteristics. J. Biol. Chem. 224, 621–635 [PubMed] [Google Scholar]
- 69. Hanks S. K., Hunter T. (1995) Protein kinases 6. The eukaryotic protein kinase superfamily: kinase (catalytic) domain structure and classification. FASEB J. 9, 576–596 [PubMed] [Google Scholar]
- 70. Manning G., Whyte D. B., Martinez R., Hunter T., Sudarsanam S. (2002) The protein kinase complement of the human genome. Science 298, 1912–1934 [DOI] [PubMed] [Google Scholar]
- 71. Breitkreutz B. J., Stark C., Reguly T., Boucher L., Breitkreutz A., Livstone M., Oughtred R., Lackner D. H., Bahler J., Wood V., Dolinski K., Tyers M. (2008) The BioGRID Interaction Database: 2008 update. Nucleic Acids Res. 36, D637–D640 [DOI] [PMC free article] [PubMed] [Google Scholar]
- 72. Salwinski L., Miller C. S., Smith A. J., Pettit F. K., Bowie J. U., Eisenberg D. (2004) The Database of Interacting Proteins: 2004 update. Nucleic Acids Res. 32, D449–D451 [DOI] [PMC free article] [PubMed] [Google Scholar]
- 73. Aranda B., Achuthan P., Alam-Faruque Y., Armean I., Bridge A., Derow C., Feuermann M., Ghanbarian A. T., Kerrien S., Khadake J., Kerssemakers J., Leroy C., Menden M., Michaut M., Montecchi-Palazzi L., Neuhauser S. N., Orchard S., Perreau V., Roechert B., van Eijk K., Hermjakob H. (2010) The IntAct molecular interaction database in 2010. Nucleic Acids Res. 38, D525–D531 [DOI] [PMC free article] [PubMed] [Google Scholar]
- 74. Chatr-aryamontri A., Ceol A., Palazzi L. M., Nardelli G., Schneider M. V., Castagnoli L., Cesareni G. (2007) MINT: the Molecular INTeraction database. Nucleic Acids Res. 35, D572–D574 [DOI] [PMC free article] [PubMed] [Google Scholar]
- 75. Jensen L. J., Kuhn M., Stark M., Chaffron S., Creevey C., Muller J., Doerks T., Julien P., Roth A., Simonovic M., Bork P., von Mering C. (2009) STRING 8—a global view on proteins and their functional interactions in 630 organisms. Nucleic Acids Res. 37, D412–D416 [DOI] [PMC free article] [PubMed] [Google Scholar]
- 76. Guzman P., Ecker J. R. (1990) Exploiting the triple response of Arabidopsis to identify ethylene-related mutants. Plant Cell 2, 513–523 [DOI] [PMC free article] [PubMed] [Google Scholar]
- 77. Tsuchisaka A., Yu G., Jin H., Alonso J. M., Ecker J. R., Zhang X., Gao S., Theologis A. (2009) A combinatorial interplay among the 1-aminocyclopropane-1-carboxylate isoforms regulates ethylene biosynthesis in Arabidopsis thaliana. Genetics 183, 979–1003 [DOI] [PMC free article] [PubMed] [Google Scholar]
- 78. Obenauer J. C., Cantley L. C., Yaffe M. B. (2003) Scansite 2.0: proteome-wide prediction of cell signaling interactions using short sequence motifs. Nucleic Acids Res. 31, 3635–3641 [DOI] [PMC free article] [PubMed] [Google Scholar]
- 79. Herzog F., Kahraman A., Boehringer D., Mak R., Bracher A., Walzthoeni T., Leitner A., Beck M., Hartl F. U., Ban N., Malmstrom L., Aebersold R. (2012) Structural probing of a protein phosphatase 2A network by chemical cross-linking and mass spectrometry. Science 337, 1348–1352 [DOI] [PubMed] [Google Scholar]
- 80. Duby G., Boutry M. (2009) The plant plasma membrane proton pump ATPase: a highly regulated P-type ATPase with multiple physiological roles. Pflugers Arch. 457, 645–655 [DOI] [PubMed] [Google Scholar]
- 81. Speth C., Jaspert N., Marcon C., Oecking C. (2010) Regulation of the plant plasma membrane H+-ATPase by its C-terminal domain: what do we know for sure? Eur. J. Cell Biol. 89, 145–151 [DOI] [PubMed] [Google Scholar]
- 82. O'Neill S. D., Zheng C. C. (1998) Abundance of mRNAs encoding HMG1/HMG2 class high-mobility-group DNA-binding proteins are differentially regulated in cotyledons of Pharbitis nil. Plant Mol. Biol. 37, 235–241 [DOI] [PubMed] [Google Scholar]
- 83. Wisniewski J. R., Szewczuk Z., Petry I., Schwanbeck R., Renner U. (1999) Constitutive phosphorylation of the acidic tails of the high mobility group 1 proteins by casein kinase II alters their conformation, stability, and DNA binding specificity. J. Biol. Chem. 274, 20116–20122 [PubMed] [Google Scholar]
- 84. Young N. L., Plazas-Mayorca M. D., Garcia B. A. (2010) Systems-wide proteomic characterization of combinatorial post-translational modification patterns. Expert Rev. Proteomics 7, 79–92 [DOI] [PubMed] [Google Scholar]
- 85. Ingelsson B., Vener A. V. (2012) Phosphoproteomics of Arabidopsis chloroplasts reveals involvement of the STN7 kinase in phosphorylation of nucleoid protein pTAC16. FEBS Lett. 586, 1265–1271 [DOI] [PubMed] [Google Scholar]
- 86. Bellafiore S., Barneche F., Peltier G., Rochaix J. D. (2005) State transitions and light adaptation require chloroplast thylakoid protein kinase STN7. Nature 433, 892–895 [DOI] [PubMed] [Google Scholar]
- 87. Angel T. E., Aryal U. K., Hengel S. M., Baker E. S., Kelly R. T., Robinson E. W., Smith R. D. (2012) Mass spectrometry-based proteomics: existing capabilities and future directions. Chem. Soc. Rev. 41, 3912–3928 [DOI] [PMC free article] [PubMed] [Google Scholar]
- 88. Domon B., Aebersold R. (2010) Options and considerations when selecting a quantitative proteomics strategy. Nat. Biotechnol. 28, 710–721 [DOI] [PubMed] [Google Scholar]
- 89. He Z., Yang C., Guo G., Li N., Yu W. (2011) Motif-All: discovering all phosphorylation motifs. BMC Bioinformatics 12 Suppl 1, S22. [DOI] [PMC free article] [PubMed] [Google Scholar]
- 90. Stemmer C., Leeming D. J., Franssen L., Grimm R., Grasser K. D. (2003) Phosphorylation of maize and Arabidopsis HMGB proteins by protein kinase CK2alpha. Biochemistry 42, 3503–3508 [DOI] [PubMed] [Google Scholar]
- 91. Brodersen P., Petersen M., Bjorn Nielsen H., Zhu S., Newman M. A., Shokat K. M., Rietz S., Parker J., Mundy J. (2006) Arabidopsis MAP kinase 4 regulates salicylic acid- and jasmonic acid/ethylene-dependent responses via EDS1 and PAD4. Plant J. 47, 532–546 [DOI] [PubMed] [Google Scholar]
- 92. Bonhomme L., Valot B., Tardieu F., Zivy M. (2012) Phosphoproteome dynamics upon changes in plant water status reveal early events associated with rapid growth adjustment in maize leaves. Mol. Cell. Proteomics 11, 957–972 [DOI] [PMC free article] [PubMed] [Google Scholar]
- 93. Yu Y., Yoon S. O., Poulogiannis G., Yang Q., Ma X. M., Villen J., Kubica N., Hoffman G. R., Cantley L. C., Gygi S. P., Blenis J. (2011) Phosphoproteomic analysis identifies Grb10 as an mTORC1 substrate that negatively regulates insulin signaling. Science 332, 1322–1326 [DOI] [PMC free article] [PubMed] [Google Scholar]
- 94. Kerk D., Templeton G., Moorhead G. B. (2008) Evolutionary radiation pattern of novel protein phosphatases revealed by analysis of protein data from the completely sequenced genomes of humans, green algae, and higher plants. Plant Physiol. 146, 351–367 [DOI] [PMC free article] [PubMed] [Google Scholar]
- 95. An F., Zhao Q., Ji Y., Li W., Jiang Z., Yu X., Zhang C., Han Y., He W., Liu Y., Zhang S., Ecker J. R., Guo H. (2010) Ethylene-induced stabilization of ETHYLENE INSENSITIVE3 and EIN3-LIKE1 is mediated by proteasomal degradation of EIN3 binding F-box 1 and 2 that requires EIN2 in Arabidopsis. Plant Cell 22, 2384–2401 [DOI] [PMC free article] [PubMed] [Google Scholar]
- 96. Johansson I., Larsson C., Ek B., Kjellbom P. (1996) The major integral proteins of spinach leaf plasma membranes are putative aquaporins and are phosphorylated in response to Ca2+ and apoplastic water potential. Plant Cell 8, 1181–1191 [DOI] [PMC free article] [PubMed] [Google Scholar]
- 97. Tornroth-Horsefield S., Wang Y., Hedfalk K., Johanson U., Karlsson M., Tajkhorshid E., Neutze R., Kjellbom P. (2006) Structural mechanism of plant aquaporin gating. Nature 439, 688–694 [DOI] [PubMed] [Google Scholar]
- 98. Johansson I., Karlsson M., Shukla V. K., Chrispeels M. J., Larsson C., Kjellbom P. (1998) Water transport activity of the plasma membrane aquaporin PM28A is regulated by phosphorylation. Plant Cell 10, 451–459 [DOI] [PMC free article] [PubMed] [Google Scholar]
- 99. Prak S., Hem S., Boudet J., Viennois G., Sommerer N., Rossignol M., Maurel C., Santoni V. (2008) Multiple phosphorylations in the C-terminal tail of plant plasma membrane aquaporins: role in subcellular trafficking of AtPIP2;1 in response to salt stress. Mol. Cell. Proteomics 7, 1019–1030 [DOI] [PubMed] [Google Scholar]
- 100. Peret B., Li G., Zhao J., Band L. R., Voss U., Postaire O., Luu D. T., Da Ines O., Casimiro I., Lucas M., Wells D. M., Lazzerini L., Nacry P., King J. R., Jensen O. E., Schaffner A. R., Maurel C., Bennett M. J. (2012) Auxin regulates aquaporin function to facilitate lateral root emergence. Nat. Cell Biol. 14, 991–998 [DOI] [PubMed] [Google Scholar]
- 101. Swarup R., Perry P., Hagenbeek D., Van Der Straeten D., Beemster G. T., Sandberg G., Bhalerao R., Ljung K., Bennett M. J. (2007) Ethylene upregulates auxin biosynthesis in Arabidopsis seedlings to enhance inhibition of root cell elongation. Plant Cell 19, 2186–2196 [DOI] [PMC free article] [PubMed] [Google Scholar]
- 102. Xu Y. H., Liu R., Yan L., Liu Z. Q., Jiang S. C., Shen Y. Y., Wang X. F., Zhang D. P. (2012) Light-harvesting chlorophyll a/b-binding proteins are required for stomatal response to abscisic acid in Arabidopsis. J. Exp. Bot. 63, 1095–1106 [DOI] [PMC free article] [PubMed] [Google Scholar]
- 103. Cho Y. H., Sheen J., Yoo S. D. (2010) Low glucose uncouples hexokinase1-dependent sugar signaling from stress and defense hormone abscisic acid and C2H4 responses in Arabidopsis. Plant Physiol. 152, 1180–1182 [DOI] [PMC free article] [PubMed] [Google Scholar]
- 104. Cho Y. H., Yoo S. D. (2011) Signaling role of fructose mediated by FINS1/FBP in Arabidopsis thaliana. PLoS Genet. 7, e1001263. [DOI] [PMC free article] [PubMed] [Google Scholar]
- 105. Ito S., Song Y. H., Josephson-Day A. R., Miller R. J., Breton G., Olmstead R. G., Imaizumi T. (2012) FLOWERING BHLH transcriptional activators control expression of the photoperiodic flowering regulator CONSTANS in Arabidopsis. Proc. Natl. Acad. Sci. U.S.A. 109, 3582–3587 [DOI] [PMC free article] [PubMed] [Google Scholar]
Associated Data
This section collects any data citations, data availability statements, or supplementary materials included in this article.