

Abstract
Chronic hepatic disease damages the liver, and the resulting wound-healing process leads to liver fibrosis and the subsequent development of cirrhosis. The leading cause of hepatic fibrosis and cirrhosis is infection with hepatitis C virus (HCV), and of the patients with HCV-induced cirrhosis, 2% to 5% develop hepatocellular carcinoma (HCC), with a survival rate of 7%. HCC is one of the leading causes of cancer-related death worldwide, and the poor survival rate is largely due to late-stage diagnosis, which makes successful intervention difficult, if not impossible. The lack of sensitive and specific diagnostic tools and the urgent need for early-stage diagnosis prompted us to discover new candidate biomarkers for HCV and HCC. We used aptamer-based fractionation technology to reduce serum complexity, differentially labeled samples (six HCV and six HCC) with fluorescent dyes, and resolved proteins in pairwise two-dimensional difference gel electrophoresis. DeCyder software was used to identify differentially expressed proteins and spots picked, and MALDI-MS/MS was used to determine that ApoA1 was down-regulated by 22% (p < 0.004) in HCC relative to HCV. Differential expression quantified via two-dimensional difference gel electrophoresis was confirmed by means of 18O/16O stable isotope differential labeling with LC-MS/MS zoom scans. Technically independent confirmation was demonstrated by triple quadrupole LC-MS/MS selected reaction monitoring (SRM) assays with three peptides specific to human ApoA1 (DLATVYVDVLK, WQEEMELYR, and VSFLSALEEYTK) using 18O/16O-labeled samples and further verified with AQUA peptides as internal standards for quantification. In 50 patient samples (24 HCV and 26 HCC), all three SRM assays yielded highly similar differential expression of ApoA1 in HCC and HCV patients. These results validated the SRM assays, which were independently confirmed by Western blotting. Thus, ApoA1 is a candidate member of an SRM biomarker panel for early diagnosis, prognosis, and monitoring of HCC. Future multiplexing of SRM assays for other candidate biomarkers is envisioned to develop a biomarker panel for subsequent verification and validation studies.
Hepatocellular carcinoma (HCC)1 is the most common type of primary liver cancer and ranks third among cancers as a cause of death worldwide. With a five-year survival rate of less than 7% (1), it is responsible for more than a million deaths annually (2). Hepatitis C virus (HCV) is a major risk factor for the development of HCC, and an estimated 3 to 4 million people are infected with HCV annually (3).
The projected rise in new HCC cases in the United States is due mainly to latent HCV infections (4) in the general population, with the onset of HCC coming several decades after initial infection. The poor prognosis associated with HCC is primarily due to the disease being diagnosed at a late stage, making successful therapeutic intervention difficult, if not impossible. Early diagnosis is important for successful treatment by means of ablation, resection, and/or transplant. Although α-fetoprotein (AFP) is routinely used for screening, it is often normal or indeterminate in early cancer cases. AFP is a low-sensitivity biomarker that is normal in up to 40% of patients with HCC, particularly during the early stages (5). AFP is also a low-specificity biomarker, as it is seen in patients with cirrhosis or exacerbations of chronic hepatitis and pancreatitis (6, 7). These limitations generate anxiety for patients and physicians alike. Other screening modalities for early HCC detection are variously inaccurate, expensive (computed tomography or MRI), or potentially dangerous (biopsy). These concerns present the urgent need for a sensitive, specific, and facile screening modality for early detection, diagnosis, and monitoring of HCC that would provide significant clinical benefit. Thus, there is a critical unmet medical need to discover and validate novel specific biomarkers for the early detection of HCC.
Progression from chronic infection to cirrhosis and then to HCC usually results in changes in proteins found in hepatic tissues and peripheral blood (8). Accordingly, the exploration of serum to discover clinically useful protein and peptide biomarkers is promising. Serum provides a rich sample for diagnostic analyses because of the expression and release of proteins (potential biomarkers) into the bloodstream in response to specific physiological states. The proteomic characterization of human serum for the identification of disease-specific biomarkers promises to be a powerful diagnostic tool for defining the onset, progression, and prognosis of human diseases. Indeed, much of our current understanding of the serum proteome has come from the use of techniques such as two-dimensional PAGE and LC/MS, which have proven to be exceptionally useful for separating and identifying individual protein and peptide constituents in serum. Although the easily obtainable nature and high protein content of serum make it a valuable specimen for biomarker determination (9), there are still numerous hurdles to overcome when analyzing human serum, one of the most complex proteomes known. Serum contains ∼20 highly abundant proteins, which account for greater than 95% of the total protein mass, and a large number of medium- and low-abundance proteins that span some 12 orders of magnitude in concentration and represent an extremely formidable analytical challenge (10, 11). Thus the reliable proteomic characterization of serum and identification of biomarkers would be dramatically improved if the complexity of the serum proteome were reduced. Many fractionation techniques have been used to address this challenge; we used aptamer-based technology to reduce abundant proteins, thereby enriching lower abundance proteins with minimal or no loss of serum proteome information.
In this study, several analytical approaches were used to discover and confirm ApoA1 as a candidate serum-based biomarker for early HCC detection. We applied two-dimensional difference gel electrophoresis (DIGE) together with nanoflow liquid chromatography–tandem mass spectrometry (nano-LC-MS/MS) to detect proteins that are differentially expressed between HCV and HCC. Although many serum biomarker candidates have been discovered, verification and validation of these candidates are the rate-limiting steps in a biomarker pipeline (12) because conventional methods using antibodies (e.g. Western blotting, enzyme-linked immunosorbent assay) are not suitable for large-scale analysis because of their poor throughput and antibody availability (13). To overcome these challenges, we used selective reaction monitoring (SRM) to quantitatively verify and validate ApoA1 as a candidate biomarker in HCC and HCV.
EXPERIMENTAL PROCEDURES
Reagents
Cyanine dyes (Cy2, Cy3, and Cy5), mineral oil, Immobiline Dry Strip gels (24 cm, pH 3–11 NL), IPG buffer (pH 3–11 NL), DeStreak rehydration buffer, 24-cm DIGE and DALT precast gels with a buffer kit system, two-dimensional clean-up kits, secondary goat anti-mouse Cy3 antibody, fluorescent ECL plex marker, PVDF membranes, and blocking agent were purchased from GE Healthcare. ProteoMiner enrichment kits, Criterion Tris-HCl 4–20% precast gels, an RCDC Lowry assay kit, and Bradford reagents were obtained from Bio-Rad. H218O and H216O were from Cambridge Isotope Laboratories, Andover, MA. Immobilized trypsin was from Applied Biosystems, Foster City, CA. Sequencing-grade trypsin was from Promega, Madison, WI. Sep-Pak columns, zip tips, and HPLC-grade water were from Waters, Milford, MA. Dimethylformamide, iodoacetamide, glycerol, acetonitrile (ACN), DTT, TFA, acrylamide, Bis-acrylamide, bromphenol blue, CHAPS, glycine, SDS, urea, agarose, ammonium persulfate, ammonium bicarbonate, TEMED, Tris base, methanol, and ethanol were from Sigma Aldrich. Low-retention tubes and tips were from Fisher. All buffers were prepared with Milli-Q water (Millipore, Bedford, MA). Molecular weight markers were from Invitrogen. Primary mouse anti-human monoclonal ApoA1 antibody was from Cell Signaling, Boston, MA. 250 PP SNAP vials for triple quadrupole MS were from Agilent, Santa Clara, CA. Synthetic peptides (DLATVYVDVLK, DLATVYVDVL(K)* [Lys(13C6;15N2)], WQEEMELYR, WQEEMELYCAN* [Arg(13C615N4)], and VSFLSALEEYTK, VSFLSALEEYT(K)* [Lys(13C6;15N2)]) with purities greater than 97% were obtained from Thermo Fisher.
Patient Samples
All patients were HCV RNA positive but were free of co-infection with HIV and hepatitis B virus and had a history of low alcohol consumption, in order to minimize potential confounding covariant risk factors. The HCC status in patients was verified histologically or by meeting American Association for the Study of Liver Diseases (AASLD) radiographic criteria for HCC. Patient blood samples were obtained in red top tubes at University of Texas Medical Branch hospital clinics. Informed consent was obtained from all donors and was approved by the University of Texas Medical Branch Institutional Review Board (IRB #02–377). Blood samples were stored at 4 °C and centrifuged within 4 h after collection at 2500g for 10 min. The separated serum was aliquoted and stored at −80 °C until analysis. For convenience, the samples were labeled consecutively as HCV #1–24 and HCC #1–26. In order to allow direct comparison of HCC and HCV samples in some of the analyses, samples were randomly paired such that any HCV sample could be paired with any HCC sample. Thus, there was no relationship between pairs. The male/female ratio in this study was also random and based solely on the availability of sample. Thus, there is no significance to the study having more male subjects than females, and the ApoA1 levels did not differentiate between males and females.
Serum Enrichment
A serum prefractionation strategy with an aptamer-based technology (ProteoMiner, Bio-Rad) was used according to the manufacturer's instructions to reduce high-abundance proteins, thereby increasing the dynamic range for detecting lower abundance proteins without affecting the complexity of the serum proteome. Briefly, 1 ml of crude serum was incubated with the hexa-beads for 4 to 5 h at room temperature on a rotator, the columns were centrifuged to remove the liquid, and the beads were washed three times with wash buffer to remove unbound proteins. Bound proteins were eluted by incubating beads with 200 μl of elution buffer (8 m urea and 2% CHAPS) for 15 min on a rotator. This was repeated three times such that the total volume after enrichment of 1 ml serum was 600 μl. The enrichment protocol reduced high-abundance proteins by 97% and was found to be reproducible over a number of patient samples (recovery coefficient of variation < 5%, n = 12) and was thus seen as an appropriate strategy to incorporate into two-dimensional DIGE and 18O/16O studies.
Protein Processing and Labeling
To remove salts and other contaminants and to improve spot resolution, enriched serum samples from the ProteoMiner were cleaned using an Ettan 2-D Cleanup Kit and the protein pellets were resuspended in ice-cold DIGE-specific lysis buffer (30 mm Tris, 8 m urea, 2% CHAPS, pH 8.5 buffer). The protein concentration was determined with the Lowry assay using a BSA standard. CyDye stocks were resuspended to 1 mm in anhydrous N,N-dimethylformamide (99.8%). A working solution of 400 pmol was generated by diluting the stock with dimethylformamide. This solution was used to label the protein samples. 50 μg of protein was mixed with 400 pmol CyDye (GE Healthcare) via vortexing and incubated on ice in the dark for 30 min. 50 μg of protein enriched from each HCV or HCC sample was labeled with Cy3 or Cy5, respectively. An internal pooled standard sample was prepared by pooling a total of 50 μg protein from all 12 serum samples (6 HCV and 6 HCC) and then labeled with Cy2. All CyDye-labeled samples were quenched by the addition of 1 μl of 10 mm lysine followed by incubation on ice for a further 10 min. Pairs of HCV (Cy3) and HCC (Cy5) samples (100 μg total) were then mixed with 50 μg of the Cy2-labeled pooled internal standard.
Analytical Two-dimensional DIGE
For analytical gels, 150 μg protein was denatured in an equal volume of two-dimensional sample buffer (8 m urea, 2% CHAPS, 2% 60 mm DTT). Destreak rehydration buffer containing 0.5% IPG buffer pH 3–11 NL was added to a final volume of 450 μl. The sample was rehydrated onto 24-cm pH 3–11 NL IPG strips at 20 °C for 14 h using an Ettan IPG Phor 3 horizontal electrophoresis system (GE Healthcare). Isoelectric focusing was performed for 9 h starting with 0.5 kVh, ramping to 500 V in 1 h, holding at 1000 V for 1 h, ramping to 8000 V over 3 h, and holding at 8000 V for 4 h. Each IPG strip was then equilibrated with a reducing equilibration buffer (6 M urea, 50 mm Tris-HCl pH 8.8, 30% (v/v) glycerol, 2% (w/v) SDS, 0.5% (w/v) DTT) for 15 min followed by an alkylating equilibration buffer (6 M urea, 50 mm Tris-HCl, pH 8.8, 30% (v/v) glycerol, 2% (w/v) SDS, 4.5% (w/v) iodoacetamide) for 15 min. The IPG strips were then placed on top of 12.5% 24-cm DIGE-precast gels, sealed with an agarose sealing solution (25 mm Tris, 192 mm glycine, 0.1% SDS, 0.5% (w/v) agarose, 0.02% bromphenol blue), and run with DIGE buffer on an Ettan Dalt-6 (GE Healthcare) at 1 W for 1 h followed by 17 W for 5 to 6 h or until the bromphenol blue dye front reached the bottom of the gel.
Imaging and DeCyder Analysis
Following two-dimensional PAGE, DIGE gels were immediately scanned using a Typhoon Trio Variable Mode Imager (GE Healthcare) with Ettan DALT gel alignment guides using excitation/emission wavelengths specific for Cy3 (532/580 nm), Cy5 (633/670 nm), and Cy2 (488/520 nm). To control for variation in the signal across gels, the photomultiplier tube (PMT) was set to ensure maximum pixel intensity values for all gel images and was kept within the range of 40,000–60,000 pixels as suggested (14). All gel images were obtained at 50 μm resolution and processed using Image Quant software (GE Healthcare) prior to image analysis. Because the DIGE precast gels used for the second dimension were on low-fluorescent glass plates, gels were not taken off of glass plates, making the scanning alignment easier and more accurate. The Cy3, Cy5, and Cy2 images of the same gel were electronically merged, and the proteins were detected as Cy3/Cy2 and Cy5/Cy2 spots. DeCyder v.7.0 was used to analyze the two-dimensional DIGE images as described in the Ettan DIGE User Manual (GE Healthcare). In brief, individual fluorescent gel images were imported into the DeCyder DIA (difference in-gel analysis) module so that differentially expressed protein spot features within the gels could be detected with no slope or area cutoff, without image area restriction, and with the detection of 4,000 to 5,000 spots per gel. The Cy2 image of the internal standard increases the quality and reproducibility of two-dimensional gel analysis by allowing local spot normalization and by providing reference spots for further gel-to-gel matching. The 2 S.D. model was set as the threshold to define the spots that differed in volume between HCC and HCV to ensure that volume ratio changes were unlikely to have occurred by chance. Difference in-gel analysis is only appropriate for single pair-wise comparisons and cannot be used to analyze the data generated by all gels for group statistical analysis. The analytical two-dimensinoal DIGE was performed with 12 patient samples on six gels (six pairs of biological replicates). In order to identify differentially expressed protein spots across the six gels, the results from the intragel comparison (six DIA files) were then imported into the BVA (biological variation analysis) module of the DeCyder software. Each gel was first grouped as HCV or HCC to allow comparison between the different gels. The Cy2 image of gel 3 was selected as the master, and the other five internal standard images were matched sequentially to it. Confirmation of the correct matching of spots across the gel images was examined by the match of vectors for the standard gel images to the master gel. If the matching in an area required correction, the current matches were broken and remade with the appropriate spots in the match table mode of BVA while in land marking mode. Several rounds of “combing” the match vectors were needed to ensure that the level of matching was sufficient before any spot changes could be analyzed. A stand-alone warping tool for DIGE gels known as TTS 900 has been developed by Nonlinear Dynamics to allow manual warping of gels to a reference gel to improve the accuracy of spot matching between gel images. Spots with p < 0.05 that were present in at least four of the six gels were filtered based on an average volume ratio of >1.5-fold.
Preparative Two-dimensional Gels
For spot picking and identification, preparative isoelectric focusing/two-dimensional PAGE was performed using 500 μg of protein by pooling equal amounts of HCV and HCC enriched serum. Isoelectric focusing was run as for the analytical samples, but the gels used were 12.5% DALT precast gels with plastic backing to make spot picking easier. A total of six preparative gels were run, with each gel containing the same pair of HCV and HCC samples used for analytical gels. All preparative gels were stained with Sypro Ruby for 3 to 4 h at room temperature and destained for 1 h or until the spots were clearly visible. Spots were picked from six preparative gels (12 samples consisting of 6 pairs of biological replicates) and processed for MS-based protein identification.
Peptide and Protein Identification of Two-dimensional Gel Spots
Spot picking was performed on preparative gels (gels 1–6) using a manual spot picker. Gel samples were destained, minced, incubated in low-retention microtubes with 50 mm ammonium bicarbonate at 37 °C for 30 min, washed with water followed by ACN, and then dried in a SpeedVac. Gel pieces were covered with ∼10 μl of 50 mm ammonium bicarbonate solution, pH 8.0, containing 1 μg trypsin (Promega) overnight at 37 °C. 1 μl of solution was spotted directly onto a MALDI target plate and dried. 1 μl of α-cyano-4-hydroxycinnamic acid (Aldrich Chemical Co.) matrix solution (50:50 ACN/water at 5 mg/ml) was then applied and dried.
Proteins were identified using MALDI-TOF-MS with an Applied Biosystems 4800 MALDI-TOF/TOF Proteomics Analyzer using the 4000 Series Explorer (v.3.6 RC1) with Oracle Database Schema Version (v.3.19.0), Data Version (3.80.0), to acquire both MS and MS/MS spectral data. The instrument was operated in positive ion reflectron mode with a mass range of 850–3,000 Da and a focus mass at 1,700 Da. For MS data, 1,000 to 2,000 laser shots were acquired and averaged from each sample spot. Automatic external calibration was performed using a peptide mixture with reference masses of 904.468, 1,296.685, 1,570.677, and 2,465.199. Following MALDI-MS analysis, MALDI-MS/MS was performed on several abundant ions from each sample spot. A 1-kV positive ion MS/MS method was used to acquire data under post-source decay conditions. The instrument precursor selection window was ±3 Da. For MS/MS data, 2,000 laser shots were acquired and averaged from each sample spot. Automatic external calibration was performed using reference fragment masses. Applied Biosystems GPS ExplorerTM (v.3.6) software was used in conjunction with MASCOT to search the MS and MS/MS spectral data for protein identification.
Protein match probabilities were determined using expectation values and/or MASCOT protein scores. MS peak filtering included the following parameters: mass range, 800 to 3000 Da; minimum signal-to-noise filter, 10; mass exclusion list tolerance, 0.5 Da; and mass exclusion list (for some trypsin- and keratin-containing compounds) included masses of 842.51, 870.45, 1,045.56, 1,179.60, 1,277.71, 1,475.79, and 2,211.1. For protein identification, the human Swiss-Prot database (downloaded January 25, 2010; 20,068 proteins) was searched. Other parameters included selecting the enzyme as trypsin, a maximum of one missed cleavage, fixed modifications including carbamidomethyl ACN, variable modifications including oxidation (M), precursor tolerance of 0.2 Da, MS/MS fragment tolerance of 0.3 Da, mass = monoisotopic, and peptide charges considered for only +1. The significance of a protein match, based on both the peptide mass fingerprint in the first MS and the MS/MS data from several precursor ions, was based on an expectation value, which is the number of matches with equal or better scores that are expected to occur by chance alone. A stringent threshold of 10−3 for protein identification was used.
Identifications were verified in gels 2, 3, and 4 by nano-LC-MS/MS using a Thermo Finnigan LTQ Orbitrap Velos with collision-induced dissociation and electron-transfer dissociation capability coupled with an Eksigent Nano LC Ultra 1D Plus. Samples were injected onto a nanotrap column (100 μm inner diameter × 1 cm, C18 PepMap 100) and then onto a C18 reversed-phase column (LC Packings, Acclaim PepMap 100 C18, 3 μm). The flow was set at 400 nl/min with a 60-min LC gradient, and the mobile phases were A (5% ACN, 0.1% formic acid) and B (100% ACN, 0.1% formic acid). Sample injection amounts ranged from 1 to 10 μl depending on the concentration of the sample. Eluates were sprayed through a charged emitter tip (Pico Tip Emitter, New Objective, Woburn, MA, 10 ± 1 μm) into the mass spectrometer. Parameters included the following: tip voltage at +2.0 kV, Fourier transform MS mode for MS acquisition of precursor ions (60,000 resolution setting), and ion trap MS mode for subsequent MS/MS of the top six precursors. Xcalibar raw data were imported into Thermo Proteome Discoverer 1.2.0.208 to search the human Swiss-Prot database (downloaded January 25, 2010; 20,068 proteins) using MS/MS spectral data for protein identification. Protein match probabilities were determined using expectation values and/or MASCOT protein scores. The precursor ion mass tolerance was 0.01 Da, the MS/MS fragment mass tolerance was 0.3 Da, and peptide charges were considered for +2 and +3. The significance of a protein match was based on expectation values. The default significance threshold was p < 0.05, so an expectation value of 0.05 was considered as this threshold. We used a more stringent threshold of 10−3 for protein identification where a lower expectation value indicated a more significant score.
Differential Stable Isotope Labeling
18O/16O differential stable isotope labeling was performed as described elsewhere (15–18), with slight modifications. Briefly, 100 μg each of HCV and HCC serum samples, both crude and ProteoMiner enriched, were denatured with 8 m GdmCl, reduced with 10 mm DTT for 30 min, alkylated with 30 mm iodoacetamide for 2 h at 37 °C, digested with trypsin (1:50 enzyme-to-protein ratio), diluted 10-fold with 50 mm ammonium bicarbonate, and incubated at 37 °C for 24 h. Trypsin was deactivated by incubating samples at 95 °C for 10 min and adding 12 μl of 0.1% TFA to each sample. Following desalting on Sep-Pak cartridges and drying in a SpeedVac, peptides were resuspended in 20 μl of 100% ACN and mixed with 180 μl of 16O- or 18O-water for HCV or HCC, respectively. 100 μl of immobilized trypsin beads (Applied Biosciences) was dried and mixed with the resuspended tryptic peptides, and a small amount of dry ammonium bicarbonate was added. Samples were then incubated for 2 days at 37 °C in a shaking water bath. After removal of the beads via centrifugation, peptides were desalted with zip tips and the dried peptides were stored at −20 °C. Peptides were reconstituted in buffer (98% H2O, 2% ACN, and 0.1% TFA) and mixed in a 1:1 ratio of 18O:16O just before use to avoid any back-exchange.
Relative Quantification of Differentially Labeled Peptides via LTQ Ion Trap Mass Spectrometry with Zoom Scans
Peptides were separated and analyzed as previously described (15–18). The samples (18O- and 16O-labeled, corresponding to HCC and HCV) were mixed in a 1:1 ratio and analyzed in triplicate using LC-MS/MS performed with an LTQ linear ion trap mass spectrometer (ThermoFinnigan, San Jose, CA) equipped with a nanospray source with an on-line ProteomX® nano-HPLC system (ThermoFinnigan, San Jose, CA). The mass spectrometer was operated in the data-dependent triple play mode. The three most intense ions in each MS survey scan were automatically selected for zoom scan and MS/MS. The acquired MS/MS spectra were processed using MassXplorer (16). Briefly, spectra were searched against a composite target-decoy human protein database consisting of the target and decoy (reversed) protein sequences downloaded from the human Swiss-Prot Protein Database with the SEQUEST algorithm using the Bioworks 3.2 platform (ThermoFinnigan, San Jose, CA). The zoom scan data were used to calculate the relative abundance ratios of 18O/16O-labeled peptide pairs. We used power spectrum transformation to remove high-frequency noise and contributions from co-eluting species, the elemental composition of the sequences to compute theoretical isotopic distributions for the determination of peak positions, and curve fitting to calculate the ratios. Peptides with charges greater than 3, false discovery rates greater than 3%, 18O/16O ratios less than 0.1 or greater than 10, and reversed sequences were omitted from further analysis.
Relative Quantification of Differentially Labeled Peptides by Triple Quadrupole Mass Spectrometry Using Selective Reaction Monitoring
The Agilent 6430 Triple Quad QQQ LC/MS system consisted of an autosampler, a binary capillary flow pump, an Agilent 1200 Series nano-pump, and an Agilent Chip Cube LC/MS interface (Palo Alto, CA). 5 μl of sample containing 0.5 μg of protein was loaded onto the HPLC-microfluidics chip featuring a 160-nl trapping column and 75 μm × 150 mm separation column containing C18 (5 μm Zorbax) particles as both the trapping and the separation medium. Mobile phase A consisted of 98%/2%/0.1% water/ACN/formic acid, and mobile phase B was composed of 10%/90%/0.1% water/ACN/formic acid. A sample was loaded and washed using the capillary pump with a flow rate of 4 μl/min of 100% mobile phase A. The LC gradient was delivered with the nano-pump at 350 nl/min as follows: 3% B at 0 min, 12% B at 3 min, 35% B at 27 min, 55% B at 29 min, 90% B at 30 min, 90% B at 34 min, 3% B at 35 min, and 7 min post time at 3% B. The spray voltage was 1750 V with drying gas at 4 l/min and a gas temperature of 365 °C. To perform the multiple reaction monitoring measurement, the collision energy voltage was individually optimized to the peptides using Skyline software for guidance. Data analysis was performed using Agilent Mass Hunter Qualitative and Quantitative Analysis Software (Palo Alto, CA).
Development of Candidate SRM Assays Using 18O/16O-labeled Samples
We used the stable isotope differential labeling method to develop SRM. Precursor and product ions predicted by Skyline that were unique to the human ApoA1 isoform were selected with mainly y ions, a +2 charge state, a length of 8 to 25 residues, and the absence of missed tryptic cleavages as well as chemically active amino acid residues (such as cysteine or methionine), with no basic amino acids on either side of the cleavage site of the peptide sequence. The target candidate peptides (DLATVYVDVLK, WQEEMELYR, and VSFLSALEEYTK) and nine product ions (three from each peptide) were validated empirically for ApoA1 in human serum. The retention time, dwell time, fragmentation energy, and collision energy were individually optimized. Using samples from crude serum and ProteoMiner enrichment, 0.5 μg each of HCV (16O) and HCC (18O) sample were mixed and analyzed via triple quadrupole MS. The 18O/16O ratios were calculated by taking the area under the curve for all three transitions for each of the three precursor ions from runs analyzing individual peptides and also as segmented SRM.
SRM Assays Using AQUA Peptides
100 μg each of HCV and HCC crude serum sample was mixed with 10,000 fmol of internal standard (final 1 μg protein contained 100 fmol standard) and trypsinized. Internal standard AQUA peptides were commercially synthesized incorporating isotopically labeled arginine (Arg(13C615N4)) and lysine (Lys(13C615N2)) to 99% isotopic enrichment (ThermoFisher) and HPLC-purified to >98% purity. Trypsin-digested mouse serum served as a matrix for preparing calibration curves because the SRM peptides from human ApoA1 were not in mouse ApoA1 based on a BLAST search that we confirmed empirically via SRM of mouse serum analyzing precursor and transition ions with no interfering signals or co-eluting peptides. AQUA peptide stocks (5 pmol/μl) were diluted to 1,000 fmol/μl in 2% ACN, 98% H2O, 0.1% TFA and then serially diluted to 10 calibration points (1, 10, 25, 50, 100, 200, 400, 600, 800, and 1,000 fmol/μl) containing a 100-fmol fixed concentration of the internal standards and 0.5 μg of mouse matrix tryptic peptides in 5 μl. For samples, 0.5 μg of tryptic peptides in 5 μl contained 100 fmol internal standard. Processing variability using internal standards showed day-to-day reproducibility within ±5% with an instrument reproducibility of ±1%.
Western Blotting
Western blotting was performed on crude serum proteins from 24 HCV patients and 26 HCC patients. 50 μg of crude serum from each patient was separated on 4–20% SDS-PAGE gels and transferred to low-fluorescent PVDF membranes. After blocking with 2% ECL prime blocking agent (GE Healthcare), filters were probed with mouse anti-human ApoA1 monoclonal antibodies (1:500, Cell Signaling) overnight at 4 °C, washed, and probed with Cy3-labeled goat anti-mouse secondary antibody (1:1,000, GE Healthcare) for 1 h at room temperature. Images of membranes were captured using a Typhoon Trio Variable Mode Imager (GE Healthcare) and analyzed using Image Quant software, IQTL (GE healthcare). Normal human serum containing endogenous ApoA1 was run in each gel as an internal standard for normalizing samples within each gel.
RESULTS
Study Population
For each patient, clinical data including age, sex, cause of disease, and staging of the chronic liver disease were collected. For patients with HCC, AFP measurement, size of tumors, and histoprognostic features (grade of differentiation) were available retrospectively. The characteristics of the patients used for two-dimensional DIGE and the patients used for SRM quantification of ApoA1 are presented in Table I and supplemental Table S1, respectively. The populations were studied following the flow chart shown in supplemental Fig. S1.
Table I. Patient history for two-dimensional DIGE experiment. Patients 1–6 in HCV group were paired with patients 1–6 in HCC group.
| Samples | Gel ID | Gender | Age | Diagnosis |
|---|---|---|---|---|
| HCV Group | ||||
| HCV1 | Gel1-HCV1/HCC1 | M | 35 | Fibrosis stage 2 |
| HCV2 | Gel2-HCV2/HCC2 | M | 64 | Fibrosis stage 2 |
| HCV3 | Gel3-HCV3/HCC3 | M | 52 | Fibrosis stage 2 |
| HCV4 | Gel4-HCV4/HCC4 | M | 32 | Fibrosis stage 0 |
| HCV5 | Gel5-HCV5/HCC5 | M | 54 | Fibrosis stage 3 |
| HCV6 | Gel6-HCV6/HCC6 | M | 56 | Fibrosis stage 2 |
| HCC Group | ||||
| HCC1 | Gel1-HCV1/HCC1 | M | 45 | Radiologically identified (entire right lobe suggestive of liver cancer) (AFP > 200,000 ng/ml) |
| HCC2 | Gel2-HCV2/HCC2 | M | 58 | Poorly differentiated HCC (AFP 29.8 ng/ml) |
| HCC3 | Gel3-HCV3/HCC3 | M | 55 | Radiologically identified (15 cm × 11 cm mass) HCC (AFP 4160 ng/ml) |
| HCC4 | Gel4-HCV4/HCC4 | M | 53 | Radiologically identified (9.3 cm × 7.4 cm × 10 cm mass) HCC (AFP 288 ng/ml) |
| HCC5 | Gel5-HCV5/HCC5 | M | 62 | Radiologically identified (3.0 cm × 3.1 cm × 3.2 cm mass) HCC (AFP 644 ng/ml) |
| HCC6 | Gel6-HCV6/HCC6 | M | 50 | Radiologically identified (3.8 cm × 3.1 cm × 3.6 cm mass) HCC (AFP 79 ng/ml) |
Two-dimensional Gel and Mass Spectrometry Identification of Differentially Expressed Proteins
Proteomic analysis of human serum presents many technical challenges. High-abundance proteins present in complex biological samples such as serum make the detection of medium- and low-abundance proteins extremely challenging, if not impossible. We used ProteoMiner enrichment technology (Bio-Rad) to reduce this challenge. A major advantage of this technology is that the complexity of the majority of the serum proteome is fully retained through the use of a large, highly diverse hexa bead-based library of combinatorial peptide ligands. When complex biological samples are applied to the beads, the high-abundance proteins saturate their high-affinity ligands and excess protein is washed away. In contrast, the medium- and low-abundance proteins are concentrated on their specific affinity ligands. This increases the dynamic range of detectable proteins while maintaining representation of nearly all proteins within the original sample.
Two-dimensional PAGE combined with post-staining has proven to be an effective approach for the identification of biomarkers. However, two-dimensional DIGE shows additional advantages over traditional two-dimensional PAGE in several aspects, including pre-labeling of samples before processing, the introduction of a pooled internal standard, co-detection of proteins in two samples with an internal standard, and a wider dynamic range. When applied to the identification of differentially expressed proteins, two-dimensional DIGE also saves time, reduces the number of errors caused by gel-to-gel variability, and eliminates the need for technical replicates, thereby increasing the precision of spot quantification and simplifying data analysis and integration.
In this study, we evaluated differential protein expression in a pair-wise manner from six HCV and six HCC serum samples (12 samples from six gels) via analytical two-dimensional DIGE with Decyder spot analysis. For these six pairs of biological replicates, the internal standard was composed of all 12 samples. A pseudocolor map of representative superimposed Cy3 (HCV), Cy5 (HCC), and Cy2 (pooled internal standard) two-dimensional DIGE images for one pair of samples is shown in Fig. 1. Between 4,000 and 5,000 spots were detected in each gel. For the circled spot within the boxed region, the individual fluorescence channels are shown in the circled images below. Fig. 2A shows the equivalent region of all six gels for the 12 samples (HCV, left; HCC, right). Decyder spot volumes of one spot within this region showed an average fold change of −2.45 (p < 0.00043) in HCC relative to HCV (Fig. 2B). Having identified a candidate differentially expressed spot, we next sought the identity of the spot from the same six pairs of HCC and HCV patients using preparative two-dimensional PAGE with SyproRuby staining (see the representative pair in Fig. 3A). The spots shown in all six gels (Fig. 3B) were trypsinized, and peptides were subjected to MALDI-TOF-MS. From each spot in each gel, TurboSequest identified ApoA1 with the highest expectation score with UniProt Accession Number P02647, molecular weight = 30,758.9 Da, pI = 5.56, and protein score confidence interval CI % 100 (Fig. 3C). This identification was verified via nano-LC-MS/MS of gels 2, 3, and 4 (not shown).
Fig. 1.

Two-dimensional DIGE composite pseudocolor image of one pair of HCC and HCV samples with internal standard. Green: HCV labeled with Cy3. Red: HCC labeled with Cy5. Blue: pooled internal standard labeled with Cy2. Inset: Individual channels of Cy2, Cy3, and Cy5 for an individual spot.
Fig. 2.
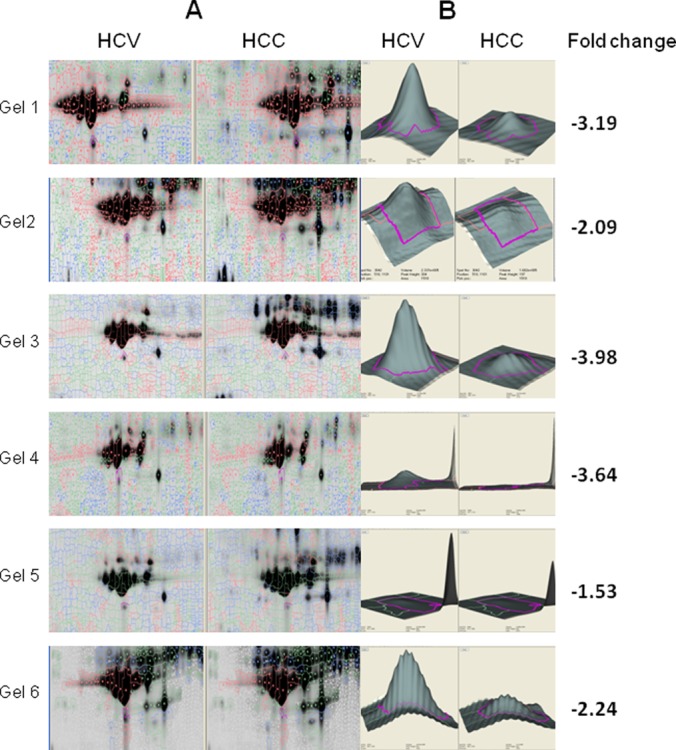
Differential expression of a spot in six gels containing samples from pairs of HCC and HCV patients. A, gel images for HCV and HCC samples in boxed area in Fig. 1. B, spot volumes for HCV and HCC samples from expanded, circled spot in Fig. 1 with fold changes with an average decrease of −2.45-fold in HCC. p < 0.00043.
Fig. 3.
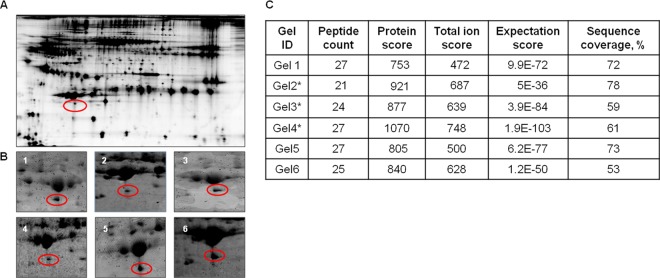
Preparative two-dimensional gel analysis of differentially expressed proteins. A, SyproRuby image of a representative two-dimensional preparative gel showing one circled differentially expressed spot. B, zoomed views of each individual preparative gel matching the differentially expressed spot (circled) from analytical two-dimensional DIGE. C, MALDI-TOF-MS analysis of spots circled in B identified ApoA1. *Independent Orbitrap analysis of the same spot from these three gels verified the identification of ApoA1.
Confirmation of Differential Expression of ApoA1 Using Zoom Scans of Stable-isotope-labeled 18O/16O Samples
Having determined that the differentially expressed spot was ApoA1, we independently contained it using several distinct analytical mass spectrometry approaches. First, we used stable isotope differential labeling to prepare 18O-labeled tryptic peptides from HCC4 that were mixed with normal 16O-containing peptides from HCV4. Immediately following cleanup, peptides from the two samples were pooled and the mixture was subjected to nano-LC-MS/MS on an LTQ linear ion trap mass spectrometer with zoom scans for relative quantification of 18O and 16O peptide pairs using an in-house-developed algorithm, MassXplorer (16). The relative abundance ratios obtained using zoom scans of these three ApoA1 peptides were 0.64, 0.83, and 0.82 for HCV4 compared with HCC4 (Fig. 4A). The average of these three measures yielded a composite ApoA1 protein ratio of 0.76. MS/MS fragmentation identified these peptides as DLATVYVDVLK, WQEEMELYR, and VSFLSALEEYTK, all from ApoA1 (Fig. 4B). These ratios were independently confirmed by using SRMs where the relative abundance ratios between HCC4 and HCV4 were 0.78, 0.79, and 0.76 for DLATVYVDVLK, WQEEMELYR, and VSFLSALEEYTK, respectively, yielding a composite ApoA1 protein ratio of 0.77 (supplemental Table S2, supplemental Figs. S2A–S2D). In triplicate analyses of two pairs of patient samples, the 18O/16O ratios of differential expression of the average of each individual peptide were highly reproducible (Table II), yielding ratios for total ApoA1 protein of 0.77 for HCV4/HCC4 and 0.73 for HCV7/HCC7. Finally, as a quality control, normal serum was split into two equivalent pools, differentially labeled, mixed, and analyzed via SRM, yielding a ratio of 1.0, which confirmed the reproducibility of the ratio determinations (supplemental Table S3A). The retention time, product ion, precursor ion, and area under the curve for each transition are shown in supplemental Table S3B.
Fig. 4.

Differential expression of ApoA1. A, HCC4 tryptic peptides were labeled with 18O-water using stable isotope technology and mixed with HCV4 tryptic peptides labeled with 16O-water. We then used LC-MS/MS on an LTQ mass spectrometer with zoom scans to quantify differentially expressed peptides. Brackets indicate isotopic envelopes of naturally occurring variants. B, MS/MS fragmentation was performed to identify peptides corresponding to ApoA1: DLATVYVDVLK 1 and 2, WQEEMELYR 3 and 4, and VSFLSALEEYTK 5 and 6.
Table II. Relative quantification via selective reaction monitoring of peptides from ApoA1 using 18O/16O labeling. Three ApoA1 peptides from two sets of HCV and HCC patients and a normal control were analyzed in triplicate (peptide ratio). The average peptide ratio for each of three different peptides is shown, as well as the total ApoA1 protein ratio. Normal control serum served as a quality control. Values are mean ± S.D.
| Peptide sequence (ApoAl) O18/O16 | Peptide Ratio 18O/16O | Average peptide ratio 18O/16 O | Total ApoA1 protein ratio |
|---|---|---|---|
| HCV4 and HCC4 | |||
| 0.778 | |||
| DL ATVYVDVLK | 0.781 | 0.78 ± 0.003 | |
| 0.786 | |||
| 0.785 | 0.77 ± 0.01 | ||
| WQEEMELYR | 0.799 | 0.79 ± 0.006 | |
| 0.786 | |||
| 0.762 | |||
| VSFLSALEEYTK | 0.760 | 0.76 ± 0.0009 | |
| 0.762 | |||
| HCV7 and HCC7 | |||
| 0.729 | |||
| DL ATVYVDVLK | 0.724 | 0.72 ± 0.002 | |
| 0.729 | |||
| 0.779 | 0.73 ± 0.07 | ||
| WQEEMELYR | 0.786 | 0.78 ± 0.008 | |
| 0.800 | |||
| 0.690 | |||
| VSFLSALEEYTK | 0.705 | 0.70 ± 0.009 | |
| 0.712 | |||
| Normal control (S1/S2) | |||
| 1.093 | |||
| DL ATVYVDVLK | 1.117 | 1.1 ± 0.280 | |
| 1.159 | |||
| 1.091 | |||
| WQEEMELYR | 1.094 | 1.0 ± 0.009 | 1.0 ± 0.1 |
| 1.108 | |||
| 0.980 | |||
| VSFLSALEEYTK | 0.980 | 0.9 ± 0.00 | |
| 0.980 |
Confirmation of Differential Expression of ApoA1 Using SRMs of Differentially Labeled 18O/16O Samples
HCC peptides labeled with 18O and HCV peptides with endogenous 16O were analyzed from both crude serum and ProteoMiner-enriched samples. Using the three optimal peptides found in the initial identification of ApoA1 from the gel spot that was subsequently confirmed by zoom scans and predicted by Skyline, we performed quantification using triple quadrupole SRMs with the parameters indicated (supplemental Table S4). The three precursor peptides from ApoA1 were detected in the total ion current (TIC) using segmented SRMs for crude serum and the ProteoMiner-enriched sample (Fig. 5A). The three product ions from each precursor showed a decrease in HCC compared with HCV (Fig. 5B, supplemental Tables S5A–S5C). The signal intensity for the precursor TIC and the product areas were smaller for the crude serum than for the enriched ProteoMiner samples, confirming both the enrichment of ApoA1 and decreased expression in HCC relative to HCV.
Fig. 5.

Quantification of ApoA1 peptides via SRM. A, segmented SRM of ApoA1 (HCC7/HCV7: 18O/16O labeled sample) using crude serum (left) and ProteoMiner-enriched serum (right). The first segment from 12–18 min represents the elution profile of the WQEE-containing peptide, the second segment from 18–25 min the DLAT-containing peptide, and the last segment from 25–35 min the VSFL-containing peptide. B, area under the peak for all three product ions from a single precursor. 1, 2, and 3 are the three transitions (product ions) from the DLATVYVDVLK peptide; 4, 5, and 6 are from WQEEMELYR; and 7, 8, and 9 are from VSFLSALEEYTK.
Absolute Quantification of ApoA1 Expression Using AQUA
SRM technology enables the identification and quantification of proteins in complex mixtures, providing a sensitive and selective tool with which to validate candidate biomarkers in a disease process. Because human ApoA1 was obviously present in the endogenous human patient serum samples, we used mouse serum as a matrix for the internal standards, as the three peptides from human ApoA1 were absent from mouse ApoA1. We performed SRM for the three transition products from each of the three precursor peptides on 50 patient serum samples to calculate the amount of ApoA1 in each. From standard curves with excellent correlation coefficients (Fig. 6A), we found that the ratios of HCC/HCV were 0.62 (DLATVYVDVLK), 0.65 (WQEEMELYR), and 0.73 (VSFLSALEEYTK), with highly significant p values (Fig. 6B). Quantification of each of the three unique peptides of ApoA1 (supplemental Table S6) in individual patients is provided in supplemental Figs. S3A–S3C.
Fig. 6.

AQUA quantification of ApoA1 using SRM. A, standard curves performed in mouse matrix used to calculate amounts of endogenous peptides in human patient samples. B, clinical groups (24 HCV, 26 HCC) differed in absolute amounts of ApoA1 peptides.
Validation of Differential ApoA1 Expression by Western Blotting
To further validate results from two-dimensional DIGE, ion trap zoom scans and triple quadrupole SRM mass spectrometry of stable isotope samples, and SRM quantification in 50 patient samples, we measured relative ApoA1 expression via Western blotting of 24 HCV and 26 HCC patient samples. Analysis of a subset of samples (Fig. 7A) reflected Western blotting results for the individual patients in the entire dataset (supplemental Figs. S4A and S4B). Expression in the HCC group was 69% of that of the HCV group, with high significance (Fig. 7B). Thus Western blotting strongly supported the down-regulation of ApoA1 in the HCC patient cohort relative to the HCV cohort as determined via SRM (Fig. 8). In an individual comparison of two patients (HCV4 and HCC4), the down-regulation of ApoA1 was similar for absolute SRM, SRM of differentially stable isotope-labeled samples, and Western blotting, further illustrating the concordance of these various measurements and validating the SRM approach (supplemental Fig. S5). Finally, analysis of individual patient levels of the three SRM peptides and Western blotting showed substantial overlap among the patients but similar relative expression results for any individual patient (supplemental Fig. S6).
Fig. 7.
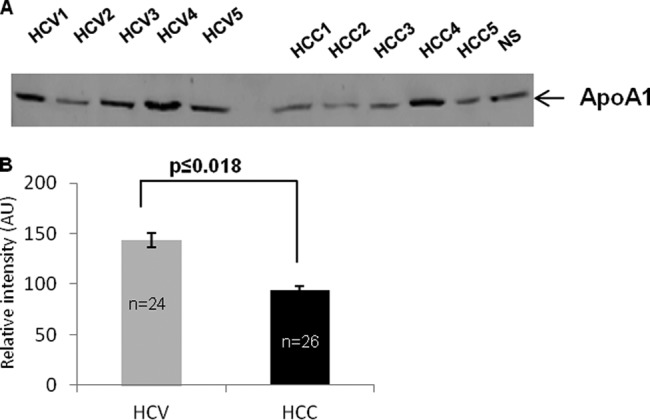
Validation of reduced expression of ApoA1 in HCC relative to HCV by Western blot analysis. A, a subset of five HCV and five HCC samples were analyzed via Western blotting for ApoA1 including a normal serum control (NS). B, relative expression of ApoA1 in the entire set of patients. p value of Pearson chi-squared test.
Fig. 8.
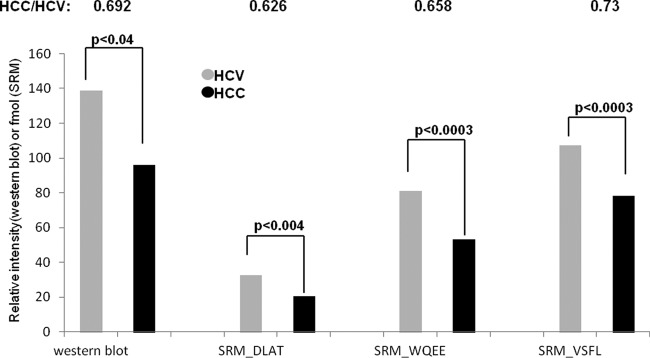
Average ratio between 50 samples (24 HCV and 26 HCC) using Western blot for ApoA1 and SRM for three unique peptides of ApoA1.
Assessment of ApoA1 SRM to Discriminate HCV from HCC Using Receiver Operating Characteristic Curves
To determine the potential impact of the use of ApoA1 as a biomarker for discriminating between HCV and HCC patients, the Western blot results for ApoA1 and the absolute SRM quantification data of the three unique peptides of ApoA1 were used to generate receiver operating characteristic curves. The area under the curve (AUC) was determined for each value alone to determine which individual SRM-quantified peptide or total Western-quantified protein yielded the greatest discriminatory power within this patient set (Fig. 9). The peptides WQEEMELYR and VSFLSALEEYTK were found to have the highest discrimination (AUCs = 0.79 and 0.79, respectively) relative to DLATVYVDLK and Western blot (AUCs = 0.73 and 0.71, respectively).
Fig. 9.

Receiver operating characteristic curves for the differentiation of HCC from HCV using the candidate biomarker ApoA1. The area under the curve (AUC) for each assay is presented in the inset.
DISCUSSION
The aim of this study was to develop a discovery and validation strategy for new biomarkers in HCC and HCV patients. We began with aptamer reduction of abundant proteins and two-dimensional DIGE, a powerful technique that can be used to identify proteins with differential expression between complex serum samples. According to a recent statistical study, a minimum of four biological replicates is needed to identify at least a 2-fold difference in DIGE studies employing serum (19). Using more stringent criteria, we used six pairs of biological replicates in the aptamer two-dimensional DIGE platform to reveal 24 protein spots that were differentially expressed (11 decreased and 13 increased) between HCC and HCV patients. Spots with a statistical significance of p < 0.05 at a threshold of >1.5-fold change were identified via LC-MS/MS. One of the spots was identified as ApoA1 and was down-regulated across the original six pairs of samples by 2.45-fold, equal to a ratio of 0.42, in HCC relative to HCV. To validate this observation, we used 18O-water differential stable isotope labeling and relative quantification by means of LTQ ion trap two-dimensional LC-MS/MS with zoom scans as we previously reported (15, 16, 18). Expression levels between a randomly chosen pair of HCC and HCV samples gave a composite ApoA1 protein ratio of 0.76 from three peptides unique to ApoA1. We further validated the two-dimensional DIGE results by analyzing the same pair of HCC and HCV samples using triple quadrupole LC-MS/MS and found a composite ApoA1 protein ratio of 0.77 from the same three peptides unique to ApoA1. The concordance of these ratios as determined using independent methodologies attests to the accuracy of the values and confirms that the inexpensive 18O-water stable isotope labeling is an effective and accurate method for the validation of candidate biomarkers where numerous samples need to be analyzed concurrently.
HCC is one of the fifth most common malignancies worldwide and ranks third most common among cancers as a cause of death worldwide (20). The projected increase in new HCC cases in the United States is due mainly to latent HCV infections in the general population, with the onset of HCC coming several decades after initial infection. Furthermore, the increasing incidence and poor prognosis of patients with HCC emphasizes the need for the identification of early detection biomarkers for HCC. Ultrasonography and serological testing are generally recommended for HCC surveillance; however, small hepatic nodules less than 2 cm often do not exhibit the overt radiological features of HCC and often are associated with negative findings on serological testing (21). Using biopsied and histopathologically tested samples to discriminate early HCC from benign nodules can be difficult even for expert pathologists. The two newer serological biomarkers, des-γ-carboxyprothrombin and AFP-L3, fared no better than AFP, as their elevation was nonspecifically common in patients without HCC and was influenced by race, gender, age, and severity of liver disease. Therefore, it was concluded that AFP, AFP-L3, and des-γ-carboxyprothrombin lack the sensitivity, specificity, and predictive value required for routine HCC surveillance (22). Only AFP was measured in our samples, and it did not correlate with ApoA1, tumor burden, or disease stage. Therefore, novel biomarkers that are reliable, reproducible, sensitive, and specific for the early detection of HCC would provide significant clinical benefit and are desperately needed. Despite the identification of numerous candidate biomarkers, further verification of the candidates in many samples constitutes a rate-limiting step in the biomarker pipeline. Typically, conventional verification methods such as Western blotting and enzyme-linked immunosorbent assays (ELISA) are not suitable for large-scale analysis because of a lack of throughput and/or the cost of producing or acquiring appropriate monoclonal antibodies with the requisite specificities.
This study demonstrated an important proof-of-principle highlighting the value of a proteomic profiling approach allowing one to successfully discover candidate serum biomarkers and to validate and quantify them in crude serum, which is often the rate-limiting step in the advancement of biomarker development. Over the past several years, many proteins have been proposed as potential biomarkers for various cancers without further evaluation of their clinical utility. The lack of follow-up is due, to a large extent, to the lack of technology for the expedient, reproducible, and accurate verification of the proteins as biomarkers. Without the identification and validation of biomarkers, the practical application of this approach is limited. Once the markers have been identified, they must be validated using a reliable assay and an independent cohort in a prospective or longitudinal study. Stable-isotope dilution multiple reaction monitoring mass spectrometry is a novel technique whereby the quantification of a protein can be calculated from isotopically labeled peptide internal standards of known concentrations that correspond to the protein of interest (23). With two to five peptides per protein, the concentration of the protein of interest can be accurately determined. Further, the technique can be multiplexed to allow for the simultaneous measurement of many proteins.
Recent developments in SRM-based targeted proteomics show promise for accelerating the hypothesis testing of multiple biomarker candidates in large cohorts of patient specimens. The aim of this study was the generation of a resource employing high-quality SRM assays for the detection and quantification of cancer-associated proteins to assist and accelerate the verification of HCC candidate biomarkers in clinical specimens and to establish and validate a proteome-based minimally invasive method for the detection of early HCC.
Selected reaction monitoring is a powerful tandem mass spectrometry method that can be used to monitor target peptides, including post-translationally modified peptides, within a complex protein digest. The specificity and sensitivity of the approach, as well as its capability to multiplex the measurement of many analytes in parallel, has made it a technology of particular promise. An underappreciated step in the development of an assay to measure many peptides in parallel is the time and effort necessary to establish a reliable assay. Using the selectivity of multiple stages of mass selection of precursor and product ions by a triple quadrupole mass spectrometer, each of these targeted SRM assays is the mass spectrometry equivalent of a peptide-based quantitative ELISA. Further, targeted SRM assays can be multiplexed in quantitative assays, which can be more directly applicable to clinical settings.
Targeted proteomics workflows based on SRM on triple quadrupole mass spectrometry platforms show the potential for the rapid verification of biomarker candidates in plasma by using heavy isotope-labeled internal standards to close the gap between discovery and validation in the biomarker pipeline. SRM has demonstrated selectivity, reproducibility, and sensitivity for a range of multiplexed protein assays and has potential for quantifying protein isoforms and post-translational modifications for which good-quality antibodies often do not exist. Current SRM assays offer sensitivity for low nanogram-per-milliliter detection of plasma proteins. However, antibody reagents with sufficient specificity for the target proteins or their peptides are generally not available, and the development of such reagents is expensive and time consuming. The capacity of SRM for multiplexed, high-throughput analysis, together with its sensitivity and quantification, positions SRM as a promising application in medical screening (24, 25).
Apolipoprotein A1, primarily expressed in the liver and intestinal cells, is a major component of high-density lipoproteins in serum/plasma and is known to suppress neutrophil activation and inhibit endothelial expression of adhesion molecules (26). It also blocks the contact-mediated activation of monocytes by T lymphocytes by inhibiting the production of interleukin-1β and tumor necrosis factor-α (27). A decrease in ApoA1 and high-density lipoprotein therefore allows the uninhibited production of interleukin-1β and tumor necrosis factor-α during inflammation. Moreover, because these proteins are related to the inflammatory process, ApoA1 will serve as a good biomarker for monitoring the response to therapy, and thus its decrease may lead to HCC.
We used a systematic strategy to develop and validate SRM assays for ApoA1. First, we used 18O/16O-labeled samples for relative quantification. Once the SRM assays were developed, we used a larger set of clinical populations of 50 samples (24 HCV and 26 HCC) and performed SRM using AQUA peptides for absolute quantification. To ensure that the calculated expression ratios were accurate, we spiked the AQUA peptides in the samples before processing to overcome any variable loss during processing by normalizing to the internal standard. We ran quality controls between every standard curve and performed reproducibility checks for processing variability on different days and on different runs. The results of the absolute quantitation showed that the decrease in the three unique peptides of ApoA1 was significant and consistent between the samples, suggesting that ApoA1 might be an important member of a novel biomarker panel for HCC. Down-regulation of ApoA1 was also confirmed on a clinical population of 50 samples (24 HCV and 26 HCC) by Western blotting, and the decrease of ApoA1 in HCC serum samples relative to the HCV serum samples was consistent with the results of the other independent approaches. We also showed reliable receiver operating characteristic curves with AUC values of 0.73, 0.79, 0.79, and 0.71 for DLATVYVDVLK, WQEEMELYR, VSFLSALEEYTK, and Western blotting, respectively.
Our data have yielded accurate information about the proteomic alterations of ApoA1 in HCC serum samples, which in turn may help shed light on understanding the mechanism of HCC carcinogenesis. We can confidently say that the general HCC patient population has a decreased level of ApoA1 relative to HCV patients. Although our findings indicate that one can discriminate between the two patient populations based on ApoA1 levels, the overlap of values will preclude ApoA1's use as a stand-alone biomarker. Using aptamers to enrich lower abundance proteins ∼30-fold combined with two-dimensional DIGE, we have discovered many additional candidate biomarkers. Although ApoA1 was initially chosen for these proof-of-concept studies because it is relatively abundant, two-dimensional DIGE led to the detection and quantification of proteins with ∼1% the abundance of ApoA1, thus extending this approach to much lower abundance proteins. Furthermore, the sensitivity and wide dynamic range of SRM assays will be readily capable of measuring such lower abundance proteins in crude serum samples. With the development of SRM assays for additional candidate biomarkers identified in our two-dimensional DIGE screen using the rigorous approach applied to ApoA1, a composite biomarker panel with the requisite sensitivity and specificity to accurately diagnose early stage HCC using blood samples is envisioned.
Supplementary Material
Acknowledgments
We thank the Proteomics core unit at UTMB for assistance with the protein identification.
Footnotes
* This work was supported by grants from the National Institutes of Environmental Health Sciences (R01ES007800 and P30ES006676 to C.J.E.), the Mary Gibbs Jones Endowment (C.J.E.), the National Center for Research Resources (S10RR027656 to L.D.), the Miriam and Emmett McCoy Foundation (L.D.), the UTMB Clinical and Translational Sciences Award (ULITR000071), and USPHS Grant No. M01 RR00073 (J.P.R.).
 This article contains supplemental material.
1 The abbreviations used are:
- ACN
- acetonitrile
- AFP
- α-fetoprotein
- DIGE
- difference gel electrophoresis
- HCC
- hepatocellular carcinoma
- HCV
- hepatitis C virus
- MALDI
- matrix-assisted laser desorption ionization
- SRM
- selective reaction monitoring.
REFERENCES
- 1. Kassahun W. T., Fangmann J., Harms J., Hauss J., Bartels M. (2006) Liver resection and transplantation in the management of hepatocellular carcinoma: a review. Exp. Clin. Transplant 4, 549–558 [PubMed] [Google Scholar]
- 2. Bosch F. X., Ribes J., Diaz M., Cleries R. (2004) Primary liver cancer: worldwide incidence and trends. Gastroenterology 127, S5–S16 [DOI] [PubMed] [Google Scholar]
- 3. World Health Organization, New York, (2012) Fact Sheet No. 1674
- 4. Anthony P. P. (2001) Hepatocellular carcinoma: an overview. Histopathology 39, 109–118 [DOI] [PubMed] [Google Scholar]
- 5. Gebo K. A., Chander G., Jenckes M. W., Ghanem K. G., Herlong H. F., Torbenson M. S., El-Kamary S. S., Bass E. B. (2002) Screening tests for hepatocellular carcinoma in patients with chronic hepatitis C: a systematic review. Hepatology 36, S84–S92 [DOI] [PubMed] [Google Scholar]
- 6. Sherman M. (2001) Alphafetoprotein: an obituary. J. Hepatol. 34, 603–605 [DOI] [PubMed] [Google Scholar]
- 7. Daniele B., Bencivenga A., Megna A. S., Tinessa V. (2004) Alpha-fetoprotein and ultrasonography screening for hepatocellular carcinoma. Gastroenterology 127, S108–S112 [DOI] [PubMed] [Google Scholar]
- 8. Nguyen M. H., Keeffe E. B. (2002) Screening for hepatocellular carcinoma. J. Clin. Gastroenterol. 35, S86–S91 [DOI] [PubMed] [Google Scholar]
- 9. Ardekani A. M., Liotta L. A., Petricoin E. F., 3rd (2002) Clinical Potential of Proteomics in the Diagnosis of Ovarian Cancer. Expert Rev Mol Diagn 2, 312–320 [DOI] [PubMed] [Google Scholar]
- 10. Anderson N. L., Anderson N. G. (2002) The human plasma proteome: history, character, and diagnostic prospects. Mol. Cell. Proteomics 1, 845–867 [DOI] [PubMed] [Google Scholar]
- 11. Anderson N. L., Polanski M., Pieper R., Gatlin T., Tirumalai R. S., Conrads T. P., Veenstra T. D., Adkins J. N., Pounds J. G., Fagan R., Lobley A. (2004) The human plasma proteome: a nonredundant list developed by combination of four separate sources. Mol. Cell. Proteomics 3, 311–326 [DOI] [PubMed] [Google Scholar]
- 12. Cho W. C. (2007) Contribution of oncoproteomics to cancer biomarker discovery. Mol. Cancer 6, 25. [DOI] [PMC free article] [PubMed] [Google Scholar]
- 13. Paulovich A. G., Whiteaker J. R., Hoofnagle A. N., Wang P. (2008) The interface between biomarker discovery and clinical validation: the tar pit of the protein biomarker pipeline. Proteomics Clin. Appl. 2, 1386–1402 [DOI] [PMC free article] [PubMed] [Google Scholar]
- 14. Karp N. A., Lilley K. S. (2005) Maximising sensitivity for detecting changes in protein expression: experimental design using minimal cydyes. Proteomics 5, 3105–3115 [DOI] [PubMed] [Google Scholar]
- 15. Starkey J. M., Zhao Y., Sadygov R. G., Haidacher S. J., Lejeune W. S., Dey N., Luxon B. A., Kane M. A., Napoli J. L., Denner L., Tilton R. G. (2010) Altered retinoic acid metabolism in diabetic mouse kidney identified by O isotopic labeling and 2D mass spectrometry. PLoS One 5, e11095. [DOI] [PMC free article] [PubMed] [Google Scholar]
- 16. Sadygov R. G., Zhao Y., Haidacher S. J., Starkey J. M., Tilton R. G., Denner L. (2010) Using power spectrum analysis to evaluate (18)O-water labeling data acquired from low resolution mass spectrometers. J. Proteome Res. 9, 4306–4312 [DOI] [PMC free article] [PubMed] [Google Scholar]
- 17. Wu P., Zhao Y., Haidacher S. J., Wang E., Parsley M. O., Gao J., Sadygov R. G., Starkey J. M., Luxon B. A., Spratt H., Dewitt D. S., Prough D. S., Denner L. (2013) Detection of structural and metabolic changes in traumatically injured hippocampus by quantitative differential proteomics. J. Neurotrauma 30, 775–788 [DOI] [PMC free article] [PubMed] [Google Scholar]
- 18. Denner L. A., Rodriguez-Rivera J., Haidacher S. J., Jahrling J. B., Carmical J. R., Hernandez C. M., Zhao Y., Sadygov R. G., Starkey J. M., Spratt H., Luxon B. A., Wood T. G., Dineley K. T. (2012) Cognitive enhancement with rosiglitazone links the hippocampal PPARgamma and ERK MAPK signaling pathways. J. Neurosci. 32, 16725–16735 [DOI] [PMC free article] [PubMed] [Google Scholar]
- 19. Corzett T. H., Fodor I. K., Choi M. W., Walsworth V. L., Chromy B. A., Turteltaub K. W., McCutchen-Maloney S. L. (2006) Statistical analysis of the experimental variation in the proteomic characterization of human plasma by two-dimensional difference gel electrophoresis. J. Proteome Res. 5, 2611–2619 [DOI] [PubMed] [Google Scholar]
- 20. El-Serag H. B., Rudolph K. L. (2007) Hepatocellular carcinoma: epidemiology and molecular carcinogenesis. Gastroenterology 132, 2557–2576 [DOI] [PubMed] [Google Scholar]
- 21. Bruix J., Sherman M. Practice Guidelines Committee of the American Association for the Study of Liver Diseases (2005) Management of hepatocellular carcinoma. Hepatology 42, 1208–1236 [DOI] [PubMed] [Google Scholar]
- 22. Sterling R. K., Wright E. C., Morgan T. R., Seeff L. B., Hoefs J. C., Di Bisceglie A. M., Dienstag J. L., Lok A. S. (2012) Frequency of elevated hepatocellular carcinoma (HCC) biomarkers in patients with advanced hepatitis C. Am. J. Gastroenterol. 107, 64–74 [DOI] [PMC free article] [PubMed] [Google Scholar]
- 23. Lange V., Picotti P., Domon B., Aebersold R. (2008) Selected reaction monitoring for quantitative proteomics: a tutorial. Mol. Syst. Biol. 4, 222. [DOI] [PMC free article] [PubMed] [Google Scholar]
- 24. Keshishian H., Addona T., Burgess M., Kuhn E., Carr S. A. (2007) Quantitative, multiplexed assays for low abundance proteins in plasma by targeted mass spectrometry and stable isotope dilution. Mol. Cell. Proteomics 6, 2212–2229 [DOI] [PMC free article] [PubMed] [Google Scholar]
- 25. Zhao Y., Jia W., Sun W., Jin W., Guo L., Wei J., Ying W., Zhang Y., Xie Y., Jiang Y., He F., Qian X. (2010) Combination of improved (18)O incorporation and multiple reaction monitoring: a universal strategy for absolute quantitative verification of serum candidate biomarkers of liver cancer. J. Proteome Res. 9, 3319–3327 [DOI] [PubMed] [Google Scholar]
- 26. Brouillette C. G., Anantharamaiah G. M., Engler J. A., Borhani D. W. (2001) Structural models of human apolipoprotein a-I: a critical analysis and review. Biochim. Biophys. Acta 1531, 4–46 [DOI] [PubMed] [Google Scholar]
- 27. Hyka N., Dayer J. M., Modoux C., Kohno T., Edwards C. K., 3rd, Roux-Lombard P., Burger D. (2001) Apolipoprotein a-I inhibits the production of interleukin-1beta and tumor necrosis factor-alpha by blocking contact-mediated activation of monocytes by T lymphocytes. Blood 97, 2381–2389 [DOI] [PubMed] [Google Scholar]
Associated Data
This section collects any data citations, data availability statements, or supplementary materials included in this article.