Abstract
Impaired driving is a significant traffic safety problem, and alcohol and drugs taken before driving contribute substantially to this problem. With the increase in use of prescription medication and the decriminalization of some drugs, it has become increasingly important to understand the manifestation of driver impairment. Building upon previous alcohol research conducted at the National Advanced Driving Simulator (NADS), this study enrolled commercial bus drivers to evaluate the effect of triazolam on driving performance to assess difference between placebo, 0.125, and 0.25 mg doses in a randomized and double-blind design. On each of three randomized visits, subjects drove a simulator scenario that had previously been used to demonstrate effects of alcohol on driving performance. Plasma triazolam levels were obtained before the simulator drive. The protocol included participants receiving study medication and placebo over a 3-week period of time one to two weeks apart. The simulator drives used for this analysis occurred approximately 140 minutes after dosing—after the subjects had completed four bus simulator drives and neuropsychological tests over a 2-hour period of time surrounding dosing. The driving scenario contained representative situations on three types of roadways (urban, freeway, and rural) under nighttime driving conditions. Lane keeping performance (ability to drive straight in the lane) under the three doses of triazolam demonstrates that at the 0.25 mg dose, statistically significant effects on performance are observed, but no effects are found at the 0.125 mg level when testing at this time period after dosing. This differs from the effects of alcohol, which shows impairing effects at a 0.05% blood alcohol concentration (BAC) and a greater effect at 0.10% BAC. These results demonstrate the importance of understanding how different types of drugs affect driving performance in realistic driving environments. Although some compounds may have an effect that correlates linearly to dosage, that is not always the case. An understanding of these differences and how they vary across driving tasks is essential to developing a robust evaluation protocol that can accurately describe the effects of a wide variety of drugs on driver impairment. This information can be used to reduce the risk of deleterious effects of therapeutic medications while ensuring their safe and beneficial use.
INTRODUCTION
Driving is a complex behavior requiring coordinated central nervous and neuromuscular systems. Sensory information is taken in by the eyes, ears and body. This information is processed in the brain along with memory, cognition and executive function with subsequent signaling via the nerves to the muscles to control the vehicle.
Drugs used to treat disease or alleviate symptoms can potentially affect aspects of safe driving. Currently, over 200 million citizens are licensed to drive, and 46% of adults are prescribed at least one therapeutic medication (National Center for Health Statistics, 2009). During the 2007 roadside survey, 11% of daytime drivers had some type of central nervous system (CNS) active drug in their system; at night 14.4% of drivers had a drug present (Lacey et al., 2009). Of those with a drug present, 13.3% of daytime drivers and 16% of nighttime drivers had more than one drug in their system (Lacey et al., 2009). Medications comprised 29% of the positive results, and a combination of medications and illegal drugs comprised 5% of the positive results. The Fatality Analysis Reporting System (FARS) reported that 18% of fatally injured drivers tested positive for drugs including narcotics, depressants, stimulants, hallucinogens, cannabinoids, phencyclidines, anabolic steroids, and inhalants. Further, this percentage has been increasing over the prior five years (NHTSA, 2010). Because of the use of drugs by drivers and the resulting fatalities, we need to better understand how the drugs cause driver impairment and consider ways in which to minimize their deleterious effects.
In the past, the propensity for a medication to cause sedation has prompted the warning to not drive while using the medication or at least avoid driving until the effects of the medication are known. Beyond sedation, the drugs can alter sensory perception, cognition, executive function, memory, vigilance or neuromuscular function (Rizzo, 2003). Each of these functions can be measured and recorded by using the safety of a high-fidelity driving simulator rather than on-road experience. By comparing a pre-dose drive with the outcomes after a therapeutic dose of medication, we can assess the effects of drugs on the various CNS functions in the safety of a virtual driving environment.
Medications with activity occurring in the CNS have the potential to affect driving. Past work has elucidated reductions in some driver performance outcomes for some drugs. Antihistamines and alcohol have been most extensively researched. Older, first-generation antihistamines have greater deleterious effects on driver performance than newer, second-generation antihistamines (Kay & Logam, 2011; Weiler et al., 2000). Careful attention must be paid to the types of driving scenarios used in order to elicit the important outcomes
Benzodiazepines are an important class of CNS active agents commonly used to treat a number of human diseases. Triazolam is a member of this class of drugs with an FDA-approved indication for treating insomnia (MedlinePlus, 2011). Because of its short half-life of 2.56 hours (Friedman, Greenblatt, Burstein, Harmatz, & Shader, 1986), it is commonly prescribed for the occasional treatment of insomnia. Benzodiazepines, including triazolam, act through enhancement of the gamma-aminobutyric acid (GABA)-benzodiazepine receptor complex and cause sedation amongst other actions in the CNS (Broderick et al., 1998). Patients prescribed triazolam should be warned to avoid doing activities requiring mental acuity, including driving (MedlinePlus, 2011). Because of its short CNS activity, common use and ability to impair drivers, we chose this medication to study and compare to our data on alcohol’s effect on drivers obtained from the same simulator and using the same driving scenario.
METHODS
This paper analyzed data from two separate studies using the same simulator drive. One study focused on the effects of alcohol on driving performance and tested drivers at three BAC levels over three visits (Lee et al., 2010). The second study focused on the effects of triazolam on driving performance in a population of bus drivers at three dosage levels over three visits (Deits, Boyle, & Morrison, 2011). The subjects in the triazolam study completed three drives in a bus simulator at each visit, and a subset of the participants enrolled in that study volunteered to complete an additional drive at each visit in the NADS-1 passenger vehicle simulator configuration. The dosage levels for each study are provided in Table 1. The order of presentation for each study was counterbalanced across the visits.
Table 1.
Dosage Conditions
| Dosage | Alcohol (% BAC) | Triazolam (mg) |
|---|---|---|
| Placebo | 0.00 | 0.000 |
| Low | 0.05 | 0.125 |
| High | 0.10 | 0.250 |
Subjects
For the triazolam study, there were seven subjects ranging in age from 19 to 50 years at enrollment. To ensure good general health, all participants underwent the following clinical assessments: physical examination, which included a review of systems, gross neurologic function, cardiovascular function, respiratory function, musculoskeletal function and vital signs; and routine laboratory specimens (chemistry, hematology, urinalysis, urine drug screen, and pregnancy test for female participants).
For the alcohol study, 71 of the 108 subjects enrolled were age 50 or under at enrollment. Subjects were recruited in three age groups: 21–34, 38–51, and 55–68. Matching the upper limit of the age range for the triazolam group resulted in excluding the older age group and one person in the middle age group from the analysis. All subjects were in general good health and were screened to be moderate to heavy drinkers using the Quantity-Frequency-Variability (QFV) Survey (Cahalan, Cisin, & Crossley, 1969). Problem drinkers as identified by the Alcohol Use Disorders Identification Test (AUDIT) (Babor, De la Fuente, Saunders, & Grant, 1992) were excluded.
Procedure
For the triazolam study, subjects were consented and then underwent a screening visit that included demographic questions, a physical examination, and a blood sample for lab work. The subjects were next scheduled for a training visit that included four drives on the bus simulator. For the three study visits, which were spaced 1–2 weeks apart, subjects were transported to and from their visits, subjects provided a urine sample to test for drugs and pregnancy, and subjects underwent a breath alcohol test. Subjects then completed a brief battery of psychomotor tests. Next, subjects entered the bus simulator, completed their first drive, and then provided a saliva sample. All saliva samples were collected using the QuantisalTM oral fluid collection device (Immunalysis, Pamona CA.). Next, subjects took the study medication and waited approximately 30 minutes before their next drive. Subjects completed a total of three bus drives with the psychomotor test before the drive and a saliva sample after the drive, with each drive separated by approximately 30–35 minutes. After completing the bus drives, a plasma sample was collected (5 ml blood in green-top tube), and subjects were escorted to the NADS-1 simulator, where eye-tracking was set up. The subject then completed an approximately 35-minute simulator drive that is described below. Subjects spent the night at the University of Iowa and completed another bus simulator drive the next morning. The data from the NADS-1 drive is used in the analysis for this paper.
For the alcohol study, subjects were consented and then provided a urine sample for drug and pregnancy screen. Subjects’ heart rate and blood pressure were also checked to ensure they were in the normal range. Subjects were asked about their alcohol usage to ensure they met the qualifications as a moderate to heavy drinker without being a problem drinker. On the day of the study visit, subjects were transported to and from their visit. On arrival, subjects underwent a drug screening, a pregnancy test, and a breath alcohol test. Subjects were dosed with a mixture of vodka and orange juice to a dose above the target BAC. Subjects were monitored after dosing using an Alco Sensor IV (Intoximeters, Inc., St. Louis, MO) breath alcohol-testing instrument, until their BAC had peaked and was on the decline and within ±0.005% BAC. The subjects were then escorted to the NADS-1 simulator, and eye-tracking was set up. Following the drive, a Standardized Field Sobriety Test was performed.
Apparatus
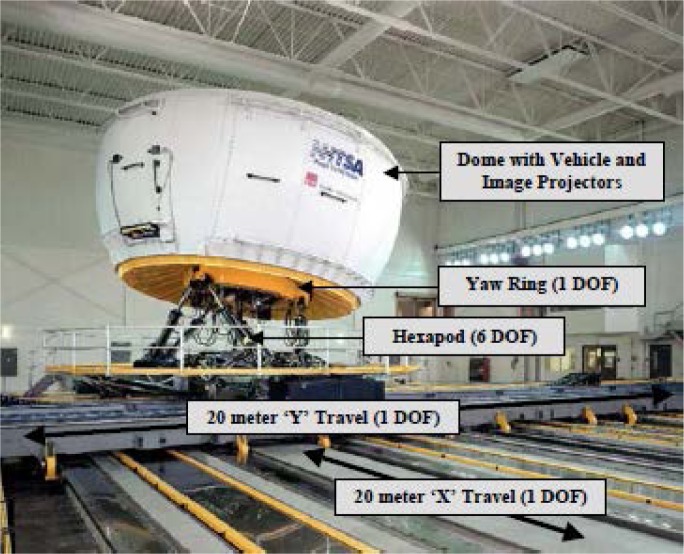
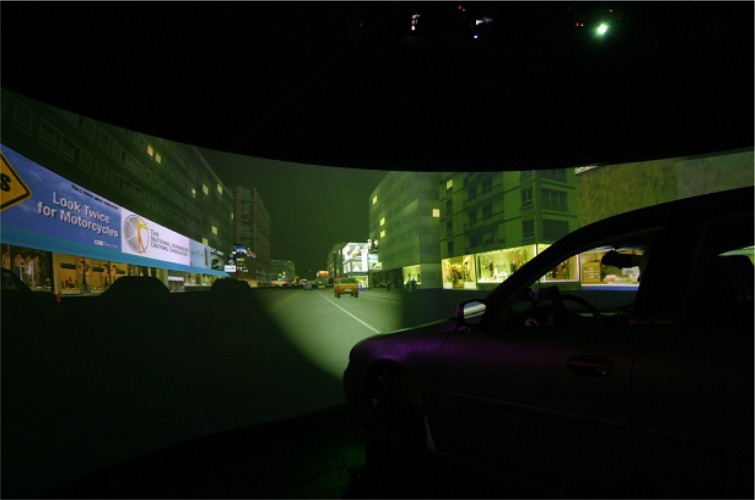
The National Advanced Driving Simulator (NADS), shown in Figure 1, made it possible to collect representative driving behavior data from drowsy drivers in a safe and controlled manner. This is the highest-fidelity simulator in the United States and allowed for precise characterization of driver response. Drivers’ control inputs, vehicle state, driving context, and driver state were captured in representative driving situations (see Figure 2).
Figure 1.
The NADS-1 high-fidelity driving simulator.
Figure 2.
An urban driving scene from the NADS-1 simulator.
Simulator Scenario
Each drive was composed of three nighttime driving segments. The drives started with an urban segment composed of a two-lane roadway through a city with posted speed limits of 25 to 45 with signal-controlled and uncontrolled intersections. This was followed by an interstate segment that consisted of a four-lane divided expressway with a posted speed limit of 70 mph. Following a period in which drivers followed the vehicle ahead, they encountered infrequent lane changes associated with the need to pass several slower-moving trucks. The drives concluded with a rural segment that was composed of a two-lane undivided road with curves followed by a gravel road segment.
Analytical methods:
Plasma triazolam concentrations were determined using a validated LC/MS method. The standard curve ranged from 0.1 to 20 ng/ml. The coefficient of variation was 14%, 10% and 5% for the low (0.8 ng/ml) mid (8 ng/ml) and high (15 ng/ml) control samples respectively. The lower limit of quantitation was 0.1 ng/ml.
Data Analysis Methods
The primary method of data analysis for this study was through the use of the SAS General Linear Models (GLM) procedure to perform an analysis of variance. The effects of dosage for subjects in the alcohol study and in the triazolam study were examined separately. As a follow-up, the Tukey was used as the multiple comparison test to identify which conditions or events differed from each other. Error bars on the graphs represent standard error. Effect size is reported in terms of Cohen’s d for the significant results. For non-significant results, the largest value for Cohen’s d is provided across the comparisons.
The dependent variables used for the analysis are the variability in lane keeping relative to the center of the lane (SDLPn) measured in cm, variability in speed relative to the speed limit ((SDSpeedn) measured in m/s, and average speed relative to the speed limit (Speedn) measured in m/s.
RESULTS
Dosing for both the alcohol and triazolam studies produced expected differences in concentrations associated with the different dosing conditions. The measured results are provided in Table 2.
Table 2.
Pre-Drive Dosing Results. Alcohol results presented in % BAC. Triazolam results presented in ng/ml.
| Alcohol Target BAC | Triazolam Dose | |||
|---|---|---|---|---|
| 0.05% | 0.10% | 0.125 mg | 0.250 mg | |
| Mean | 0.053 | 0.098 | 1.033 | 1.817 |
| StdDev | 0.005 | 0.009 | 0.345 | 0.538 |
Two types of driving results (urban and rural driving) will be discussed with a focus on lane keeping and speed measures. Results will be presented based on the ordering of these sections within the experimental drive.
Urban Driving
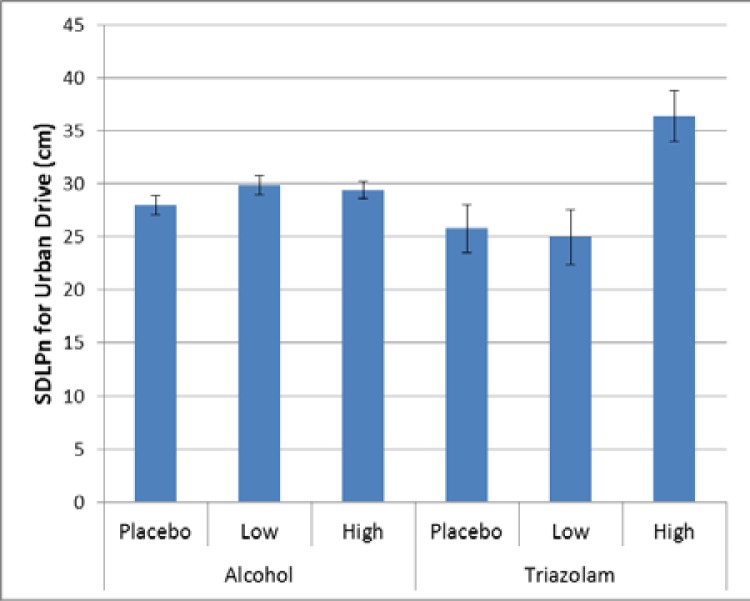
In the urban section of the drive, there were two events where there were significant effects of dosage on driving performance with relation to lane keeping. For the basic urban drive, there was a significant effect for triazolam (p = 0.0027, Cohen’s d = 1.75), such that the high dose produced a greater variability in lane keeping. There was also a trend towards greater variability for the low and high dose of alcohol (p = 0.0963, Cohen’s d = 0.23). As can be seen from Figure 3, the effect of triazolam is greater than that of alcohol, and the effect of dosage differs, with the low dose of tirazolam being no different than placebo but both doses of alcohol trending greater than the placebo.
Figure 3.
Variability in lane keeping for the basic urban drive.
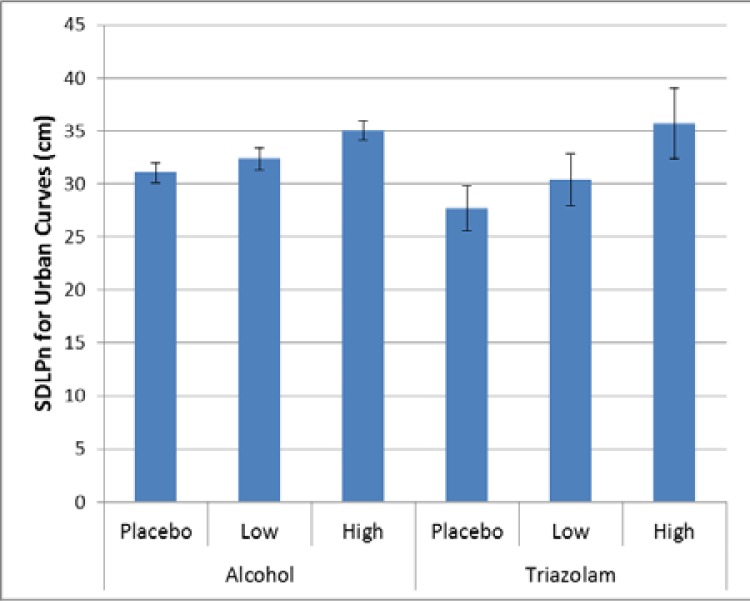
For the urban curves, there was significant effect for alcohol (p < 0.0001, Cohen’s d = 0.41) with the high dose alcohol condition significantly worse than the placebo and low dose alcohol conditions. There was no significant effect for triazolam (p = 0.1318, Cohen’s d = 0.94), although it apears to follow a pattern similar to that of the alcohol.
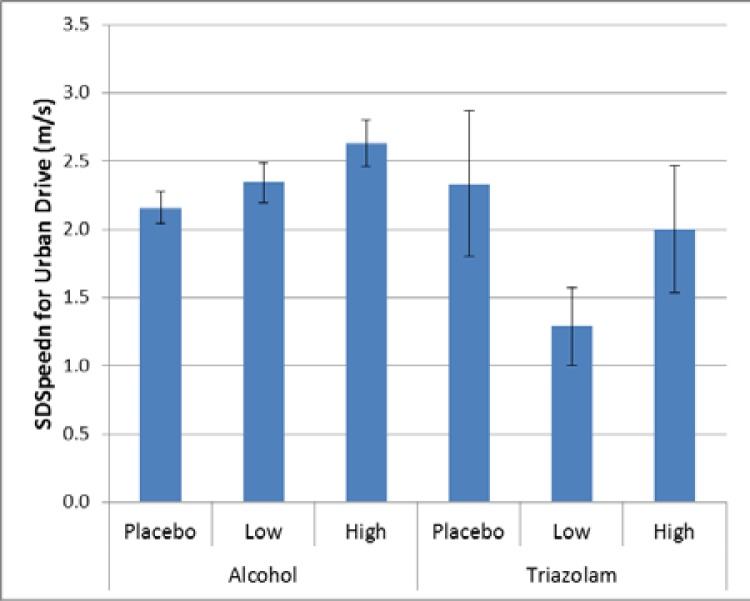
There were also two events where there were significant differences relative to maintaining speed. For the basic urban drive, there was a significant effect for alcohol (p = 0.0131), but no corresponding effect for triazolam (p = 0.3517, Cohen’s d 0.92). For alcohol there was significantly more variability in speed for the high dose alcohol compared to placebo (Cohen’s d = 0.38); see Figure 5.
Figure 5.
Variability in speed maintenance for the basic urban drive.
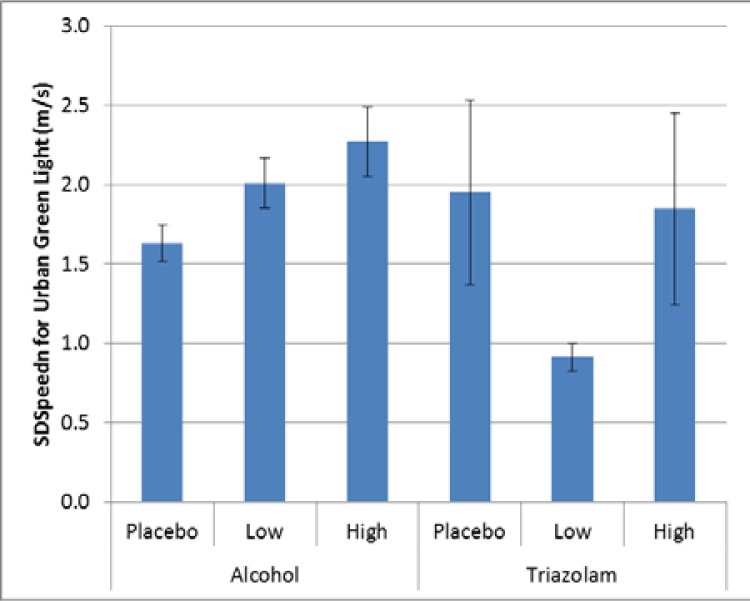
For the urban green light event, there was a significant effect for alcohol (p = 0.0007), but no corresponding effect for triazolam (p = 0.2527, Cohen’s d = 0.94). For alcohol, as with the basic urban drive, there was significantly more variability in speed for the high dose alcohol compared to placebo (Cohen’s d = 0.43); see Figure 6.
Figure 6.
Variability in speed maintenance for the basic urban drive.
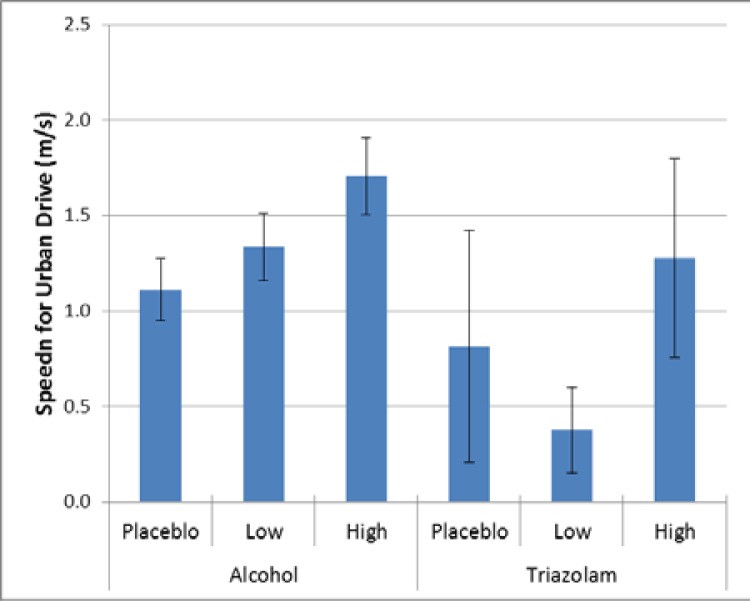
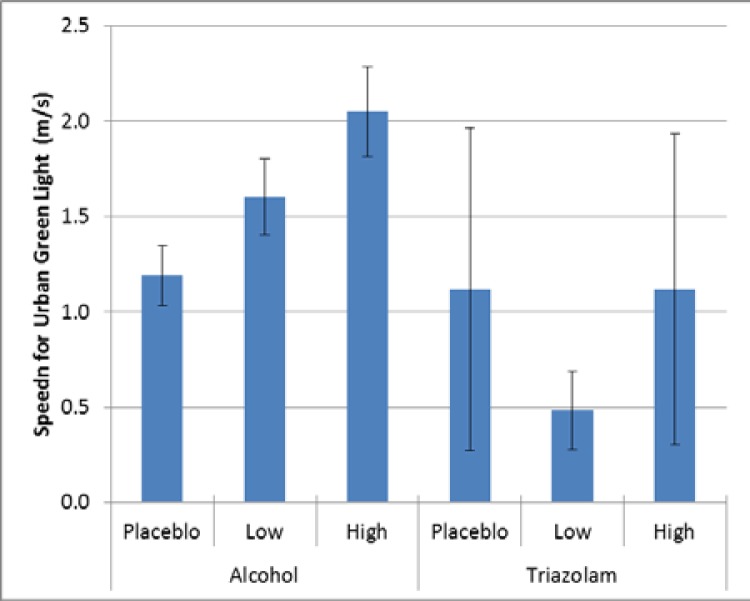
When looking at average speed, there were significant differences for the urban curves and the urban green light, consistent with speed variability. For the basic urban drive (p = 0.0010, Cohen’s d = 0.39) and the green light event (p < 0.0001, Cohen’s d = 0.51), there was a significant effect for alcoho1, with drivers with the high dosage driving faster than those with placebo, as shown in Figure 7 and Figure 8. Threre was no significant difference for triazolam for the basic urban drive (p = 0.2967, Cohen’s d = 0.85) or for the green light event (p 0.8298, Cohen’s d = 0.39).
Figure 7.
Average speed relative to the speed limit (11.18 m/s, 25 mph) for the basic urban drive.
Figure 8.
Average speed relative to the speed limit (11.18 m/s, 25 mph) for the green light event.
Rural Driving
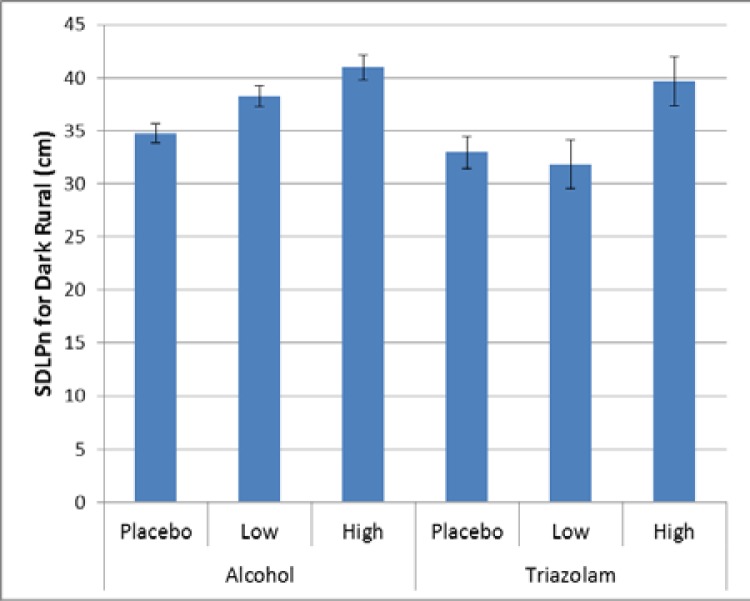
In the rural section of the drive, there were three occurances across the three measures that were significant, with each measure showing one significant effect. For lanekeeping, there was a significant effect for the dark rural drive for both alcohol (p < 0.0001) and triazolam (p = 0.0102). As illustrated in Figure 9, there are signifcant differences for aclohol between doses (Cohen’s d = 1.35 (high vs placebo), 0.43 (low vs placebo), and 0.30 (low vs placebo)), and for triazolam between the low and high doses (Cohen’s d = 1.35), but not between placebo and either dose.
Figure 9.
Variability in lane keeping for the dark rural drive.
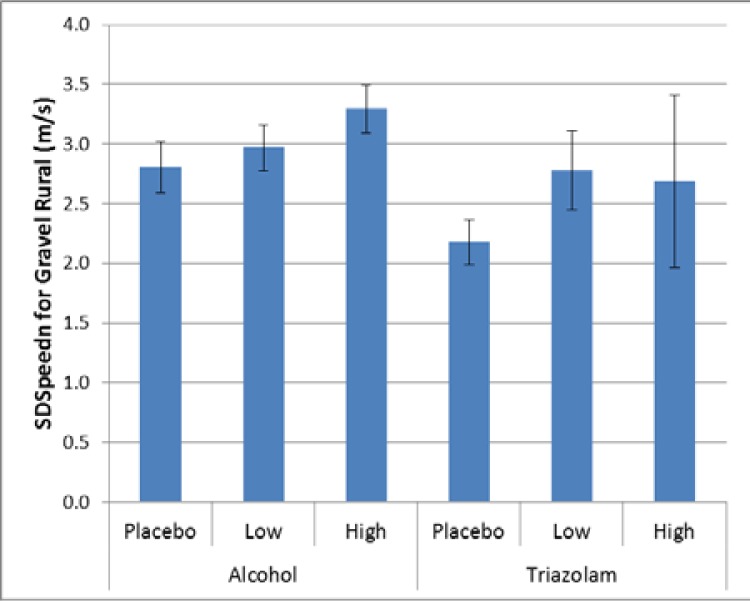
For speed maintenance, there was a significant effect for the gravel rural drive for alcohol (p = 0.0467), but not for triazolam (p = 0.2721, Cohen’s d = 0.85). As illustrated in Figure 10, there are significant differences for alcohol between placebo and high dose alcohol (Cohen’s d = 0.28).
Figure 10.
Variability in speed maintenance for the gravel rural drive.
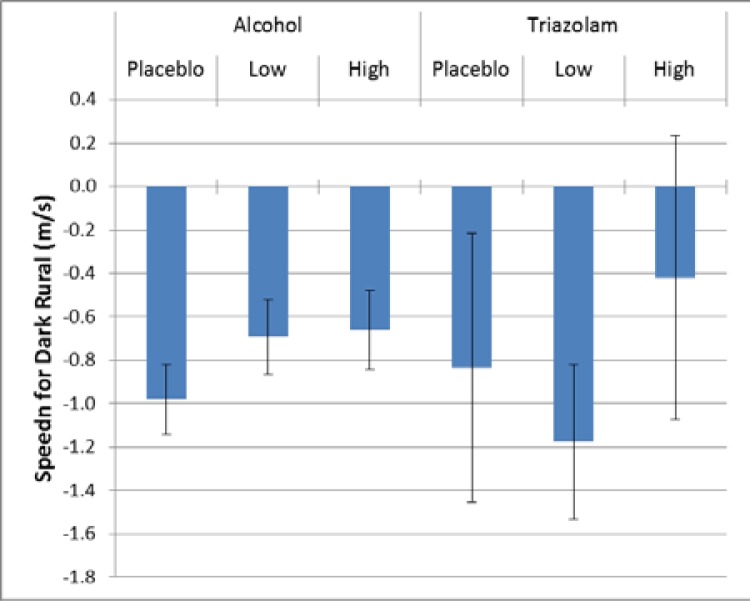
For average speed, there was a significant effect for the dark rural drive for both alcohol (p < 0.0323) and triazolam (p = 0.0494). As illustrated in Figure 11, the average speeds were below the posted limit for both alcohol and triazolam. For alcohol, drivers in the placebo condition drove more slowly than drivers in the high dose condition (Cohen’s d = 0.22). For triazolam, drivers in the high dose condition drove faster than those in the low dose condition (Cohen’s d = 0.64).
Figure 11.
Average speed relative to the speed limit (24.59 m/s, 55 mph) for the green light event.
Discussion
Several interesting findings emerge from this analysis. First, there appears to be a difference in the pattern of impairment between alcohol and triazolam, with the impairment trend for alcohol appearing more linear relative to dose, and with a more complex effect for triazolam. In some cases, there appears to be little difference between the low dose and placebo (e.g., lane keeping in the dark rural drive); in other cases, little difference between low dose and high dose (e.g., speed maintenance on the gravel rural drive); and in other cases, a linear trend (e.g., lane keeping in the urban curves). This helps to illustrate the sometimes complex effect a drug can have on the CNS.
Second, there are important differences between driving environments, as illustrated by average speed. In the urban areas, the differences from the speed limit were positive, indicating a tendency to travel above the posted limit, but on the rural dark drive, average speeds were all below the posted limit. There are several factors that could contribute to this, including driving demand and visual complexity of the scene. Although this affected the absolute values, it did not affect the relative trends.
A possible but unlikely limitation of our study is human physiology. Physiologic variability can be a confounding factor affecting drug levels and the resulting response on outcome measures when all patients are administered a standard dose. Physiology effects on triazolam are variable and have been shown to depend on several factors, including obesity and age (Greenblatt et al., 1984). None of the patients included were morbidly obese, and none were over 65 years of age (to minimize age-associated effects on driving). There may be a greater effect on triazolam associated with the pharmacokinetic properties of absorption, distribution and accumulation. This has the potential for primarily affecting lipophilic drugs. The potential of these properties are minimized by using triazolam because of its rapid and complete absorption and its ultra-short half-life (Greenblatt, Shader, Divoll, & Harmatz, 1981) limiting accumulation. Distribution remains a possible variable.
CONCLUSIONS
Overall, several key considerations emerge from this analysis and contribute to our understanding of the complexity of evaluating the effects of drugs on driving.
One critical consideration is that dosage effects on driving performance are not necessarily linear. Although the effects of alcohol at the doses tested show a largely linear trend across the measures, the effects of triazolam do not follow such a clear trend. For different measures and events, the dosage effects showed a variety of trends. This speaks to the complexity of drug effects and the fact that a drug can affect different measures of driving performance differently.
Another consideration is that the relative effects of drugs can vary across the demand of different types of events. Effect sizes varied across driving events for alcohol and triazolam, Despite the relatively small number of subjects for triazolam, there were instances, such as the basic urban drive, where an effect was large enough to show an effect even though the effects of alcohol for that event were not significant despite the much larger sample size. This points to the importance of evaluating a drug over a variety of driving situations to best assess its impact on CNS functioning.
This is particularly important when considering driving environments. The rural environment provides a higher-speed environment that is similar to that used in other driver evaluations, including on-road evaluations conducted in Europe that rely heavily on standard deviation of lane position. The urban environment provides a different set of challenges with lower speeds, more complex surroundings, and additional threats from denser traffic, intersections, and pedestrians. The use of speed measures nicely complements the more standard SDLP measure. The use of an urban driving environment in addition to the more traditional higher-speed rural environment provides a more robust evaluation of the drug effects that can reveal a fuller understanding of the drug’s true effects.
It is important to identify subtle early effects of medication on human performance. Subtle effects may be mediated by variable receptor affinity and binding; differences in the pharmacokinetic profiles of drugs, including the ability to cross the blood brain barrier; and intrinsic pharmacologic activity of the drugs. Early identification will allow clinicians to use the beneficial nature of the medication in the treatment of the disease but minimize the deleterious effects by adjusting the medication dose or regimen to reduce potential bad outcomes.
Future Research
These findings suggest that additional research is warranted in several other areas.
Drugs should be tested at both low and high dosages to identify effects across the range of therapeutic dosing. Consideration of the pharmacokinetics of drugs and the use of serum concentrations should be utilized to further understand the effects of impairment rather than relying on testing of categorical groupings of dosage.
More needs to be known about the role of level of simulation fidelity in evaluating drug effects on driving performance.
Evaluation of assessment batteries to determine if there are correlates that can be used to predict performance.
LIMITATIONS
The key limitation of this study is the small sample size associated with the triazolam study. This small sample size limited the ability to find differences on the same scale as the alcohol study, which had a larger sample size.
Additionally, although it is not expected, there may be unknown confounds associated with the collection of the triazolam data used in this analysis within a larger study using a different simulator.
Figure 4.
Variability in lane keeping for the urban curves.
Acknowledgments
Data used in this analysis were collected in part under National Highway Traffic Safety Administration (NHTSA) contract DTNH22-06-D-00043 Task Order No. 2. Brian Zobeck, Pharm.D., validated and performed the triazolam assays. Special thanks to Jim Fell, whose input was critical in the design of the driving scenarios.
REFERENCES
- Babor T, De la Fuente J, Saunders J, Grant M. AUDIT: The alcohol use disorders identification test: Guidelines for use in primary health care. Geneva, Switzerland: World Health Organization; 1992. [Google Scholar]
- Broderick P, Hope O, Jeannot P. Mechanism of triazolo-benzodiazepine and benzodiazepine action in anxiety and depression: behavioral studies with concomitant in vivo CA1 hippocampal norepinephrine and serotonin release detection in the behaving animal. Prog Neuro-Psychopharmacol & Biol Psychiat. 1998;22:353–386. doi: 10.1016/S0278-5846(98)00010-4. [DOI] [PMC free article] [PubMed] [Google Scholar]
- Cahalan D, Cisin I, Crossley H. American Drinking Practices: A National Study of Driving Behavior and Attitudes. New Brunswick, NJ: Rutgers University Press; 1969. [Google Scholar]
- Deits C, Boyle LN, Morrison J. Driving Performance of Drug-Impaired Bus Drivers in Work Zone Areas. Paper presented at the Sixth International Driving Symposium on Human Factors in Driver Assessment, Training and Vehicle Design; Lake Tahoe, CA. 2011. pp. 454–460. [Google Scholar]
- Friedman H, Greenblatt D, Burstein E, Harmatz J, Shader R. Population study of triazolam pharmacokinetics. British Journal of Clinical Pharmacology. 1986;22:639–642. doi: 10.1111/j.1365-2125.1986.tb02951.x. [DOI] [PMC free article] [PubMed] [Google Scholar]
- Greenblatt D, Abernethy D, Locniskar A, Harmatz J, Limjuco R, Shader R. Effect of age, gender, and obesity on midazolam kinetics. Anesthesiology. 1984;61(1):27–35. [PubMed] [Google Scholar]
- Greenblatt D, Shader R, Divoll M, Harmatz J. Benzodiazepines: A summary of pharmokinetic properties. British Journal of Clinical Pharmacology. 1981;11(Suppl 1):11S–16S. doi: 10.1111/j.1365-2125.1981.tb01833.x. [DOI] [PMC free article] [PubMed] [Google Scholar]
- Kay G, Logam B. Drugged Driving Expert Panel Report: A consensus protocol for assessing the potential of drugs to impair driving. Washington, DC: National Highway Traffic Safety Administration; 2011. (No DOT HS 811 438) [PubMed] [Google Scholar]
- Lacey J, Kelley-Baker T, Furr-Holden D, Voas R, Romana E, Ramirez A, Berning A. 2007 National Roadside Survey of Alcohol and Drug Use by Drivers: Drug Results. Washington, DC: National Highway Traffic Safety Administration; 2009. p. 148. (No DOT HS 811 249) [Google Scholar]
- Lee J, Fiorentino D, Reyes M, Brown T, Ahmad O, Fell J, Dufour R. Assessing the Feasibility of Vehicle-Based Sensors to Detect Alcohol Impairment. Washington, DC: National Highway Traffic Safety Administration; 2010. (No DOT HS 811 358) [Google Scholar]
- MedlinePlus Triazolam. 2011. Feb 1, Retrieved from http://www.nlm.nih.gov/medlineplus/druginfo/meds/a684004.html.
- National Center for Health Statistics Health, United States, 2008, with Special Feature on the Health of Young Adults. 2009. Retrieved from http://www.cdc.gov/nchs/data/hus/hus08.pdf#098. [PubMed]
- NHTSA . NHTSA Traffic Safety Facts on Drug Involvement of Fatally Injured Drivers. Washington, DC: National Highway Traffic Safety Administration; 2010. p. 3. (No DOT HS 811 415) [Google Scholar]
- Rizzo M. Safe and Unsafe Driving. In: Rizzo, Eslinger, editors. Principles and practice of behavioral neurology and neuropsycholog. 1st ed. Saunders: 2003. [Google Scholar]
- Weiler J, Bloomfield J, Woodworth G, Grant A, Layton T, Brown T, Watson G. Effects of Fexofenadine, Diphenhydramine and Alcohol on Driving Performance: A Randomized, Placebo-Controlled Trial in the Iowa Driving Simulator. Annals of Internal Medicine. 2000;132:354–363. doi: 10.7326/0003-4819-132-5-200003070-00004. [DOI] [PubMed] [Google Scholar]


