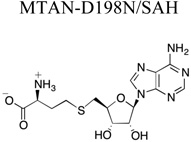
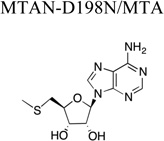
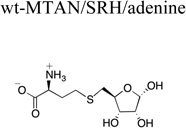
Table 1.
X-ray diffraction and refinement statistics. The structures of the enzyme bound compound are shown for clarity. Parentheses indicate units. Brackets indicate additional information regarding that value. A.S.U., asymmetric unit; r.m.s., root mean square. Rsym = Σ|Ii − <Ii>| / Σ|Ii|, where I is the intensity of a given reflection and <I> is the average intensity for that reflection. Rwork and Rfree = Σ||Fobs| − |Fcalc||/Σ|Fobs|, where Fobs and Fcalc are the observed and calculated structure factor amplitudes, respectively. Rfree is calculated from a set of reflections chosen randomly. These data are equal to 5% of the unique reflections and were not used for model refinement or calculation of the Rwork value.
 |
 |
 |
|
|---|---|---|---|
| Resolution range (Å) [highest shell] | 50.00-1.20 [1.22-1.20] | 50.00-1.63 [1.67-1.63] | 50.00-1.50 [1.53-1.50] |
| Space group | P3221 | P3221 | P3221 |
| a, b (Å) | 80.7 | 80.7 | 81.2 |
| c (Å) | 67.2 | 67.2 | 67.4 |
| Total reflections [unique reflections] | 822470 [75266] | 348061 [32308] | 237786 [40655] |
| Completeness (%) [highest shell] | 95.0 [92.6] | 99.7 [99.2] | 98.5 [97.5] |
| Redundancy [highest shell] | 10.9 [10.7] | 10.8 [10.1] | 5.8 [5.7] |
| Average I/σ (I) [highest shell] | 16.0 [4.1] | 11.7 [3.3] | 13.9 [3.6] |
| Rsym (%) [highest shell] | 5.0 [30.0] | 6.5 [38.1] | 6.2 [44.9] |
| Atoms/A.S.U | 2,218 | 2,127 | 2,010 |
| Rwork (%) | 15.4 | 13.5 | 18.2 |
| Rfree (%) | 17.5 | 17.8 | 20.5 |
| Average B-factor protein (Å2) | 16.6 | 20.9 | 22.2 |
| Average B-factor ligand (Å2) | 14.1 | 18.9 | 21.3 |
| Average B-factor solvent (Å2) | 27.0 | 31.3 | 29.5 |
| Ligand occupancy (%) | 100 | 100 | 100 |
| r.m.s. bonds (Å) | 0.005 | 0.005 | 0.006 |
| r.m.s. angles (°) | 1.09 | 0.95 | 0.99 |
| Ramachandran favored (%) | 96.9 | 96.9 | 96.9 |
| Ramachandran disallowed (%) | 0.0 | 0.0 | 0.0 |
| Coordinate Error (Å) | 0.14 | 0.17 | 0.34 |
