Abstract
A novel acquisition and processing method that enables single snapshot wide field imaging of optical properties in the Spatial Frequency Domain (SFD) is described. This method makes use of a Fourier transform performed on a single image and processing in the frequency space to extract two spatial frequency images at once. The performance of the method is compared to the standard six image SFD acquisition method, assessed on tissue mimicking phantoms and in vivo. Overall both methods perform similarly in extracting optical properties.
OCIS codes: (170.3880) Medical and biological imaging, (110.2960) Image analysis
1. Introduction
There is a significant interest in providing real-time feedback during procedures using near-infrared (NIR) light. This is particularly well illustrated in the field of fluorescence image-guided surgery with a continuously increasing number of studies and clinical trials [1–3]. In parallel to fluorescence image guidance, new techniques not relying on the use of exogenous contrast agents are also reaching the clinic. In particular, NIR endogenous contrast shows promise for providing important information relative to tissue oxygenation, metabolism and hydration to healthcare practitioners [4–8]. However, only a few methods are currently capable in practice of providing images of optical properties or endogenous chromophores and none to date in real-time.
One method, called Spatial Frequency Domain Imaging (SFDI), has received significant attention because it is capable of measuring optical properties over large fields of view at once [9]. This method relies on structured illumination to extract the tissue modulation transfer function (MTF; the Fourier equivalent to the point spread function) at every location on the image, and therefore extract optical properties. However, this method currently requires multiple images to extract the MTF at several spatial frequencies and therefore is limited in its ability to provide data in real time. Given the importance of clinical workflow, shortening procedure time and the significant amount of motion during clinical applications, it is of paramount importance to provide guidance in real time, at a rate of at least 1 frame per second (fps), and preferentially faster than 10 fps.
In this work, we present a novel acquisition and processing method in the spatial frequency domain allowing the extraction of optical properties using a single image. This method relies on Fourier transform and processing in the frequency space of a single image to extract two spatial frequency images that are used to extract the optical properties using the fast 2-D lookup table SFDI approach. This method is tested on tissue mimicking phantoms and in vivo, and compared to the standard SFDI method employing six images.
2. Material and methods
2.1. Spatial frequency domain imaging
The theory of SFDI has been thoroughly described in the literature [9, 10]. Briefly it consists of analyzing the modulation transfer function (MTF) of a turbid medium, the Fourier equivalent to the point spread function, at every location of an image. Note that the MTF analyzed in SFDI is the MTF of the turbid medium under study, and corresponds to the diffuse reflectance as a function of spatial frequency. The system is calibrated to take into account the effect of the MTF of the optics. SFDI makes measurements relative to a calibration phantom of known optical properties and uses a model-based approach, either diffusion theory or Monte Carlo simulations, to relate the measured diffuse reflectance and optical properties. In the case of sub-surface imaging, where optical properties are independently measured at every location in the image, a fast, pre-computed lookup table can be used to recover the optical properties from only two spatial frequency images, typically DC (i.e. 0 mm−1) and AC (e.g. 0.2 mm−1).
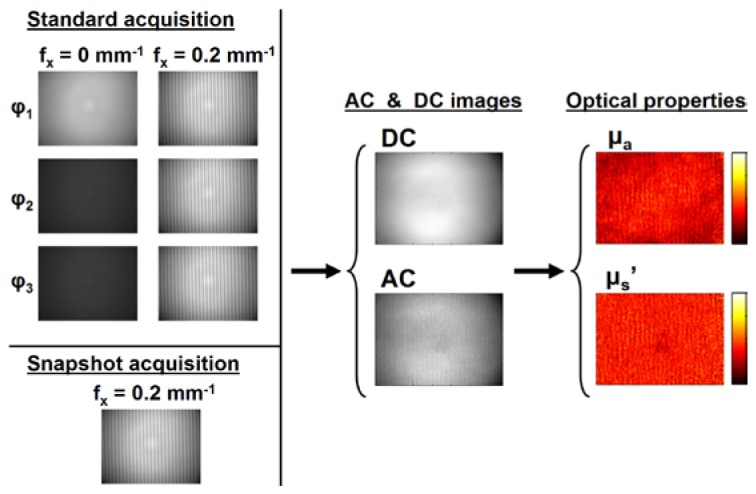
There are therefore two time-consuming processes when performing an SFDI measurement. First the acquisition, which consists of gathering images to obtain a DC and an AC image, and second, the processing toward the extraction of the optical properties. If the processing using the pre-computed lookup table can be very fast, the process of extracting the DC and AC images is currently comparatively slower. Indeed, the commonly used approach is to acquire, for each spatial frequency (0 mm−1 and 0.2 mm−1), 3 images phase shifted by 120 degrees (φ1, φ2, φ3), hence a total of six images (Fig. 1 ). An analytical expression can then be used to extract the AC and DC images and process the data [9].
Fig. 1.

Spatial frequency domain imaging. Images are acquired, the AC and DC components extracted and the optical property images calculated. Note the standard acquisition process including six images (Top Left) and the snapshot acquisition process (Bottom Left).
2.2. Single snapshot method
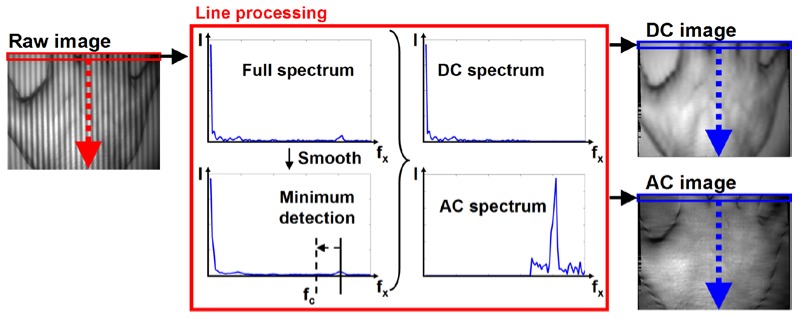
The single snapshot method we propose relies on a line by line Fourier transform of a single image and processing in the frequency space to extract the DC and AC images. As shown in Fig. 2 , a single high spatial frequency image (Raw image, here illuminated at 0.2 mm−1 spatial frequency) is acquired and processed line by line. The line under processing is analyzed to find the first and last maxima or minima of the image and cropped to an integer number of periods. A Fast Fourier Transform (FFT) is performed on the cropped line, and the DC and AC components of the full spectrum are separated at a cutoff frequency (fc) determined automatically. To choose the cutoff frequency, the full spectrum is smoothed, the highest AC frequency detected (here 0.2 mm−1), and the closest local minimum located. The full spectrum is then split in two spectra, one DC and one AC. Finally, the DC and AC spectra are processed separately via Inverse Fourier Transform (IFFT), creating a line on the DC and AC images, respectively. This process is repeated for each line in the image.
Fig. 2.

Single snapshot method. Each line of a single, high frequency image is processed. Spectrum is obtained via Fast Fourier Transform then DC and AC components are separated at a cutoff frequency fc to create two spectra. The final DC and AC images are then formed via Inverse Fast Fourier Transform. On the spectra plots in the center, the y axis represents intensity, I (A.U.), and the x axis spatial frequency, fx (mm−1).
2.3. Experiments
Three different experiments were performed to compare the results obtained with the novel single snapshot method and the currently used six image standard method. For all experiments, optical properties were measured at two spatial frequencies (0 and 0.2 mm−1) and three phases (0, 120 and 240 degrees) at a wavelength of 670 nm using our SFDI system [11]. Images were processed using all six images (Standard) or a single high frequency image (Snapshot) and results compared. The following experiments were performed:
- Homogeneous phantoms measurements: Seven silicone based tissue mimicking phantoms were made, each with a unique combination of optical properties (μa, μs') [12]. Optical properties were varied from 0.006 to 0.077 mm−1 in absorption and 0.5 to 1.3 mm−1 in reduced scattering. Titanium dioxide TiO2 was used as a scattering agent and India ink as an absorbing agent. Each phantom measures 14 x 14 x 2.5 cm.
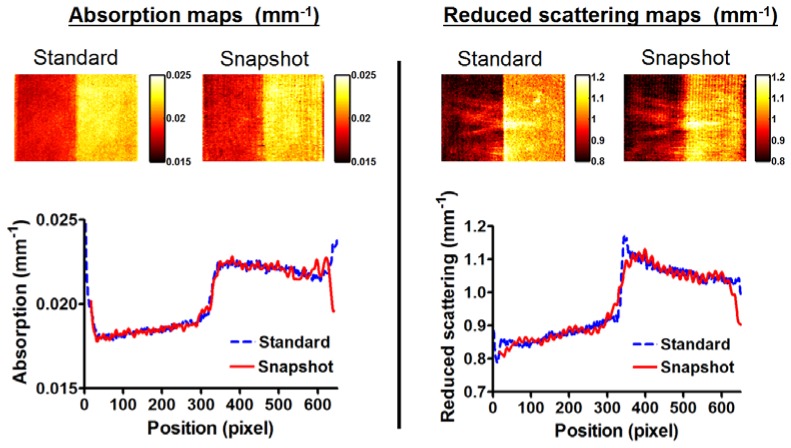
- Step function phantoms measurements: To investigate the potential degradation of the spatial information when using the snapshot method, two step function silicone based tissue mimicking phantoms were fabricated. The first phantom was made with a step in absorption from 0.0185 to 0.022 mm−1 with reduced scattering being constant at 0.91 mm−1. The second phantom was made with a step in reduced scattering from 0.085 to 1.08 mm−1 with absorption being constant at 0.019 mm−1. Each phantom measures 14 x 14 x 2.5 cm.
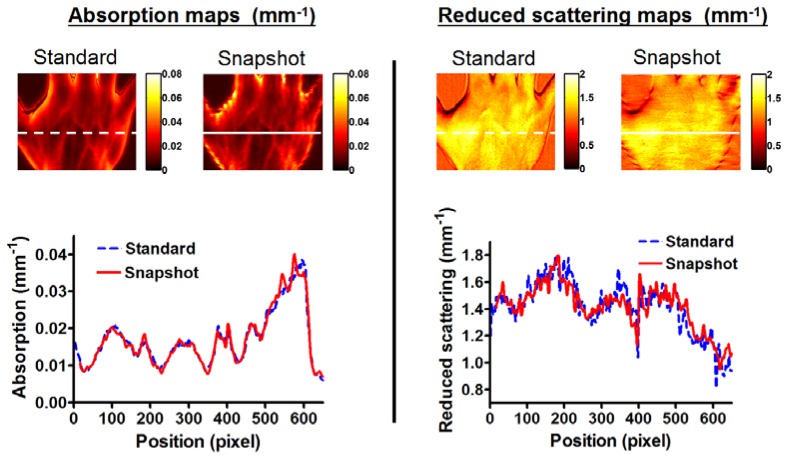
- In vivo measurements: A hand was imaged with our SFDI system.
3. Results
3.1. Homogenous phantoms
Shown in Fig. 3 are the results from the homogenous phantoms measurements. Both absorption and reduced scattering maps appear identical, with the heterogeneous features retained by the snapshot method. The plots represent the comparison of the values recovered using one method against the other with the dashed line having a slope of 1.
Fig. 3.
Homogeneous phantoms measurements. Left: absorption, Right: reduced scattering, with both the standard and the snapshot methods. Bottom: plots comparing the optical properties recovered with both methods.
3.2. Step function phantoms
Shown in Fig. 4 are the results from the step function phantoms measurements. Both absorption variation and reduced scattering variation maps appear identical, with the step function being reconstructed by both methods. The plots represent the comparison of the values recovered using one method against the other across the phantoms. Both methods provide results that are similar in absorption variation. The step transition in reduced scattering is slower using the snapshot method compared with the standard method, which is expected from analyzing the image line by line and processing with a single phase.
Fig. 4.
Step function phantoms measurements. Left: absorption variation, Right: reduced scattering variation, with both the standard and the snapshot methods. Bottom: Average line profile across the phantoms with both methods.
3.3. In vivo experiments
Shown in Fig. 5 are the results from the in vivo measurements. Both absorption and reduced scattering maps appear identical, with some degradation of the image quality at the boundaries when using the snapshot method compared to the standard method. The plots represent the comparison of the values recovered using one method against the other across the sample (white lines). Both methods provide results that are similar in absorption and reduced scattering highlighting the fact that despite image quality reduction at the boundaries, the optical properties are recovered correctly over the image when using the snapshot method.
Fig. 5.
In vivo measurements. Left: absorption, Right: reduced scattering, with both the standard and the snapshot methods. Bottom: line profile across the sample with both methods (white line in images).
4. Discussion
In this work we described and validated a novel single snapshot optical properties imaging method working in the spatial frequency domain. It consists of the acquisition and processing of a single high frequency image to extract both DC and AC images. These images are then used to recover the optical properties as it is performed with Spatial Frequency Domain Imaging (SFDI). One of the main advantages of this method is its capacity to image rapidly (one image only) virtually any size field of view, which makes it particularly interesting in the context of image guidance.
However, our method does not come without limitations. As evidenced in the results, the image quality suffers from the processing of a single phase sine wave. This is caused mainly by the fast change in amplitude modulation in the sine wave as it arises at the boundaries of the sample. We are currently working in improving the quality of the image by using an hybrid method that either processes in the Fourier domain or using the maximum to minimum difference in the sine wave to extract the amplitude modulation (i.e. AC component) depending on its rate of change. Nonetheless, it is important to note that although the image quality may be degraded, the optical properties are correctly recovered over the sample between the boundaries.
Another method to improve image quality is to use a higher spatial frequency. Spatial frequencies of 0.3 to 0.5 mm−1 have been successfully tested and shown to improve significantly image quality. However, since the scope of this article is to compare the standard method that uses a frequency of 0.2 mm−1, we restricted our study to this particular spatial frequency.
The capacity of making measurements in real time is of paramount importance to test endogenous chromophore imaging in the clinic for image guidance during procedures. Not only is it necessary from a workflow perspective, with healthcare professionals having to integrate a novel device in their environment, but also to avoid any blurring in the acquired images, from either voluntary or involuntary subject motion, and to guarantee co-registration, if necessary, between images [13]. Currently, the snapshot approach shortens the acquisition time by approximately 6 fold, i.e. in the range of 50 to 100 ms depending on the wavelength and the medium properties. Processing time to obtain the DC and AC images takes approximately 2 seconds, the snapshot method being twice slower than the standard method. However, the processing has not been optimized at this point and we anticipate a significant improvement in processing time.
To be fully integrated and tested in a clinically relevant system, this method must integrate a profile correction method. This feature is of paramount importance since virtually any non-contact imaging method is dependent upon both sample distance and shape. Previous work has been performed to take into account the surface geometry [14], and a novel approach being developed to extract the phase of the sine wave from a single snapshot image.
5. Conclusion
The method presented in this article allows for optical properties imaging using a single snapshot image. The method has been validated using homogeneous and step function tissue mimicking phantoms, as well as in vivo. Overall the single snapshot method performs similarly to the standard six image method. This novel snapshot method allows for single image acquisition and processing of optical properties and thereby represents a significant advance toward imaging optical properties and endogenous chromophores in real time.
Acknowledgments
The authors would like to thank John V Frangioni for many helpful discussions, David Burrington, Jr. for editing and Eugenia Trabucchi for administrative assistance. This work was supported by NIH/NIDCR Award Number R01-DE-022820 and NIH/NIDDK Award Number K01-DK-093603.
References and links
- 1.Gioux S., Choi H. S., Frangioni J. V., “Image-guided surgery using invisible near-infrared light: fundamentals of clinical translation,” Mol. Imaging 9(5), 237–255 (2010). [PMC free article] [PubMed] [Google Scholar]
- 2.van Dam G. M., Themelis G., Crane L. M., Harlaar N. J., Pleijhuis R. G., Kelder W., Sarantopoulos A., de Jong J. S., Arts H. J., van der Zee A. G., Bart J., Low P. S., Ntziachristos V., “Intraoperative tumor-specific fluorescence imaging in ovarian cancer by folate receptor-α targeting: first in-human results,” Nat. Med. 17(10), 1315–1319 (2011). 10.1038/nm.2472 [DOI] [PubMed] [Google Scholar]
- 3.Sevick-Muraca E. M., “Translation of near-infrared fluorescence imaging technologies: emerging clinical applications,” Annu. Rev. Med. 63(1), 217–231 (2012). 10.1146/annurev-med-070910-083323 [DOI] [PubMed] [Google Scholar]
- 4.O’Sullivan T. D., Leproux A., Chen J. H., Bahri S., Matlock A., Roblyer D., McLaren C. E., Chen W. P., Cerussi A. E., Su M. Y., Tromberg B. J., “Optical imaging correlates with magnetic resonance imaging breast density and reveals composition changes during neoadjuvant chemotherapy,” Breast Cancer Res. 15(1), R14 (2013). 10.1186/bcr3389 [DOI] [PMC free article] [PubMed] [Google Scholar]
- 5.Laughney A. M., Krishnaswamy V., Rizzo E. J., Schwab M. C., Barth R. J., Jr, Cuccia D. J., Tromberg B. J., Paulsen K. D., Pogue B. W., Wells W. A., “Spectral discrimination of breast pathologies in situ using spatial frequency domain imaging,” Breast Cancer Res. 15(4), R61 (2013). 10.1186/bcr3455 [DOI] [PMC free article] [PubMed] [Google Scholar]
- 6.Brown J. Q., Bydlon T. M., Kennedy S. A., Caldwell M. L., Gallagher J. E., Junker M., Wilke L. G., Barry W. T., Geradts J., Ramanujam N., “Optical spectral surveillance of breast tissue landscapes for detection of residual disease in breast tumor margins,” PLoS ONE 8(7), e69906 (2013). 10.1371/journal.pone.0069906 [DOI] [PMC free article] [PubMed] [Google Scholar]
- 7.Hariri Tabrizi S., Mahmoud Reza Aghamiri S., Farzaneh F., Amelink A., Sterenborg H. J., “Single fiber reflectance spectroscopy on cervical premalignancies: the potential for reduction of the number of unnecessary biopsies,” J. Biomed. Opt. 18(1), 017002 (2013). 10.1117/1.JBO.18.1.017002 [DOI] [PubMed] [Google Scholar]
- 8.A’Amar O. M., Liou L., Rodriguez-Diaz E., De Las Morenas A., Bigio I. J., “Comparison of elastic scattering spectroscopy with histology in ex vivo prostate glands: potential application for optically guided biopsy and directed treatment,” Lasers Med. Sci. 28(5), 1323–1329 (2013). 10.1007/s10103-012-1245-6 [DOI] [PubMed] [Google Scholar]
- 9.Cuccia D. J., Bevilacqua F., Durkin A. J., Ayers F. R., Tromberg B. J., “Quantitation and mapping of tissue optical properties using modulated imaging,” J. Biomed. Opt. 14(2), 024012 (2009). 10.1117/1.3088140 [DOI] [PMC free article] [PubMed] [Google Scholar]
- 10.Dognitz N., Wagnieres G., “Determination of tissue optical properties by steady-state spatial frequency-domain reflectometry,” Lasers Med. Sci. 13, 55–65 (1998). 10.1007/BF00592960 [DOI] [Google Scholar]
- 11.Gioux S., Mazhar A., Lee B. T., Lin S. J., Tobias A. M., Cuccia D. J., Stockdale A., Oketokoun R., Ashitate Y., Kelly E., Weinmann M., Durr N. J., Moffitt L. A., Durkin A. J., Tromberg B. J., Frangioni J. V., “First-in-human pilot study of a spatial frequency domain oxygenation imaging system,” J. Biomed. Opt. 16(8), 086015 (2011). 10.1117/1.3614566 [DOI] [PMC free article] [PubMed] [Google Scholar]
- 12.F. Ayers, A. Grant, D. Kuo, D. J. Cuccia, and A. J. Durkin, “Fabrication and characterization of silicone-based tissue phantoms with tunable optical properties in the visible and near infrared domain,” in Proc. SPIE(2008), p. 6870E. [Google Scholar]
- 13.Nguyen J. Q., Saager R. B., Cuccia D. J., Kelly K. M., Jakowatz J., Hsiang D., Durkin A. J., “Effects of motion on optical properties in the spatial frequency domain,” J. Biomed. Opt. 16(12), 126009 (2011). 10.1117/1.3662454 [DOI] [PMC free article] [PubMed] [Google Scholar]
- 14.Gioux S., Mazhar A., Cuccia D. J., Durkin A. J., Tromberg B. J., Frangioni J. V., “Three-dimensional surface profile intensity correction for spatially modulated imaging,” J. Biomed. Opt. 14(3), 034045 (2009). 10.1117/1.3156840 [DOI] [PMC free article] [PubMed] [Google Scholar]


