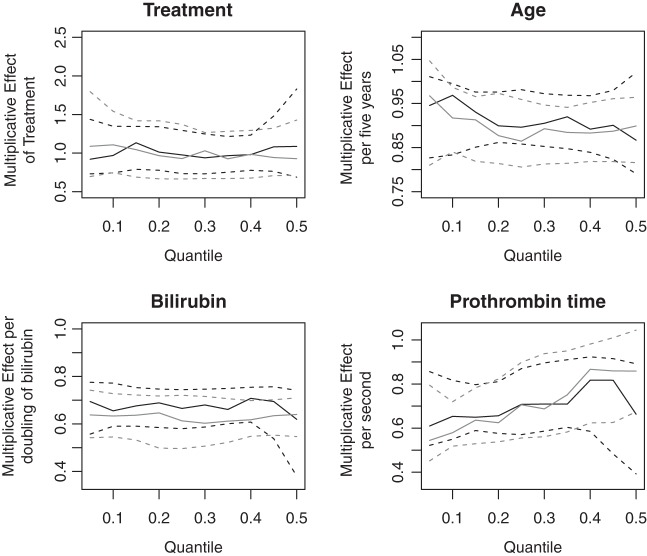
Fig. 1.
Estimated multiplicative effects on time to event for 0.05 to 0.5 quantiles (solid lines). 95% confidence intervals (dashed lines) are formed by taking the 2.5th and 97.5th sample quantiles of 1000 bootstrapped samples. The tree-based estimator and Portnoy's estimator are the black and gray lines, respectively.

