

Abstract
Background: The energy intake necessary to maintain weight and body composition is called the energy requirement for weight maintenance and can be determined by using the doubly labeled water (DLW) method.
Objective: The objective was to determine the energy requirements of nonobese men and women in the Comprehensive Assessment of Long-Term Effects of Reducing Intake of Energy 2 study.
Design: Energy requirements were determined for 217 healthy, weight-stable men and women [aged >21 to <50 y; 70% female, 77% white; body mass index (BMI; in kg/m2) 22 to <28; 52% overweight] over 28 d with 2 consecutive 14-d DLW assessments in addition to serial measures of body weight and fat-free mass and fat mass by dual-energy X-ray absorptiometry. Energy intake and physical activity were also estimated by self-report over ≥6 consecutive d in each DLW period.
Results: Total daily energy expenditure (TDEE) was consistent between the 2 DLW studies (TDEE1: 2422 ± 404 kcal/d; TDEE2: 2465 ± 408 kcal/d; intraclass correlation coefficient = 0.90) with a mean TDEE of 2443 ± 397 kcal/d that was, on average, 20% (580 kcal/d) higher in men than in women (P < 0.0001). The regression equation relating mean TDEE to demographics and weight was as follows: TDEE (kcal/d) = 1279 + 18.3 (weight, kg) + 2.3 (age, y) − 338 (sex: 1 = female, 0 = male); R2 = 0.57. When body composition was included, TDEE (kcal/d) = 454 + 38.7 (fat-free mass, kg) − 5.4 (fat mass, kg) + 4.7 (age in y) + 103 (sex: 1 = female, 0 = male); R2 = 0.65. Individuals significantly underreported energy intake (350 kcal/d; 15%), and underreporting by overweight individuals (∼400 kcal/d; 16%) was greater (P < 0.001) than that of normal-weight individuals (∼270 kcal/d; 12%). Estimates of TDEE from a 7-d physical activity recall and measured resting metabolic rate also suggested that individuals significantly underreported physical activity (∼400 kcal/d; 17%; P < 0.0001).
Conclusion: These new equations derived over 1 mo during weight stability can be used to estimate the free-living caloric requirements of nonobese adults. This trial was registered at clinicaltrials.gov as NCT00427193.
INTRODUCTION
An integral goal of the Comprehensive Assessment of Long-Term Effects of Reducing Intake of Energy (CALERIE)4 2 Study (1) was to accurately determine the energy requirement of study subjects at baseline. This determination was important for the prescription of a 25% reduction in energy intake and to obtain objective assessments of energy intake and hence adherence to the 2-y calorie restriction intervention (2).
During maintenance of body weight and body composition, the energy requirement of an individual is equal to total daily energy expenditure (TDEE). Numerous methods are used to quantify habitual energy intake, including food records, dietary recalls, caloric titration, indirect calorimetry, and stable isotopes. Caloric titration over several weeks in controlled conditions is probably the most accurate method (3), but it is inefficient in most settings because of the associated expense and burden. Whole-room calorimetry is considered the gold standard for measuring energy expenditure in humans, but these measures are carried out under strictly controlled artificial environmental conditions and typically are of short duration (24 h to a few days) and, because in the confines of such metabolic chambers, total and spontaneous physical activities are greatly reduced (4, 5), room calorimeters underestimate energy intake in free-living situations.
Energy requirements can be measured in weight-stable, free-living individuals with the doubly labeled water (DLW). Unfortunately, cost and the highly specialized method required limit widespread use of DLW studies. However, large data sets of total energy expenditure measured by DLW have been compiled, and normative equations have been derived to predict the energy requirements of individuals on the basis of sex, age, body size (height and weight), and physical activity level (PAL) (6, 7). Equations such as these can provide an important clinical tool; however, at present there are several limitations to their use. First, DLW data (as well as demographic and basic anthropometric data) used in these data sets were obtained from studies performed in many countries and individuals of diverse ethnic backgrounds and radically different environmental conditions. Second, DLW studies differ with respect to isotope dosing, length, analytic techniques and laboratories used for analysis. Third, and probably the most important, is the assumption that if DLW alone is being used to estimate energy requirements, subjects are weight stable (8–10). This is a seldom reported characteristic in DLW data sets and not a specified inclusion criterion for DLW data included in these large compiled data sets.
Given the fundamental importance of an accurate measurement of energy requirements in each subject enrolled in CALERIE 2 and the limitation with existing data sets, we assessed the energy requirement of 217 healthy individuals over a 28-d period of weight maintenance with 2 back-to-back measurements of energy expenditure by DLW. The average of the two 14-d assessments of energy expenditure during this weight-maintenance period was used to define 1) the reliability of the measure within individuals, 2) the energy requirement during weight stability, and 3) the caloric restriction prescription for each subject during the subsequent intervention. This DLW data set is from a large well-controlled study in which 4 continuous weeks of energy expenditure were assessed and thereby provides a unique opportunity to 1) understand the determinants of energy requirements in normal-weight and slightly overweight individuals and 2) develop predictive equations for estimating energy requirements based on body weight, body composition, sex, and age for use in populations of free-living, nonobese individuals. We compared this objective measure of energy intake with subjective estimates of energy intake and energy expenditure from dietary records and physical activity recalls (PARs).
SUBJECTS AND METHODS
Study oversight
The CALERIE 2 study protocol was approved by the Institutional Review Boards at Pennington Biomedical Research Center (PBRC), Tufts University (Boston, MA), Washington University (St Louis, MO), and Duke University (Durham, NC) and was described previously (1, 11). Study oversight was provided by the Data Safety Monitoring Board, and all subjects provided written informed consent.
Subjects
Healthy individuals of both sexes and all races were eligible to participate. Men were required to be between 21 and 50 y of age (inclusive) and women between 21 and 47 y of age (inclusive). All participants were required to be normal weight or slightly overweight with a BMI (in kg/m2) of 22.0 to <28.0. Study eligibility was assessed in 3 screening visits to identify subjects who were physically and psychologically healthy to participate in a 2-y study of calorie restriction and able to adhere to the rigors of such a study. Details of the recruitment and screening process were reported previously (12). Two hundred twenty subjects (70% female) satisfied the eligibility criteria and commenced baseline testing; 3 subjects did not have repeated measures of both DLW and resting metabolic rate (RMR); therefore, data were available for 217 subjects and are included in the current analysis.
Baseline evaluations
Aside from performing a detailed set of evaluations to determine the health status of study subjects at baseline, a critical goal of the baseline assessment was to quantify ad libitum energy requirements to compute an individualized caloric prescription for each subject and an estimate of adherence throughout the 2-y trial (2). Baseline measures were obtained over a 5-wk period (36 d) to allow for 2 consecutive 14-d assessments of free-living energy expenditure (and indirectly energy intake) by the DLW method. In total, there were 5 outpatient visits (in the fasting state) and a 2-day inpatient visit on a metabolic ward.
Anthropometric assessments
Body weight was measured by using a calibrated scale (Scale Tronix 5200). Subjects were weighed in the morning after an overnight fast of ≥8 h while wearing only a preweighed hospital gown. The weight of the gown was subtracted to obtain a true metabolic (ie, naked) weight. Height was measured twice by using a wall-mounted stadiometer.
Body composition by dual-energy X-ray absorptiometry
Body fat, fat-free mass, and bone mineral content were measured by dual-energy X-ray absorptiometry (DXA; Hologic Inc). DXA measurements were performed twice at baseline to coincide with the DLW assessments. The first DXA measure was performed at the beginning of the first DLW period (day −29), and the second DXA was performed at the end of the second DLW period (day −1). Scans were performed according to a standardized protocol for subject positioning and scan mode, and all DXA scans were analyzed by a single individual at a centralized reading center (University of California, San Francisco) by using Hologic software Apex version 3.3. Longitudinal performance of the 3 DXA instruments was monitored with regular scanning of Hologic whole-body phantoms.
Energy expenditure assessments
RMR was measured by indirect calorimetry with a Vista-MX metabolic cart and Turbofit software version 5.07 (Vacumed) after standardized calibration and study personnel were trained by the CALERIE 2 master trainer. Two 30-min measurements were obtained on consecutive days (day −1 and day 0) while subjects resided on the inpatient unit. The last 20 min of data from each measurement were averaged, and the mean of the 2 measures was used for analysis.
TDEE was measured over 28 d by the DLW method. Two 14-d measurements were performed sequentially (TDEE1: days 1–14; TDEE2: days 14–28), and the average was used to determine baseline TDEE. For each DLW period, 2 baseline urine samples were collected before subjects consumed a cocktail (1.5 g/kg body weight) containing 0.086 g 2H2O (99.98% 2H) and 0.138 g H218O (100% 18O) per kg body weight. After a first complete void after dosing, 6 timed urine samples were collected: 2 ∼4.5 and 6 h after dosing, 2 on day 7, and 2 on day 14. Measurement of hydrogen and oxygen isotope enrichments were measured by gas-isotope-ratio mass spectrometry at the USDA/Agricultural Research Service Children's Nutrition Research Center Stable Isotope Laboratory at Baylor College of Medicine (Houston, TX) by using validated methods (13, 14). The carbon dioxide production rate ( CO2) was calculated from the fractional turnover rates of 2H (kH) and 18O (kO) as follows (15):
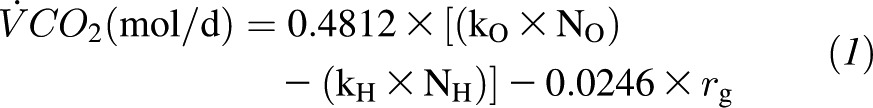 |
where rg is the fractionated water loss, which is calculated as 1.05 × (NO × kO – NH × kH). The CO2 was converted to TDEE based on an energy equivalent of 1 L CO2 to be 3.815/respiratory quotient + 1.2321. The respiratory quotient used to compute TDEE was 0.86 (16), given that it was not statistically different from the food quotient calculated from food diaries and changes in body composition (mean food quotient: 0.854 ± 0.023; range: 0.802–0.917).
Physical activity
The Stanford 7-d PAR was administered twice during each 14-d DLW period by study personnel who were trained by a qualified 7-d PAR trainer (17). As previously described, the hours spent in sleep and light, moderate, hard, and very hard activities were multiplied by their respective metabolic equivalent tasks (METs) (1, 1.5, 4, 6, and 10 METs, respectively), summed, and finally expressed as total MET-h/d. TDEE from the PAR (TDEE PAR) was calculated from the caloric equivalent of 1 MET determined for each individual from measured RMR multiplied by the number of MET-h/d (17). PAL was calculated as the ratio of TDEE to RMR (PAL = TDEE/RMR).
Energy and nutrient intakes
Six-day food diaries were collected by using paper logs, which coincided with the DLW measurement. Food records were analyzed by using the University of Minnesota Nutrition Data System for Research by a central reading center at the University of Cincinnati.
Statistical analysis
All statistical analyses were performed by biostatisticians at the CALERIE Data Coordinating Center by using SAS v9.2 (SAS Institute Inc). Continuous variables were described by using means, SDs, and ranges and categorical variables by counts and percentages. Wilcoxon's Mann-Whitney U test was used to compare continuous variables across 2 groups (sex, BMI category), and the Kruskal-Wallis test was used to compare continuous variables across the 3 study sites. Paired Wilcoxon's tests were used to compare repeated measurements (2 assessments of TDEE via DLW) or measurements via different methods (measured compared with self-reported energy intake) within subjects. Intraclass correlation coefficients were also calculated for these repeated measurements. Chi-square tests were used to compare categorical variables. Linear regression was used to create regression equations for mean baseline TDEE and mean baseline RMR by using age (in y), sex, weight, or body composition (fat mass and fat-free mass from DXA) as independent variables. All of the independent variables were included in the final models, regardless of their P value. Data are reported as means ± SDs, and α was set at ≤0.05 (2-tailed).
RESULTS
Subjects
Characteristics of the subjects are reported in Table 1. The CALERIE 2 cohort at baseline with complete data (2 measurements of both TDEE and RMR) comprised of 217 individuals, of whom 79 were enrolled at the PBRC, 70 at Tufts, and 68 at Washington University. Subjects were aged between 20.7–50.8 y. Most of the subjects were women (n = 151, 70%) and self-reported ethnicity as “not Hispanic or Latino” (n = 206, 95%) and race as “white” (n = 167, 77%). Forty-eight percent (n = 105) of subjects were normal weight (BMI = 22.0–24.9), and 52% of subjects (n = 112) were overweight (BMI = 25.0–27.9). As shown in Table 1, men were older (by study design, P < 0.03), were heavier (P < 0.0001), and were taller (P < 0.0001) and had a higher BMI (P = 0.0001) because of higher fat-free mass (P < 0.0001). Subjects were normoglycemic, and there was no evidence of dyslipidemia. No group or sex differences were noted between the study sites.
TABLE 1.
Characteristics of CALERIE 2 subjects at baseline1
| All (n = 217) | Men (n = 66) | Women (n = 151) | P value (men vs women) | |
| Age (y) | 37.9 ± 7.22 | 39.7 ± 7.1 | 37.2 ± 7.1 | 0.03 |
| Ethnicity [n (%)] | 0.75 | |||
| Hispanic or Latino | 7 (3.2) | 3 (4.5) | 4 (2.6) | |
| Not Hispanic or Latino | 206 (94.9) | 62 (93.9) | 144 (95.4) | |
| Unknown | 4 (1.8) | 1 (1.5) | 3 (2.0) | |
| Race [n (%)] | 0.05 | |||
| American Indian or Alaska Native | 1 (0.5) | 0 (0.0) | 1 (0.7) | |
| Asian | 14 (6.4) | 7 (10.6) | 7 (4.6) | |
| Native Hawaiian or Pacific Islander | 0 (0.0) | 0 (0.0) | 0 (0.0) | |
| Black or African American | 27 (12.4) | 3 (4.5) | 24 (15.9) | |
| White | 167 (77.0) | 54 (81.8) | 113 (74.8) | |
| More than 1 race | 7 (3.2) | 1 (1.5) | 6 (4.0) | |
| Unknown | 1 (0.5) | 1 (1.5) | 0 (0.0) | |
| Anthropometric data | ||||
| Clinic weight (kg) | 71.8 ± 9.2 | 81.0 ± 7.8 | 67.8 ± 6.6 | <0.0001 |
| BMI (kg/m2) | 25.2 ± 1.7 | 25.8 ± 1.7 | 24.9 ± 1.7 | 0.0001 |
| Fat (%) | 33.1 ± 6.3 | 25.8 ± 3.3 | 36.2 ± 4.3 | <0.0001 |
| Fat mass (kg) | 23.6 ± 4.6 | 21.0 ± 3.8 | 24.7 ± 4.5 | <0.0001 |
| Fat-free mass (kg) | 48.2 ± 9.0 | 60.0 ± 5.6 | 43.1 ± 4.0 | <0.0001 |
| Glucose and lipid panel (mg/dL) | ||||
| Fasting glucose | 82.5 ± 5.9 | 85.6 ± 5.5 | 81.2 ± 5.6 | <0.0001 |
| Cholesterol total | 170.9 ± 31.8 | 179.8 ± 32.7 | 167.0 ± 30.8 | 0.02 |
| LDL cholesterol | 100.6 ± 27.4 | 112.3 ± 28.1 | 95.5 ± 25.5 | 0.0001 |
| HDL cholesterol | 49.2 ± 13.0 | 40.0 ± 8.25 | 53.2 ± 12.6 | <0.0001 |
| Triglycerides | 105.3 ± 55.8 | 137.3 ± 66.2 | 91.2 ± 43.9 | <0.0001 |
CALERIE, Comprehensive Assessment of Long-Term Effects of Reducing Intake of Energy.
Mean ± SD (all such values).
Body mass stability
Metabolic body weight was obtained in the clinic at 5 time points during baseline testing, commensurate with DLW dosing and urine collection days: days 0, 7, 14, 21, and 28. Body mass was stable during the first DLW study: day 14 minus day 0 = −0.0009 ± 0.79 kg. During the second DLW study (day 28 − day 14), body mass decreased slightly (−0.21 ± 0.76 kg). Across 28 d of baseline testing, a small, albeit significant, mass loss of −0.23 ± 0.88 kg (P = 0.001) was found.
Energy expenditure
Energy expenditure measured by DLW was 2422 ± 404 kcal/d (range: 1572–3687 kcal/d) during the first 14-d assessment and 2465 ± 408 kcal/d (range: 1700–3671 kcal/d) during the second 14-d assessment (Figure 1A). The intraclass correlation coefficient for the 2 measures of TDEE was 0.90. The mean baseline 28-d TDEE was 2443 ± 397 kcal/d (range: 1636–3625 kcal/d). Baseline TDEE in men was ∼26% (580 kcal/d) higher than in women (P < 0.0001; Table 2). TDEE did not differ significantly between the 3 study sites (PBRC: 2417 ± 441; Tufts: 2477 ± 379; Washington University: 2440 ± 362 kcal/d; P = 0.47).
FIGURE 1.

Comparison of the sequential measures of TDEE (A) and RMR (C) during weight stability at baseline and the relation of TDEE (B) and RMR (D) with FFM. FFM, fat-free mass; RMR, resting metabolic rate; TDEE, total daily energy expenditure.
TABLE 2.
Energy balance of the CALERIE 2 subjects at baseline1
| All (n = 217) | Men (n = 66) | Women (n = 151) | P value (men vs women) | |
| Self-reported energy intake | ||||
| Total energy intake (kcal/d) | 2099 ± 535.3 | 2502 ± 503.6 | 1923 ± 447.3 | < 0.0001 |
| Protein (% of energy) | 16.8 ± 3.2 | 17.3 ± 3.16 | 16.6 ± 3.3 | 0.11 |
| Fat (% of energy) | 33.8 ± 5.1 | 33.8 ± 5.4 | 33.9 ± 4.9 | 0.99 |
| Carbohydrate (% of energy) | 46.2 ± 6.5 | 45.7 ± 7.3 | 46.4 ± 6.2 | 0.47 |
| Alcohol (% of energy) | 3.2 ± 3.6 | 3.3 ± 3.6 | 3.2 ± 3.7 | 0.56 |
| Energy expenditure | ||||
| Mean TDEE (kcal/d)2 | 2443 ± 396.5 | 2850 ± 361.3 | 2266 ± 255.6 | <0.0001 |
| Mean RMR (kcal/d)2 | 1410 ± 200.5 | 1610 ± 166.9 | 1322 ± 143.4 | <0.0001 |
| PAL | ||||
| Mean PAL (TDEE/RMR)2 | 1.74 ± 0.18 | 1.78 ± 0.20 | 1.72 ± 0.17 | 0.02 |
All values are means ± SDs. Wilcoxon's Mann-Whitney U test was used to compare continuous variables across 2 groups (sex, BMI category), and the Kruskal-Wallis test was used to compare continuous variables across the 3 study sites. CALERIE, Comprehensive Assessment of Long-Term Effects of Reducing Intake of Energy; PAL, physical activity level; RMR, resting metabolic rate; TDEE, total daily energy expenditure.
Mean of the 2 baseline assessments.
Mean TDEE (n = 217) was associated with body weight (R2 = 0.48, P < 0.0001). Demographics (sex and age) together with body weight described 57% of the variance in the mean TDEE during weight stability at baseline:
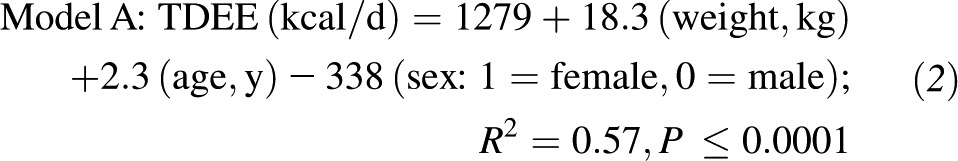 |
Mean TDEE was strongly correlated with fat-free mass (R2 = 0.64, P < 0.001; Figure 1B) and weakly with fat mass (R2 = 0.20, P = 0.04; data not shown). Sixty-five percent of the variance in TDEE during weight stability was accounted for by fat-free mass, fat mass, age, and sex as predictors:
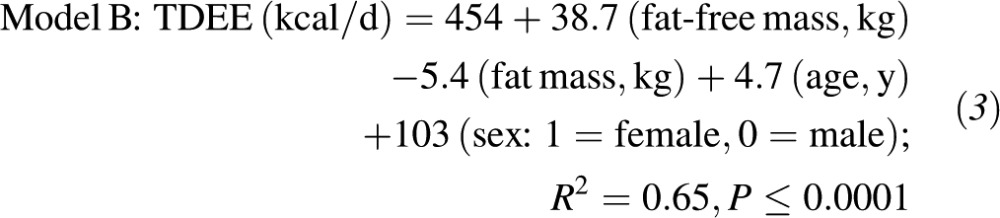 |
Given that the relation between mean TDEE and fat-free mass (Figure 1B) indicated a potential interaction for sex (intersecting regression lines for males and females), we tested for a sex interaction in model B (see Equation 3). We found a significant sex interaction (P = 0.04) for model B, which included all the covariates. However, when we tested for a sex interaction with each of the covariates independently, only a significant interaction between sex and age was evident (P = 0.04). No significant interaction between sex and fat mass or sex and fat-free mass was found.
Finally, we determined the additional effect of self-reported physical activity (determined by mean MET-h/d by PAR during the DLW) on mean TDEE. After adjustment for TDEE for the covariates in model B, PAL was a significant and independent determinant of TDEE (P = 0.0002), which increased the predictability of TDEE from 65% to 68%.
The baseline regression models for TDEE were also run with the inclusion of height (cm); however, the coefficient for height was not significant, and height did not further explain the variability in total energy expenditure at baseline. Our cohort was unbalanced with respect to race and ethnicity; therefore, we did not have sufficient power to determine whether race or ethnicity was a significant determinant of TDEE.
RMR was 1407 ± 202 kcal/d (range: 965–1932 kcal/d) during the first assessment and 1415 ± 211 kcal/d (range: 993–1971 kcal/d) during the second assessment (Figure 1C), with an intraclass correlation coefficient of 0.89 between the 2 measures. The mean resting energy expenditure was 1410 ± 200 kcal/d (range: 1017–1951 kcal/d). Resting energy expenditure in men was ∼22% (290 kcal/d) higher than in women (P < 0.0001; Table 2). Resting energy expenditure was not different in subjects enrolled at the 3 study sites (PBRC: 1399 ± 224; Tufts: 1394 ± 201; Washington University: 1439 ± 167 kcal/d; P = 0.16). Resting metabolic rate was positively correlated with body weight (R2 = 0.72, P < 0.0001) and fat-free mass (R2 = 0.62, P < 0.0001; Figure 1D) but not with fat mass (R2 = 0.01, P = 0.10).
Energy intake
Self-reported energy intake was 2054 ± 535 and 2142 ± 630 kcal/d during the first and second DLW studies, respectively. As shown in Table 2, the mean self-reported energy intake during baseline was 2099 ± 535 kcal/d for all subjects. Men (range: 1503–4330 kcal/d) reported consuming ∼30% more than women (mean: 580 kcal/d; range: 1100–3431 kcal/d; P < 0.0001). No sex differences were noted for self-reported macronutrient intake.
Self-reported energy intake was positively associated with mean TDEE at baseline (Figure 2A; R2 = 0.34, P < 0.0001). In comparison with the mean TDEE from the two 14-d DLW results, both men and women significantly underreported energy intake by ∼350 kcal/d (12% and 15%, respectively; P < 0.0001; Figure 2A). Individuals classified as normal weight (BMI <25) tended to underreport by ∼260 kcal/d, or 11.5% (self-reported energy intake: 2043 ± 476; mean TDEE: 2303 ± 321, kcal/d; P < 0.0001), whereas overweight subjects underreported by ∼420 kcal/d, or 16% (self-reported energy intake: 2150 ± 581; mean TDEE: 2570 ± 416, kcal/d; P < 0.0001).
FIGURE 2.

Comparison of self-reported energy intake (A) and physical activity (B) compared with total energy expenditure measured by doubly labeled water in 219 normal-weight and overweight subjects enrolled in CALERIE 2. CALERIE, Comprehensive Assessment of Long-Term Effects of Reducing Intake of Energy; EI, energy intake; PAR, physical activity recall; TDEE, total daily energy expenditure.
Mean energy intake over the baseline period estimated from TDEE measured by DLW, and change in body mass was 2416 ± 442 kcal/d (range: 1459–3572 kcal/d). The difference between the mean TDEE measured during the 2 consecutive DLW periods and the energy intake calculated from TDEE and changes in body mass across the 28-d baseline period was −29 ± 243 kcal/d (range: −167–114 kcal/d) such that TDEE slightly (∼1%) but not significantly (P = 0.07) overestimated the energy requirement for weight maintenance.
Physical activity
Men and women did not differ on self-reported time spent in physical activity, MET-h/d, or MET-h/wk. Total energy expenditure estimated from the 7-d PAR, and RMR was 2021 ± 320 kcal/d (men: 2321 ± 272; women: 1889 ± 241, kcal/d; P < 0.0001). PAR TDEE was positively correlated with mean TDEE at baseline (R2 = 0.60, P < 0.0001; Figure 2B) but was ∼400 kcal/d (or 17%) lower on average than the mean TDEE at baseline. Total energy expenditure and RMR were positively associated (R2 = 0.60, P < 0.0001). The mean PAL at baseline was 1.74 ± 0.18 and was significantly higher in men than in women (Table 2). Furthermore, PAL differed significantly across the 3 study sites (PBRC: 1.73 ± 0.21; Tufts: 1.78 ± 0.16; Washington University: 1.70 ± 0.17, P < 0.01).
DISCUSSION
The 3-center CALERIE 2 study included a comprehensive assessment of energy requirements over a 28-d period at baseline, during which 2 sequential 14-d measures of free-living energy expenditure by DLW were paired with measures of body mass and body composition to determine energy requirements. With the use of this unique set of data, we developed regression equations for estimating energy requirements that can be used for nonobese individuals. In the cohort of 217 men and women, we found that 57% of the variance in total daily energy requirements during weight maintenance at baseline was explained by body weight and demographic characteristics (age and sex) of the individuals. When body composition (fat mass and fat-free mass) measured by DXA was added to our prediction model, an additional 10% of the variance in daily energy requirements was explained. In comparison with this objective assessment of energy requirements, over the same time interval, individuals significantly underreported energy intake by ∼15% (or 350 kcal/d), and this effect was more profound in individuals who were overweight. TDEE computed from the 7-d PAR and measured RMR was also significantly underestimated in both men and women, implying that individuals underreported the time spent in activities of daily living.
Indeed fat-free mass is known as the single best determinant of TDEE (18, 19), and it is not surprising that when we used fat-free mass and fat mass alongside of age and sex, a greater degree of variability in TDEE was explained in comparison with using body weight, age, and sex alone. This clearly emphasizes the importance of taking into account body composition when deriving an estimate of energy requirements from prediction equations. Nonetheless, a measure of body composition is not always feasible in clinical settings and we thereby presented 2 independent prediction models with potential use in clinical settings.
In theory, reported dietary intakes of weight-stable subjects could be used to estimate energy requirements; however, the results from DLW studies reported here and previously (20, 21) provide compelling evidence of significant underreporting. Underreporting in our cohort was ∼15%, which is at the lower end of that observed in the literature (10–40%) (22, 23) and probably reflective of the extensive training CALERIE 2 participants received from Registered Dietitians. However, our data agree with previous observations that show larger underreporting in overweight subjects (24). Because of the poor validity and reliability of subjective assessments of energy intake and the expense associated with DLW, investigators and clinicians have to rely on surrogate tools, such as published equations derived from the objective measures, to estimate energy requirements.
One of the most commonly used approaches for estimating energy requirements for research and clinical practice is to estimate basal metabolic rate and apply a multiplier to account for levels of habitual physical activity. Sex-specific equations of Harris-Benedict (25) and more recently the World Health Organization (26) are most often cited. There remains widespread use of these equations despite estimates that, compared with DLW, predicted energy requirements are underestimated by 20% (27). Although these equations for estimating basal metabolic rate perform quite well when compared with the measurement of RMR by indirect calorimetry (28, 29), the wide day-to-day variability of physical activity (18) and the inability to quantify physical activity accurately contribute to a lack of agreement between TDEE estimated from RMR and PAL and TDEE measured by DLW.
In the past few years, several attempts have been made to develop equations to estimate energy requirements in humans. For the most part, these equations have been constructed from data that were obtained by DLW studies conducted at many research units. A commonly referenced data set is that compiled by the Institute of Medicine in 2005 (6). DLW data, as well as demographic and basic anthropometry data, were obtained from studies performed in the United States, the Netherlands, the United Kingdom, Australia, and Sweden and collapsed into 2 data sets; 1 for adults with normal body weight and 1 for overweight and obese individuals. The normative data set includes data from 407 normal-weight (BMI: 18.5–25.0), adult (>19 y) men (n = 169) and women (n = 238). The overweight and obese data set includes data from 360 adult (>19 y) men (n = 165) and women (n = 195) with a BMI >30.0. From these 2 data sets, regression equations for estimating energy requirements were derived and therefore applicable to normal weight and overweight/obese adults. Estimates of TDEE and therefore energy requirements are based on age, height, weight, and physical activity category.
Other compiled data sets of DLW data have been published with regression equations for energy requirements of adults (30, 31) and children (7). These data sets now amount to >1000 DLW studies. However, along with the strength of a large data set, there are limitations when merging data across numerous research groups. These limitations include differences in isotope dosing, length of study, use of different analytic techniques, and different mass spectrometry laboratories. Probably the most important limitation is not knowing whether these compiled data sets only included data from individuals who were weight stable and thereby that the TDEE alone can be assumed to represent energy intake, and hence energy requirements, during weight maintenance. Seldom do these reports make mention of body weight stability in their cohorts.
Dynamic models of energy balance have been developed and validated to derive individual estimates for 1) energy requirements during weight maintenance and 2) energy intakes during both over- and underfeeding (32–35). These more complex mathematical approaches not only take into account anthropometric characteristics such as age, height, sex, baseline weight, and baseline body composition, but PAL and basal metabolic rate are also included. A head-to-head comparison of these mathematical models, against commonly used methods for determining energy requirements (eg, basal/RMR estimates adjusted for physical activity), preexisting regression equations from DLW data, and our current equations using a third party data set is an important study that remains to be done. In addition, testing the accuracy of these equations for estimating energy requirements in individuals with varying PALs is equally important. Also note that, despite robust measures of body composition and weight stability, >30% of the variance in TDEE remains to be explained.
During the CALERIE 2 study at baseline, participants recorded body weight daily, and 5 metabolic weights were collected in the clinic during the 2 back-to-back DLW studies. In addition, body composition was assessed by a DXA scan performed on either side of the DLW studies. As presented in the results section, body mass throughout the 28-d baseline period was stable despite a statistically significant decrease of 227 g. An accepted criterion for weight stability in controlled feeding studies is fluctuations in weight ≤250 g/d (36, 37). On the basis of the 227-g change in body mass observed across the 28-d baseline period, one could assume weight stability in our cohort. Importantly, total energy expenditure, RMR, and self-reported energy intake differed between the 2 assessments at baseline, which further supports weight stability and justifies our use of the TDEE measurements alone to estimate the energy requirement. For arguments sake, we also estimated energy intake for each subject from the mean TDEE and change in body weight (energy stores) during the 28-d baseline period. The TDEE adjusted for body weight change was not significantly different from the mean of the 2 TDEE values, but on average overestimated the true energy requirements by 1%.
We highlighted the importance of assessing energy requirements at baseline in weight-stable individuals in studies that involve individualized caloric prescriptions relative to baseline energy requirements. Our data set provided a unique opportunity to generate regression equations to estimate energy requirements in a relatively large nonobese sample of 3 US suburban/urban populations. These new equations for nonobese individuals represent the best estimate of energy intake (1-mo measure) of individuals living in suburban US cities. To understand the value of the energy requirement estimates from equations derived from whole-body energy expenditure over 14 or 28 d with DLW, head-to-head comparisons between commonly used methods and equations are warranted.
Acknowledgments
We are deeply grateful to the individuals who volunteered for participation in the study. The complete list of CALERIE investigators and staff is provided in reference 1.
The authors’ responsibilities were as follows—LMR, ER, SB Roberts, and WEK: designed the research (project conception, development of overall research plan, and study oversight); LMR, SKD, CKM, LF, and SB Racette: conducted the research (hands-on conduct of the experiments and data collection); WWW: provided essential reagents or provided essential materials (contributed by providing animals, constructs, databases, etc, necessary for research); MB: analyzed the data or performed the statistical analysis; LMR and ER: wrote the manuscript (only authors who made a major contribution); and LMR, ER, and WEK: had primary responsibility for the final content. No financial conflicts of interest were disclosed by the authors in relation to this body of work.
Footnotes
Abbreviations used: CALERIE, Comprehensive Assessment of Long-Term Effects of Reducing Intake of Energy; DLW, doubly labeled water; DXA, dual-energy X-ray absorptiometry; MET, metabolic equivalent task; PAL, physical activity level; PAR, physical activity recall; PBRC, Pennington Biomedical Research Center; RMR, resting metabolic rate; TDEE, total daily energy expenditure.
REFERENCES
- 1.Rochon J, Bales CW, Ravussin E, Redman LM, Holloszy JO, Racette SB, Roberts SB, Das SK, Romashkan S, Galan KM, et al. Design and conduct of the CALERIE study: comprehensive assessment of the long-term effects of reducing intake of energy. J Gerontol A Biol Sci Med Sci 2011;66:97–108. [DOI] [PMC free article] [PubMed] [Google Scholar]
- 2.Racette SB, Das SK, Bhapkar M, Hadley EC, Roberts SB, Ravussin E, Pieper C, DeLany JP, Kraus WE, Rochon J, et al. Approaches for quantifying energy intake and %calorie restriction during calorie restriction interventions in humans: the multicenter CALERIE study. Am J Physiol Endocrinol Metab 2012;302:E441–8. [DOI] [PMC free article] [PubMed] [Google Scholar]
- 3.Rosenbaum M, Ravussin E, Matthews DE, Gilker C, Ferraro R, Heymsfield SB, Hirsch J, Leibel RL. A comparative study of different means of assessing long-term energy expenditure in humans. Am J Physiol 1996;270:R496–504. [DOI] [PubMed] [Google Scholar]
- 4.Ravussin E, Lillioja S, Anderson TE, Christin L, Bogardus C. Determinants of 24-hour energy expenditure in man. Methods and results using a respiratory chamber. J Clin Invest 1986;78:1568–78. [DOI] [PMC free article] [PubMed] [Google Scholar]
- 5.Ferraro R, Boyce VL, Swinburn B, De Gregorio M, Ravussin E. Energy cost of physical activity on a metabolic ward in relationship to obesity. Am J Clin Nutr 1991;53:1368–71. [DOI] [PubMed] [Google Scholar]
- 6.Institute of Medicine. Dietary Reference Intakes for energy, carbohydrate, fiber, fat, fatty acids, cholesterol, protein, and amino acids. Washington, DC: Institute of Medicine, 2002. [DOI] [PubMed]
- 7.Swinburn BA, Jolley D, Kremer PJ, Salbe AD, Ravussin E. Estimating the effects of energy imbalance on changes in body weight in children. Am J Clin Nutr 2006;83:859–63. [DOI] [PubMed] [Google Scholar]
- 8.Rothenberg E, Bosaeus I, Lernfelt B, Landahl S, Steen B. Energy intake and expenditure: validation of a diet history by heart rate monitoring, activity diary and doubly labeled water. Eur J Clin Nutr 1998;52:832–8. [DOI] [PubMed] [Google Scholar]
- 9.Seale JL, Rumpler WV. Comparison of energy expenditure measurements by diet records, energy intake balance, doubly labeled water and room calorimetry. Eur J Clin Nutr 1997;51:856–63. [DOI] [PubMed] [Google Scholar]
- 10.Tomoyasu NJ, Toth MJ, Poehlman ET. Misreporting of total energy intake in older African Americans. Int J Obes Relat Metab Disord 2000;24:20–6. [DOI] [PubMed] [Google Scholar]
- 11.Rickman AD, Williamson DA, Martin CK, Gilhooly CH, Stein RI, Bales CW, Roberts S, Das SK. The CALERIE Study: design and methods of an innovative 25% caloric restriction intervention. Contemp Clin Trials 2011;32:874–81. [DOI] [PMC free article] [PubMed] [Google Scholar]
- 12.Stewart TM, Bhapkar M, Das S, Galan K, Martin CK, McAdams L, Pieper C, Redman L, Roberts S, Stein RI, et al. Comprehensive Assessment of Long-Term Effects of Reducing Intake of Energy Phase 2 (CALERIE Phase 2) screening and recruitment: methods and results. Contemp Clin Trials 2013;34:10–20. [DOI] [PMC free article] [PubMed] [Google Scholar]
- 13.Wong WW, Clarke LL, Llaurador M, Klein PD. A new zinc product for the reduction of water in physiological fluids to hydrogen gas for 2H/1H isotope ratio measurements. Eur J Clin Nutr 1992;46:69–71. [PubMed] [Google Scholar]
- 14.Wong WW, Lee LS, Klein PD. Deuterium and oxygen-18 measurements on microliter samples of urine, plasma, saliva, and human milk. Am J Clin Nutr 1987;45:905–13. [DOI] [PubMed] [Google Scholar]
- 15.Schoeller DA. Measurement of energy expenditure in free-living humans by using doubly labeled water. J Nutr 1988;118:1278–89. [DOI] [PubMed] [Google Scholar]
- 16.Prentice AM, ed. The doubly-labeled water method for measuring energy expenditure: technical recommendations for use in humans. Vienna, Austria: International Atomic Energy Agency, 1990.
- 17.Taylor-Piliae RE, Fair JM, Haskell WL, Varady AN, Iribarren C, Hlatky MA, Go AS, Fortmann SP. Validation of the Stanford Brief Activity Survey: examining psychological factors and physical activity levels in older adults. J Phys Act Health 2010;7:87–94. [DOI] [PMC free article] [PubMed] [Google Scholar]
- 18.Rising R, Harper IT, Fontvielle AM, Ferraro RT, Spraul M, Ravussin E. Determinants of total daily energy expenditure: variability in physical activity. Am J Clin Nutr 1994;59:800–4. [DOI] [PubMed] [Google Scholar]
- 19.Black AE, Coward WA, Cole TJ, Prentice AM. Human energy expenditure in affluent societies: an analysis of 574 doubly-labelled water measurements. Eur J Clin Nutr 1996;50:72–92. [PubMed] [Google Scholar]
- 20.Black AE, Prentice AM, Goldberg GR, Jebb SA, Bingham SA, Livingstone MB, Coward WA. Measurements of total energy expenditure provide insights into the validity of dietary measurements of energy intake. J Am Diet Assoc 1993;93:572–9. [DOI] [PubMed] [Google Scholar]
- 21.Schoeller DA. Limitations in the assessment of dietary energy intake by self-report. Metabolism 1995;44(suppl 2):18–22. [DOI] [PubMed] [Google Scholar]
- 22.Johnson RK, Soultanakis RP, Matthews DE. Literacy and body fatness are associated with underreporting of energy intake in US low-income women using the multiple-pass 24-hour recall: a doubly labeled water study. J Am Diet Assoc 1998;98:1136–40. [DOI] [PubMed] [Google Scholar]
- 23.Trabulsi J, Schoeller DA. Evaluation of dietary assessment instruments against doubly labeled water, a biomarker of habitual energy intake. American journal of physiology Endocrinology and metabolism. Am J Physiol Endocrinol Metab 2001;281:E891–9. [DOI] [PubMed] [Google Scholar]
- 24.Prentice AM, Black AE, Coward WA, Cole TJ. Energy expenditure in overweight and obese adults in affluent societies: an analysis of 319 doubly-labelled water measurements. Eur J Clin Nutr 1996;50:93–7. [PubMed] [Google Scholar]
- 25.Harris JA, Benedict FG. A biometric study of human basal metabolism. Proc Natl Acad Sci USA 1918;4:370–3. [DOI] [PMC free article] [PubMed] [Google Scholar]
- 26.WHO. Use and interpretation of anthropometric indicators of nutritional status. WHO Working Group. Bull World Health Organ 1986;64:929–41. [PMC free article] [PubMed] [Google Scholar]
- 27.Raymond NC, Peterson RE, Bartholome LT, Raatz SK, Jensen MD, Levine JA. Comparisons of energy intake and energy expenditure in overweight and obese women with and without binge eating disorder. Obesity (Silver Spring) 2012;20:765–72. [DOI] [PMC free article] [PubMed] [Google Scholar]
- 28.Frankenfield D, Roth-Yousey L, Compher C. Comparison of predictive equations for resting metabolic rate in healthy nonobese and obese adults: a systematic review. J Am Diet Assoc 2005;105:775–89. [DOI] [PubMed] [Google Scholar]
- 29.Schofield WN. Predicting basal metabolic rate, new standards and review of previous work. Hum Nutr Clin Nutr 1985;39(suppl 1):5–41. [PubMed] [Google Scholar]
- 30.Swinburn B, Sacks G, Ravussin E. Increased food energy supply is more than sufficient to explain the US epidemic of obesity. Am J Clin Nutr 2009;90:1453–6. [DOI] [PubMed] [Google Scholar]
- 31.Swinburn BA, Sacks G, Lo SK, Westerterp KR, Rush EC, Rosenbaum M, Luke A, Schoeller DA, DeLany JP, Butte NF, et al. Estimating the changes in energy flux that characterize the rise in obesity prevalence. Am J Clin Nutr 2009;89:1723–8. [DOI] [PMC free article] [PubMed] [Google Scholar]
- 32.Hall KD, Sacks G, Chandramohan D, Chow CC, Wang YC, Gortmaker SL, Swinburn BA. Quantification of the effect of energy imbalance on bodyweight. Lancet 2011;378:826–37. [DOI] [PMC free article] [PubMed]
- 33.Thomas DM, Schoeller DA, Redman LA, Martin CK, Levine JA, Heymsfield SB. A computational model to determine energy intake during weight loss. Am J Clin Nutr 2010;92:1326–31. [DOI] [PMC free article] [PubMed]
- 34.Hall KD, Chow CC. Estimating changes in free-living energy intake and its confidence interval. Am J Clin Nutr 2011;94:66–74. [DOI] [PMC free article] [PubMed] [Google Scholar]
- 35.Thomas DM, Martin CK, Heymsfield S, Redman LM, Schoeller DA, Levine JA. A simple model predicting individual weight change in humans. J Biol Dyn 2011;5:579–99. [DOI] [PMC free article] [PubMed] [Google Scholar]
- 36.Bray GA, Smith SR, de Jonge L, Xie H, Rood J, Martin CK, Most M, Brock C, Mancuso S, Redman LM. Effect of dietary protein content on weight gain, energy expenditure, and body composition during overeating: a randomized controlled trial. JAMA 2012;307:47–55. [DOI] [PMC free article] [PubMed] [Google Scholar]
- 37.Redman LM, Heilbronn LK, Martin CK, Alfonso A, Smith SR, Ravussin E. Effect of calorie restriction with or without exercise on body composition and fat distribution. J Clin Endocrinol Metab 2007;92:865–72. [DOI] [PMC free article] [PubMed] [Google Scholar]