

Abstract
Purpose
Cortical visual impairment (CVI) is a leading cause of bilateral vision impairment. Since many patients with CVI cannot perform an optotype test, their acuity is often measured with a grating stimulus using a preferential looking (PL) test or the visual evoked potential (VEP) recording. The purpose of this study is to determine the relationship between VEP vernier acuity, VEP grating acuity and behavioral grating acuity in patients with CVI.
Methods
Sweep VEP vernier acuity, sweep VEP grating acuity, and behavioral grating acuity (measured with PL cards) were measured in 29 patients with CVI. The patients ranged in age from 3.2 to 22.7 years (mean: 12.3; SD: 5.3). Because the measures of vernier acuity and grating acuity have different units, the results were expressed as the log deficit (with normal being 30 c/deg and 0.5 arc min respectively).
Results
VEP grating acuity loss and VEP vernier acuity loss were significantly related (r=0.70) with a slope of 1.31, indicating that indicating that on average, vernier acuity showed a 0.2 log unit deficit compared to VEP grating acuity. Behavioral grating acuity loss and VEP grating acuity loss were also significantly related (r=0.64) with a slope of 1.55, indicating that behavioral acuity was more reduced (by approximately 0.3 log unit). VEP vernier acuity loss and behavioral grating acuity loss were significantly related (r=0.66) with a slope of 0.85, indicating that behavioral acuity and VEP vernier acuity showed a similar magnitude of reduction. A Bland-Altman comparison between the VEP vernier acuity method and the behavioral acuity method showed a flat slope (0.30), indicating that the two measures produce similar visual acuity measures across the range of acuity levels.
Conclusions
In patients with CVI, VEP vernier acuity showed greater deficits than VEP grating acuity and was more similar to the behavioral measures of grating acuity.
Keywords: cortical visual impairment, cerebral visual impairment, vernier visual acuity, visual evoked potential, low vision
Cortical visual impairment (CVI), also known as cerebral visual impairment, is the leading cause of bilateral vision impairment in children1–3. CVI is defined as visual impairment caused by damage to the retrogeniculate visual pathway (the optic radiations, visual cortex and/or associative visual areas) in the absence of ocular pathology1–5. The most common etiology of CVI is hypoxic-ischemic injury1–5. Other causes include hydrocephalus, encephalitis, head trauma (including shaken baby syndrome) and metabolic disorders1–5.
Because the various etiologies of CVI typically result in global brain injury, patients with CVI often have multiple mental and physical disabilities in addition to vision loss3,6–8. CVI is almost always associated with other serious neurological abnormalities such as cognitive delay, cerebral palsy, quadriplegia, seizure disorder, and bilateral hearing loss3,6–8. Therefore, patients with CVI are often non-verbal, non-mobile and have difficulty understanding and communicating. Determining quantitative information about the visual acuity of a child with CVI can be challenging, yet such information is extremely valuable to their parents and teachers.
Since many patients with CVI are unable to perform an optotype visual acuity test (i.e. the ability to identify letters or symbols), their acuity is often measured with a forced-choice preferential looking (PL) test or the sweep visual evoked potential (VEP) test. In their traditional forms, both techniques use a grating pattern as the stimulus, and therefore give a measure of grating acuity (i.e. a determination of the finest stripe size that can be resolved). In general, children with vision impairment show lower visual acuity on behavioral measures of acuity compared to VEP measures9–11. However, both techniques have been shown to be reliable and valid measures of visual acuity in patients with CVI9,12–16. A study evaluating the development of visual acuity in children with CVI from 6 months to 6 years of age showed modest increases in both PL and VEP grating acuity; however, the rate of improvement was lower than normal17.
Grating acuity (measured with the sweep VEP or the PL technique) does not always precisely agree with optotype acuity18–23. In children with normal vision, there is fairly good agreement between the two measures of acuity, although recognition acuity is usually slightly better than grating acuity from the pre-school age onward20. In contrast, for children with vision impairment, grating acuity is typically better than optotype acuity9,18,21, and the disparity increases with poorer visual acuity21. The largest and most consistent discrepancies have been reported in amblyopia22–24 and disorders involving the optic nerve22,25. In both conditions, the origin of vision loss is not purely ocular and neurological abnormality is involved26,27.
Like amblyopia and optic nerve disorders, CVI is another etiology of vision impairment involving cerebral damage. van Hof-van Duin et al.28 found much worse optotype acuity than grating acuity in children with hypoxic-ischemic encephalopathy and/or prenatal brain lesions. In fact, the size of the discrepancy between the two measures of acuity correlated significantly with ultrasound evidence of brain abnormality and the presence of cerebral palsy. It is thought that optotype acuity is subserved by cortical mechanisms that support the discrimination of different spatial patterns (i.e. letters), rather than simple pattern detection18,19.
Vernier acuity, the ability to detect a misalignment of two lines, is a form of hyperacuity29 that can be measured psychophysically or electrophysiologically29–35. Both psychophysical and VEP studies have shown that vernier and grating acuity develop at different rates, with grating acuity approaching adult levels earlier than vernier acuity30,32,33. This suggests that the two functions are governed by different mechanisms30,32,33. It has also been suggested that vernier acuity, like optotype acuity, is preferentially diminished in neurological conditions such as amblyopia31 and CVI19. This theory was first confirmed in patients with amblyopia31,34,35. Several studies have shown a more severe loss of vernier acuity than grating acuity in patients with amblyopia31,34,35. Furthermore, it has been shown that vernier acuity loss may correlate more precisely with optotype acuity loss than does grating acuity loss in patients with amblyopia35. Skoczenski and Good19 tested children with CVI and found a similar disproportionate reduction in VEP vernier acuity compared to VEP grating acuity. However, a comparison to a behavioral measure of acuity was not made in that study.
Both current methods of measuring visual acuity in this population (PL and sweep VEP) are measures of grating acuity. However, grating acuity may not be an optimum indicator for visual performance in patients with CVI. The relevance of the sweep VEP measure of acuity may be improved by testing an aspect of vision that is more strongly degraded by pathological changes affecting central vision than a measure of grating acuity. Furthermore, vernier VEP testing may be particularly helpful when a patient is unable to perform behavioral testing secondary to cognitive and motor limitations. Currently examiners must rely solely on a grating VEP measure of visual acuity for these patients. The purpose of this study is to determine the relationship between VEP vernier acuity, VEP grating acuity and behavioral grating acuity in patients with CVI.
METHODS
Subjects
A study was performed on 37 patients (14 female and 23 male) with CVI. Three measures of acuity: sweep VEP vernier acuity, sweep VEP grating acuity, and forced-choice preferential looking (PL) grating acuity were attempted on all subjects. All three measures of acuity were obtained in 29 of the 37 patients tested. Both VEP grating acuity and VEP vernier acuity were measurable in all patients. Behavioral (PL) acuity could not be assessed in eight of the patients, and these patients were excluded from the comparison. Each subject received a complete eye exam prior to data collection. Patients with ocular pathology or whose reduction in visual acuity could be attributed to a condition other than CVI were excluded. Acuities were obtained with binocular viewing and significant refractive error (greater than +2.50DS, −1.00DS or −1.25cyl) was corrected prior to visual acuity testing. The experimental protocol was approved by the Committee of the Protection of Human Subjects at the University of California, at Berkeley, and informed consent was obtained from the parents or legal guardians.
The 29 included patients ranged in age from 3.2 to 22.7 years (median: 13.6; mean: 12.1; SD: 5.4). Eight patients were born prematurely, 17 were full-term and 4 had unknown birth history. Hypoxic injury was the most common etiology (n=19; 52%), followed by infection (n=5; 14%), hydrocephalus (n=4; 10%), and trauma (n=1; 3%). The etiology of CVI was unknown in 6 of the patients (21%). Twenty-one patients (72%) had a seizure disorder, 22 patients (76%) had cerebral palsy and 20 patients (69%) had paralysis requiring the use of a wheelchair.
VEP Technique
Sweep VEPs were recorded using the NUDiva system (Smith-Kettlewell, San Francisco, CA)9,15,20,30,36. Electrodes were placed 3cm above the inion and 3cm to the left and to the right, with a reference electrode at the vertex and a ground electrode further forward on the scalp.
Grating Stimulus
The patients were presented with 80% Michelson contrast sinusoidal gratings on a video monitor. During each 10-second trial, the spatial frequency of the reversing grating pattern was incremented logarithmically in 19 steps, from low to high spatial frequency37. The gratings were modulated at a rate of 15 contrast reversals per second (or 7.5 Hz). The viewing distance was initially 100 cm in order to present a range of spatial frequencies from 1 to 10 cycles/degree. If significant VEP responses remained at the end of this sweep range, the viewing distance was increased to 200 cm (for a 2 to 20 cy/deg sweep range). Sweep VEP normative data suggest that children reach normal adult-like acuity by the age of 6–8 months36.
Vernier Stimulus
The patients were presented with 80% Michelson contrast vertical square wave gratings on a video monitor. Portions of each vertical bar were temporally modulated to make offsets appear and disappear at a fixed temporal frequency of 5 Hz. The vernier offset size changed in 19 logarithmic steps from small to large offsets over each 10-second trial presentation. Normative data suggest that children reach adult-like vernier acuity by the age of 5 years32. Five young adults with normal visual acuity were tested with the vernier VEP test to generate normative data for the specific test parameters used in this study. The average normative vernier acuity for this system was 0.51 min arc (SD: 0.04). This normative value is similar to what was reported by Skoczenski and Good19. They found that by 5 years of age, children with normal vision had a vernier acuity threshold of approximately 0.6 min arc.
Most patients sat in their wheelchair during the VEP testing and a few patients sat on their parent’s lap. During each 10-second trial, the experimenter observed the patient’s fixation and paused the VEP trial if the child looked away and resumed the trial when re-fixation occurred. Dangling a small toy in the middle of the video monitor screen encouraged fixation and accommodation to the plane of the video monitor.
The patient’s electroencephalogram (EEG) recorded during multiple presentations of both stimulus types. The EEG was digitized and filtered to obtain the amplitude and phase of the VEP response at the first two harmonics of the stimulus temporal frequency. The resulting VEP response was evaluated as a function of spatial frequency (grating stimulus) or offset size (vernier stimulus). The waveform was analyzed at the stimulation frequency and compared to the average of two adjacent frequency bands that did not contain any visual evoked activity. The adjacent frequency measurements were used to estimate the noise background during the trial and reject portions of the record with muscle spikes or movement artifacts. Acuity was determined by linear extrapolation of the final portion of the VEP amplitude to zero microvolts. The extrapolation technique took into account the signal-to-noise ratio and phase statistics15,30,31. Each threshold was determined by a threshold average of 5 or more trials.
Behavioral Technique
Forced Choice Preferential Looking (PL) Test
The Berkeley Grating Cards38, a clinical variation of the Teller Acuity Card procedure39–41 was used to measure PL visual acuity. The acuity cards were presented either horizontally or vertically to minimize the effects of visual field defects and either lateral to or central to the gaze direction to minimize the effects of oculomotor abnormalities. The examiner presented the acuity cards in sequential order from lower to higher spatial frequencies. Each card was presented as many times as necessary to decide whether the patient could resolve the grating on the card.
It has been reported that behavioral grating acuity develops rapidly from birth to 6 months and then at a much slower rate up to adult acuity at 3 to 5 years of age40,41. However, more recent studies indicate a need for redefinition of normative PL grating acuity values42,43. A review of the PL normative data suggests a visual acuity range of 18.6–28.3 c/deg at 3 years of age42,43. However, to date, detailed normative data is not available after 3 years of age. Because the median age of the patients in this study was 13.8, all of the patients were older than 3 years of age, and only three patients were under the age of 5, the patients’ behavioral grating acuity was compared to the normal adult-like behavioral grating acuity value expected with this technique (30 c/deg).
Data Analysis
Vernier acuity and grating acuity have different units of measure (min arc and c/deg, respectively) and have different normative values. In order to compare the acuity values, the measures were expressed as the log deficit (with normal being 0.5 arc min and 30 c/deg, respectively). Thus, a grating acuity value of 15 c/deg would be a deficit of 0.3 log units. Likewise, a vernier acuity measure of 2.0 min arc would be a deficit of 0.6 log units. All analyses were conducted using log transformed acuity scores because the patients had a wide range of visual acuity ability and by scaling visual acuity on a log scale, the effect of measurement noise is independent of the acuity value44.
The measures of visual acuity were first compared using a correlation and regression analysis. Because high correlation does not automatically imply that there is good agreement between the two methods across their range of values, graphical analysis with a Bland-Altman plot was also used. In the Bland-Altman plot, for each subject, the difference between the two measurements (the y-axis) is plotted as a function of the average of the two measurements (the x-axis). The resulting plot allows a visual estimation of any systematic error or bias. If the two measures are in agreement then the points should fall along the horizontal “0” line, meaning that there is no difference between the two measures across the range of outcomes. If the points consistently fall above or below the horizontal zero line, it indicates that one method consistently found a higher or lower outcome. Furthermore, if there is a difference in the pattern of data points across the x-axis, it indicates that the two methods perform differently depending on the outcome value.
RESULTS
Measures of VEP vernier visual acuity and VEP grating visual acuity were obtained in all 37 patients, while behavioral (PL) visual acuity was obtained in 29 of the patients. Data from the 29 patients from whom all three measures were obtained were analyzed; data from the eight patients whose PL visual acuity could not be assessed were excluded. The excluded patients were the most difficult to test behaviorally and may have had more significant cognitive delay. However, they did not have the lowest VEP visual acuities and they were not younger than the patients who were tested behaviorally. The mean grating acuity for the eight excluded patients was 8.3 c/deg (SD: 6.7; range: 2.4–19.5) and mean vernier acuity was 4.6 min arc (SD: 2.7; range: 1.05–8.9). The mean age for the eight excluded patients was 11.3 years (SD: 9.5; median: 7.33; range: 3.5 to 31.5).
On average, patients had the best visual acuity when measured with the VEP grating stimulus. The average VEP grating acuity was 12.7 c/deg (SD: 4.9; median: 11.2), a deficit of 0.4 log units. The range of VEP grating acuity was from near normal (22.8 c/deg) to a deficit of nearly 0.8 log units (5.2 c/deg).
The average VEP vernier acuity was 2.7 min arc (SD: 2.4; median: 1.9), a deficit of 0.6 log units. The VEP vernier acuity range was from normal (0.5 min arc) to a deficit of nearly 1.4 log units (11.3 min arc).
The behavioral measure of acuity showed the greatest deficit with the largest range. The average behavioral acuity was 9.3 c/deg (SD: 8.3; median: 5.5), a deficit of 0.7 log units. The range of behavioral acuity was from normal (30 c/deg) to a deficit of nearly 1.6 log units (0.83 c/deg).
Comparison of VEP Grating Visual Acuity and VEP Vernier Visual Acuity
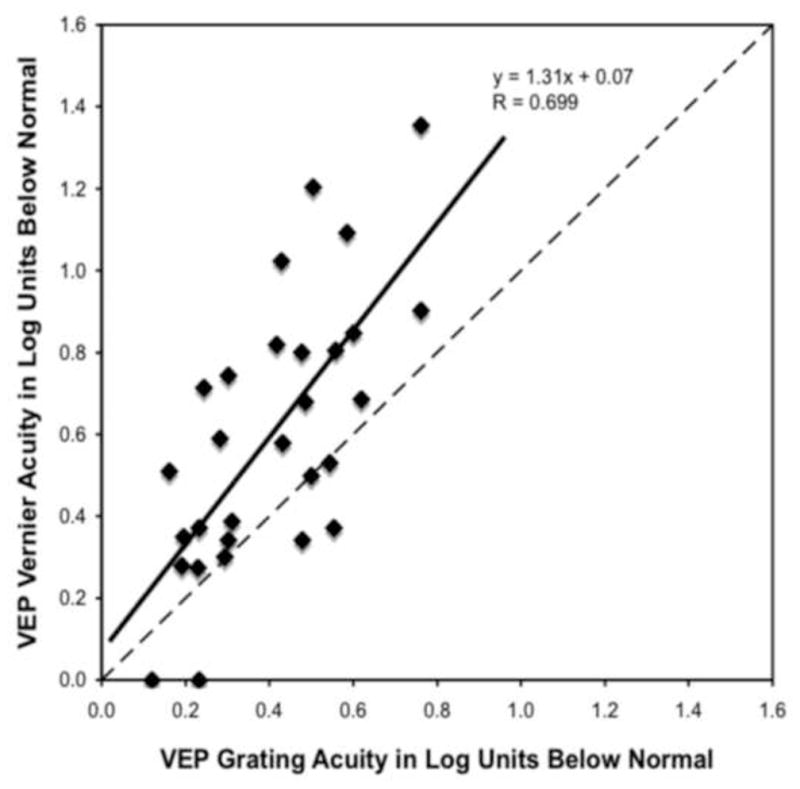
In Figure 1, the log reduction in VEP vernier acuity is plotted against the log reduction in VEP grating acuity. The log reduction in VEP grating acuity and the log reduction in VEP vernier acuity were significantly related (r=0.70; p<0.001). However, the slope was 1.31, indicating that on average, vernier acuity showed a 0.2 log unit deficit compared to VEP grating acuity. Vernier acuity was more reduced than grating acuity in all but six of the patients tested.
Figure 1.
VEP vernier acuity loss (in log units) is plotted as a function of VEP grating acuity loss (in log units). 0 is normal visual acuity and the reduction from normal increases from left to right on the x-axis and from bottom to top on the y-axis. The solid line represents the linear regression line fit to the data and the dashed line represents the 1:1 line. Data points representing patients who had the same reduction of acuity with both measures fall along the dashed 1:1 line. Data points from patients who had better VEP grating acuity than VEP vernier acuity fall above the dashed 1:1 line.
Comparison of VEP Grating Visual Acuity and Behavioral Grating Visual Acuity
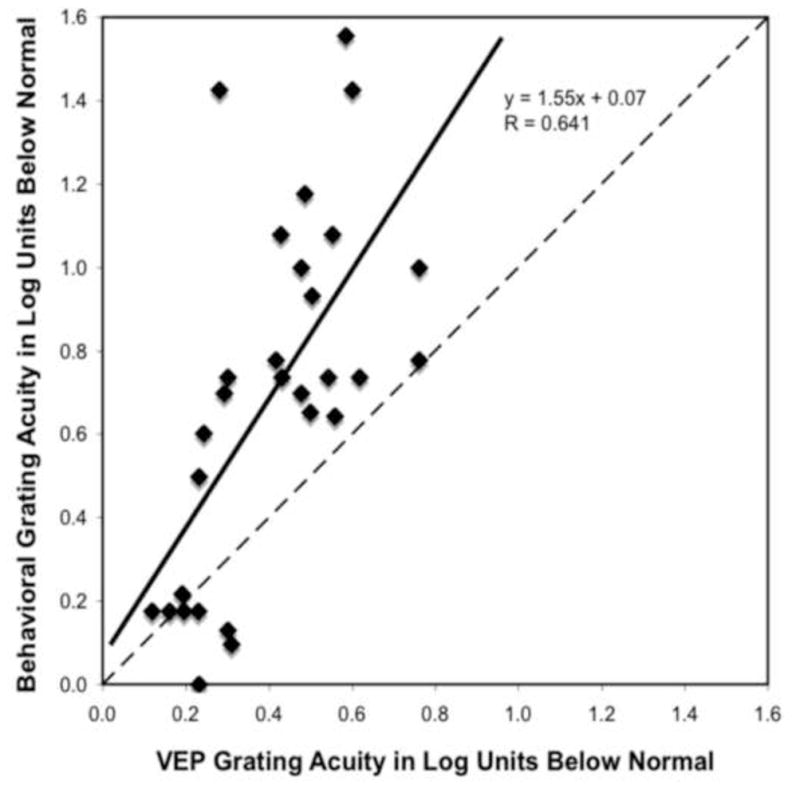
In Figure 2, the log reduction in VEP grating acuity is plotted against the log reduction in behavioral grating acuity. The log reduction in VEP grating acuity and the log reduction in behavioral grating acuity were significantly related (r=0.64; p<0.001). The slope was 1.55, indicating that on average behavioral acuity was more reduced (approximately a 0.3 log unit greater deficit) than the VEP grating acuity. Behavioral acuity was more reduced than VEP grating acuity in all but five of the patients tested.
Figure 2.
Behavioral grating acuity loss (in log units) is plotted as a function of VEP grating acuity loss (in log units). See Figure 1 legend for details.
Comparison of VEP Vernier Visual Acuity and Behavioral Grating Visual Acuity
In Figure 3, the log reduction in VEP vernier acuity is plotted against the log reduction in behavioral grating acuity. The log reduction in VEP vernier acuity and the log reduction in behavioral grating acuity were significantly related (r=0.66; p<0.001). The slope relating log VEP vernier loss to log behavioral acuity loss was 0.85; thus, the regression line aligned closer to the 1:1 line than for the previous two comparisons. This indicates that behavioral acuity and VEP vernier acuity showed approximately the same amount of reduction. Behavioral acuity was more reduced than vernier acuity in fifteen of the patients tested. Vernier acuity was more reduced than behavioral acuity in eleven of patients tested. There was a lot of variability, but there was not a clear bias of one method consistently reporting a higher acuity than the other.
Figure 3.
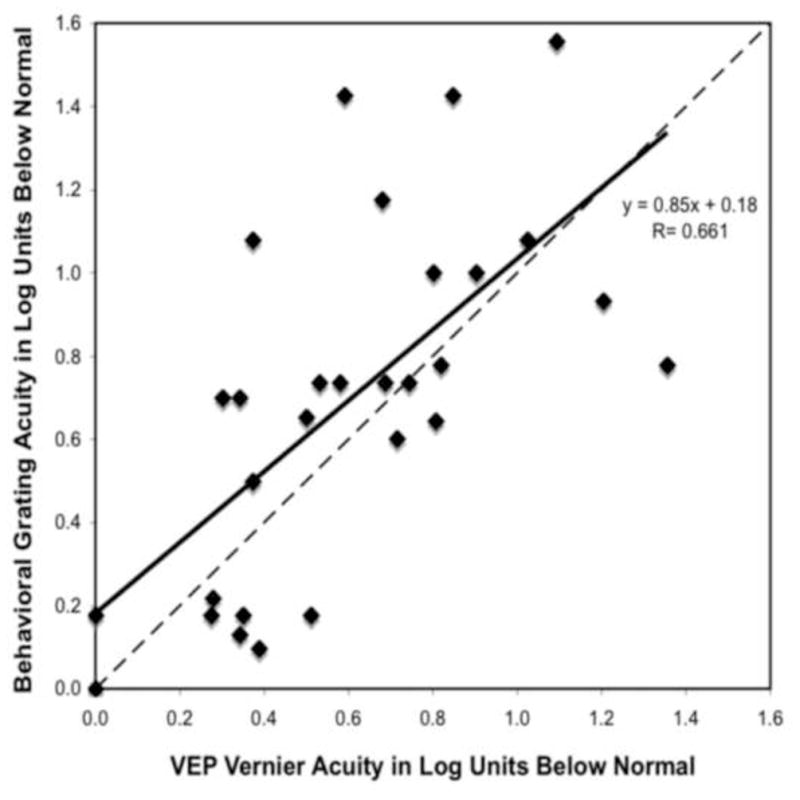
Behavioral grating acuity loss (in log units) is plotted as a function of VEP vernier acuity loss (in log units). See Figure 1 legend for details.
Bland-Altman Comparison of VEP Grating Acuity and Behavioral Grating Acuity Loss
Figure 4 is a Bland-Altman plot that shows a linear relationship with a steep slope (slope=0.97; r=0.8; p<0.001) between the loss of visual acuity seen with the VEP grating measure and the loss of visual acuity seen with the behavioral grating measure. The majority of the points are above the zero difference horizontal line, indicating that it was more common for a patient’s behavioral grating acuity to be worse than their VEP grating acuity. Furthermore, the steep positive slope indicates that the discrepancy between the two measures increased as the average acuity worsened. In other words, when the patient’s acuity was better, there was better agreement between the two measures. As the patient’s acuity worsened, the VEP grating acuity method indicated a better acuity than the behavioral grating acuity method.
Figure 4.
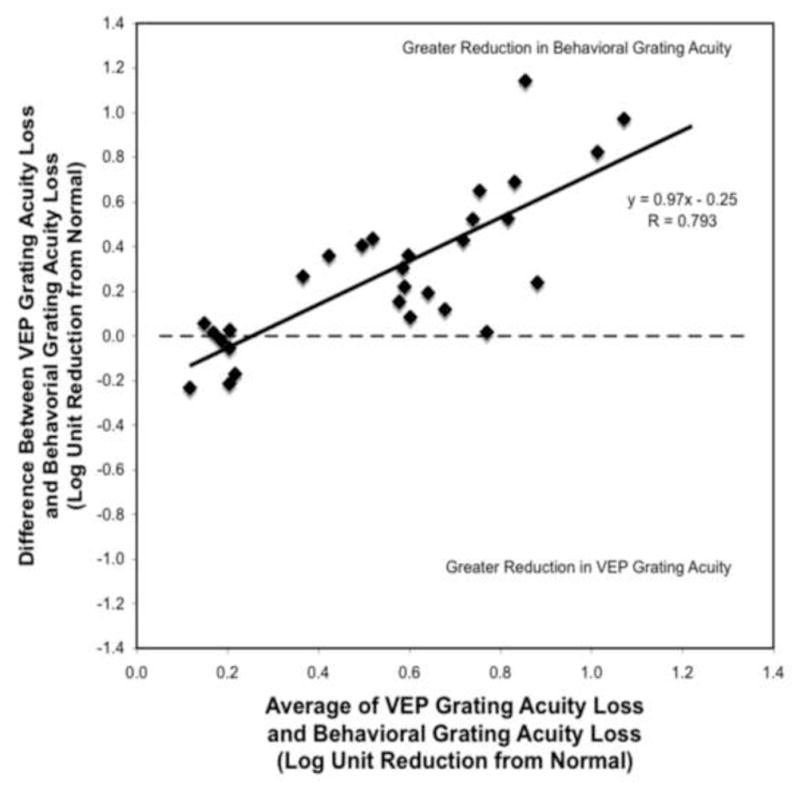
The difference between VEP grating acuity loss and behavioral grating acuity loss (y-axis) is plotted as a function of the average acuity loss reported by the two measures (x-axis). Positive y-axis values indicate that the behavioral grating acuity loss was greater than the VEP grating acuity loss. Negative y-axis values indicate that the VEP grating acuity loss was greater than the behavioral grating acuity loss. The horizontal dashed line represents the zero difference line. A point that falls along this line indicates that the reduction in both measures of acuity is the same for that patient. The solid line represents the linear regression line fit to the data.
Bland-Altman Comparison of VEP Vernier Acuity and Behavioral Grating Acuity Loss
Figure 5 is a Bland-Altman comparison between the loss of visual acuity seen with the VEP vernier acuity measure and the loss of visual acuity seen with the behavioral grating acuity. The slope is flatter and closer to the zero horizontal line (slope=0.30; r=0.32; p=0.09) indicating that there was not as much systematic error dependent on the acuity of the patient as was found with the VEP grating acuity comparison (Figure 4). Therefore, the vernier VEP measure and the behavioral grating measure produce similar estimates of visual acuity across the range of acuity levels. The greater equality of the number of points above and below the zero line indicates that there is not a consistent bias such that one method produces consistently better or worse outcomes than the other.
Figure 5.
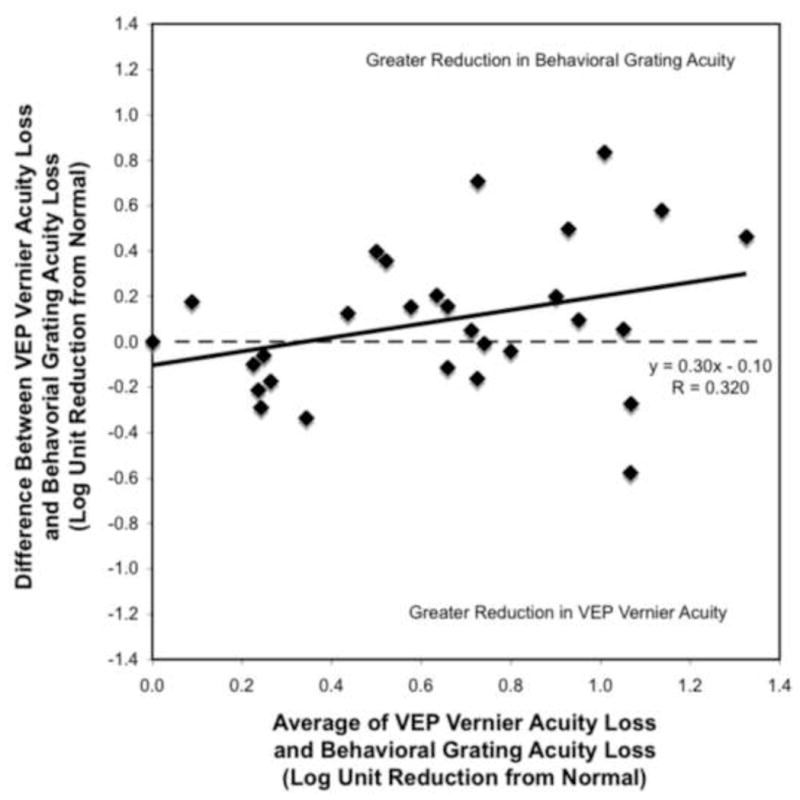
The difference between VEP vernier acuity loss and behavioral grating acuity loss (y-axis) is plotted as a function of the average acuity loss reported by the two measures (x-axis). See Figure 4 legend for details.
CONCLUSIONS
Assessing visual acuity in patients with CVI can be very challenging, and few quantitative methods for evaluating visual acuity are available. Because the severity of visual acuity loss in patients with CVI can range from a mild deficit to severe loss37, a quantitative measure of visual acuity is important for patients with CVI. Furthermore, a quantitative measure is necessary to define and monitor current and future rehabilitation strategies for these patients.
Previous work by Skoczenski and Good19 showed that VEP vernier acuity was more diminished than VEP grating acuity in children with CVI. Our results support this finding. On average, vernier acuity showed a 0.2 log unit greater deficit than grating acuity. Furthermore, vernier acuity was more reduced than grating acuity in almost all of the patients tested.
Also, as expected, the VEP grating acuity measure showed a smaller deficit in visual acuity than the behavioral grating acuity measure. On average, the behavioral acuity measure indicated a 0.3 log unit greater deficit than the VEP grating acuity measure. Furthermore, the discrepancy between the two measures was greatest for patients with worse acuity. The well-documented discrepancies between VEP and PL normative grating acuity data have been attributed to differences in retinal area that mediate the response, differences in the temporal properties of the test stimuli, and the demand of generating a motor response for PL testing10–13.
The novel contribution of this study is that in patients with CVI, VEP vernier acuity showed greater deficits than VEP grating acuity and was more similar to the deficits in behavioral grating acuity. VEP vernier acuity and behavioral grating acuity showed approximately the same amount of reduction in acuity across the range of acuity levels. The vernier VEP measure and its agreement with behavioral grating measures of visual acuity suggests that it is valuable in determining the appropriate size for visual material for patients with CVI.
The finding that VEP vernier acuity showed approximately the same amount of reduction as behavioral acuity in patients with CVI was surprising. Previous work has shown that vernier acuity correlates more precisely with optotype acuity than does grating acuity in patients with amblyopia35. Also, grating acuity is typically better than optotype acuity for children with vision impairment9,18,21. Therefore, it was expected that behavioral grating acuity would show less loss than vernier acuity (or any measure of visual acuity that correlated well with optotype acuity). One possible explanation for our finding is the difference in testing modalities (psychophysical vs. electrophysiological).
Grating acuity was measured behaviorally and vernier acuity was measured with the sweep VEP. The forced-choice preferential looking (PL) test is a psychophysical measure of acuity and is dependent on the child’s attention and motor ability. It has been suggested that inattention, fatigue, reduced motor ability, and visual field defects can all exaggerate the visual acuity loss reported with a PL test5,13,14. In contrast, the sweep VEP is an electrophysiological technique that does not require the generation of a motor response to communicate the presence of the stimuli. Furthermore, the VEP is not as affected by potential mid-peripheral visual field defects. These are all possible reasons that the sweep VEP can result in a higher visual acuity estimate than preferential looking, especially in patients with multiple disabilities12,16.
One concern with the resulting relationship between vernier VEP acuity and behavioral acuity is the high variability between the acuity measures, specifically for poorer acuities. For example, looking at patients whose average VEP vernier and behavioral grating loss is 1 log unit or more (in Figure 5), some patients have a vernier acuity that is approximately 0.6 log units better than their behavioral acuity, but for others the reverse is true. Further investigation with additional patients needs to be done to better understand the sources of these differences in sign and determine if different study parameters would reduce this type of variability for poorer acuities.
The results reported in this study may not be specific to patients with CVI. Rather, the results may be a more general consequence of visual impairment. However, based on previous research suggesting that vernier acuity, like optotype acuity, is preferentially diminished in neurological conditions such as amblyopia31, evaluating vernier acuity in the CVI population was of interest. It would be interesting to determine if the results reported in this study hold for children with coexisting ocular conditions.
The patients in this study likely represent more severe cases of global neurological abnormality seen within the CVI population. In this study, 72% of patients had a seizure disorder, 76% had cerebral palsy and 69% had paralysis requiring the use of a wheelchair. Whereas, within the entire population of patients with CVI, only approximately 50% have a seizure disorder, approximately 25% have cerebral palsy and only approximately 10% have hemiparesis7,8. The patients in this study were referred for a functional vision assessment by a pediatric ophthalmologist and/or an educational professional. In almost all cases, a quantitative evaluation of their visual acuity was not possible at a typical eye exam. A comparison between VEP vernier acuity and behavioral optotype acuity would be ideal. However, obtaining an accurate optotype acuity for patients with moderate to severe CVI is not a realistic expectation.
This study has shown that the visual acuity loss with vernier VEP testing is greater than that of the grating VEP test, and that the vernier VEP measure is in better agreement with a behavioral measure of visual acuity in patients with CVI. We expect that if it were possible to measure optotype acuity in this patient population, it would show even greater loss than what was found with the behavioral grating cards or the VEP vernier test. However, it is helpful to know that for patients who cannot perform any behavioral test, VEP vernier acuity is similar to a behavioral measure of visual acuity. The VEP vernier measure of acuity may be more accurate than the traditional grating VEP measure at quantifying the functional visual impairment in patients with CVI.
References
- 1.Good WV, Jan JE, DeSa L, Barkovich AJ, Groenveld M, Hoyt CS. Cortical visual impairment in children. Surv Ophthalmol. 1994;38:351–64. doi: 10.1016/0039-6257(94)90073-6. [DOI] [PubMed] [Google Scholar]
- 2.Hoyt CS. Visual function in the brain-damaged child. Eye. 2003;17:369–84. doi: 10.1038/sj.eye.6700364. [DOI] [PubMed] [Google Scholar]
- 3.Good WV, Jan JE, Burden SK, Skoczenski A, Candy R. Recent advances in cortical visual impairment. Dev Med Child Neurol. 2001;43:56–60. doi: 10.1017/s0012162201000093. [DOI] [PubMed] [Google Scholar]
- 4.Afshari MA, Afshari NA, Fulton AB. Cortical visual impairment in infants and children. Int Ophthalmol Clin. 2001;41:159–69. doi: 10.1097/00004397-200101000-00015. [DOI] [PubMed] [Google Scholar]
- 5.Fazzi E, Signorini SG, Bova SM, La Piana R, Ondei P, Bertone C, Misefari W, Bianchi PE. Spectrum of visual disorders in children with cerebral visual impairment. J Child Neurol. 2007;22:294–301. doi: 10.1177/08830738070220030801. [DOI] [PubMed] [Google Scholar]
- 6.Whiting S, Jan JE, Wong PK, Flodmark O, Farrell K, McCormick AQ. Permanent cortical visual impairment in children. Dev Med Child Neurol. 1985;27:730–9. doi: 10.1111/j.1469-8749.1985.tb03796.x. [DOI] [PubMed] [Google Scholar]
- 7.Huo R, Burden SK, Hoyt CS, Good WV. Chronic cortical visual impairment in children: aetiology, prognosis, and associated neurological deficits. Br J Ophthalmol. 1999;83:670–5. doi: 10.1136/bjo.83.6.670. [DOI] [PMC free article] [PubMed] [Google Scholar]
- 8.Khetpal V, Donahue SP. Cortical visual impairment: etiology, associated findings, and prognosis in a tertiary care setting. J Aapos. 2007;11:235–9. doi: 10.1016/j.jaapos.2007.01.122. [DOI] [PubMed] [Google Scholar]
- 9.Good WV. Development of a quantitative method to measure vision in children with chronic cortical visual impairment. Trans Am Ophthalmol Soc. 2001;99:253–69. [PMC free article] [PubMed] [Google Scholar]
- 10.Katsumi O, Denno S, Arai M, De Lopes Faria J, Hirose T. Comparison of preferential looking acuity and pattern reversal visual evoked response acuity in pediatric patients. Graefes Arch Clin Exp Ophthalmol. 1997;235:684–90. doi: 10.1007/BF01880666. [DOI] [PubMed] [Google Scholar]
- 11.Orel-Bixler D, Haegerstrom-Portnoy G, Hall A. Visual assessment of the multiply handicapped patient. Optom Vis Sci. 1989;66:530–6. doi: 10.1097/00006324-198908000-00007. [DOI] [PubMed] [Google Scholar]
- 12.Bane MC, Birch EE. VEP acuity, FPL acuity, and visual behavior of visually impaired children. J Pediatr Ophthalmol Strabismus. 1992;29:202–9. doi: 10.3928/0191-3913-19920701-04. [DOI] [PubMed] [Google Scholar]
- 13.Birch EE, Bane MC. Forced-choice preferential looking acuity of children with cortical visual impairment. Dev Med Child Neurol. 1991;33:722–9. doi: 10.1111/j.1469-8749.1991.tb14951.x. [DOI] [PubMed] [Google Scholar]
- 14.Dutton GN, Jacobson LK. Cerebral visual impairment in children. Semin Neonatol. 2001;6:477–85. doi: 10.1053/siny.2001.0078. [DOI] [PubMed] [Google Scholar]
- 15.Norcia AM, Tyler CW. Infant VEP acuity measurements: analysis of individual differences and measurement error. Electroencephalogr Clin Neurophysiol. 1985;61:359–69. doi: 10.1016/0013-4694(85)91026-0. [DOI] [PubMed] [Google Scholar]
- 16.Fulton A, Hansen R, Moskowitz A. Assessment of vision in infants and young children. In: Celesia GC, editor. Handbook of Clinical Neurophysiology: Disorders of Visual Processing. Amsterdam: Elsevier; 2005. pp. 203–30. [Google Scholar]
- 17.Lim M, Soul JS, Hansen RM, Mayer DL, Moskowitz A, Fulton AB. Development of visual acuity in children with cerebral visual impairment. Arch Ophthalmol. 2005;123:1215–20. doi: 10.1001/archopht.123.9.1215. [DOI] [PubMed] [Google Scholar]
- 18.Dobson V, Quinn GE, Siatkowski RM, Baker JD, Hardy RJ, Reynolds JD, Trese MT, Tung B. Agreement between grating acuity at age 1 year and Snellen acuity at age 5.5 years in the preterm child. Invest Ophthalmol Vis Sci. 1999;40:496–503. [PubMed] [Google Scholar]
- 19.Skoczenski AM, Good WV. Vernier acuity is selectively affected in infants and children with cortical visual impairment. Dev Med Child Neurol. 2004;46:526–32. doi: 10.1017/s001216220400088x. [DOI] [PubMed] [Google Scholar]
- 20.Stiers P, Vanderkelen R, Vandenbussche E. Optotype and grating visual acuity in preschool children. Invest Ophthalmol Vis Sci. 2003;44:4123–30. doi: 10.1167/iovs.02-0739. [DOI] [PubMed] [Google Scholar]
- 21.Stiers P, Vanderkelen R, Vandenbussche E. Optotype and grating visual acuity in patients with ocular and cerebral visual impairment. Invest Ophthalmol Vis Sci. 2004;45:4333–9. doi: 10.1167/iovs.03-0822. [DOI] [PubMed] [Google Scholar]
- 22.Arai M, Katsumi O, Paranhos FR, Lopes De Faria JM, Hirose T. Comparison of Snellen acuity and objective assessment using the spatial frequency sweep PVER. Graefes Arch Clin Exp Ophthalmol. 1997;235:442–7. doi: 10.1007/BF00947064. [DOI] [PubMed] [Google Scholar]
- 23.Mayer DL, Fulton AB, Rodier D. Grating and recognition acuities of pediatric patients. Ophthalmology. 1984;91:947–53. doi: 10.1016/s0161-6420(84)34209-9. [DOI] [PubMed] [Google Scholar]
- 24.Moseley MJ, Fielder AR, Thompson JR, Minshull C, Price D. Grating and recognition acuities of young amblyopes. Br J Ophthalmol. 1988;72:50–4. doi: 10.1136/bjo.72.1.50. [DOI] [PMC free article] [PubMed] [Google Scholar]
- 25.Skalka HW. Comparison of Snellen acuity, VER acuity, and Arden grating scores in macular and optic nerve diseases. Br J Ophthalmol. 1980;64:24–9. doi: 10.1136/bjo.64.1.24. [DOI] [PMC free article] [PubMed] [Google Scholar]
- 26.Sanders EA, Volkers AC, van der Poel JC, van Lith GH. Visual function and pattern visual evoked response in optic neuritis. Br J Ophthalmol. 1987;71:602–8. doi: 10.1136/bjo.71.8.602. [DOI] [PMC free article] [PubMed] [Google Scholar]
- 27.Weller RE, Kaas JH. Parameters affecting the loss of ganglion cells of the retina following ablations of striate cortex in primates. Vis Neurosci. 1989;3:327–49. doi: 10.1017/s0952523800005514. [DOI] [PubMed] [Google Scholar]
- 28.van Hof-van Duin J, Cioni G, Bertuccelli B, Fazzi B, Romano C, Boldrini A. Visual outcome at 5 years of newborn infants at risk of cerebral visual impairment. Dev Med Child Neurol. 1998;40:302–9. doi: 10.1111/j.1469-8749.1998.tb15381.x. [DOI] [PubMed] [Google Scholar]
- 29.Westheimer G. Editorial: Visual acuity and hyperacuity. Invest Ophthalmol. 1975;14:570–2. [PubMed] [Google Scholar]
- 30.Skoczenski AM, Norcia AM. Development of VEP Vernier acuity and grating acuity in human infants. Invest Ophthalmol Vis Sci. 1999;40:2411–7. [PubMed] [Google Scholar]
- 31.Hou C, Good WV, Norcia AM. Validation study of VEP vernier acuity in normal-vision and amblyopic adults. Invest Ophthalmol Vis Sci. 2007;48:4070–8. doi: 10.1167/iovs.06-1368. [DOI] [PubMed] [Google Scholar]
- 32.Zanker J, Mohn G, Weber U, Zeitler-Driess K, Fahle M. The development of vernier acuity in human infants. Vision Res. 1992;32:1557–64. doi: 10.1016/0042-6989(92)90211-z. [DOI] [PubMed] [Google Scholar]
- 33.Carkeet A, Levi DM, Manny RE. Development of Vernier acuity in childhood. Optom Vis Sci. 1997;74:741–50. doi: 10.1097/00006324-199709000-00022. [DOI] [PubMed] [Google Scholar]
- 34.Levi DM, Klein S. Hyperacuity and amblyopia. Nature. 1982;298:268–70. doi: 10.1038/298268a0. [DOI] [PubMed] [Google Scholar]
- 35.McKee SP, Levi DM, Movshon JA. The pattern of visual deficits in amblyopia. J Vis. 2003;3:380–405. doi: 10.1167/3.5.5. [DOI] [PubMed] [Google Scholar]
- 36.Allen D, Tyler CW, Norcia AM. Development of grating acuity and contrast sensitivity in the central and peripheral visual field of the human infant. Vision Res. 1996;36:1945–53. doi: 10.1016/0042-6989(95)00257-x. [DOI] [PubMed] [Google Scholar]
- 37.Watson T, Orel-Bixler D, Haegerstrom-Portnoy G. Longitudinal quantitative assessment of vision function in children with cortical visual impairment. Optom Vis Sci. 2007;84:471–80. doi: 10.1097/OPX.0b013e31806dba5f. [DOI] [PubMed] [Google Scholar]
- 38.Haegerstrom-Portnoy G, Schneck ME, Lott LA, Brabyn JA. The relation between visual acuity and other spatial vision measures. Optom Vis Sci. 2000;77:653–62. doi: 10.1097/00006324-200012000-00012. [DOI] [PubMed] [Google Scholar]
- 39.Trueb L, Evans J, Hammel A, Bartholemew P, Dobson V. Assessing visual acuity of visually impaired children using the Teller acuity card procedure. Am Orthopt J. 1992;42:149–54. [Google Scholar]
- 40.Teller DY, McDonald MA, Preston K, Sebris SL, Dobson V. Assessment of visual acuity in infants and children: the acuity card procedure. Dev Med Child Neurol. 1986;28:779–89. doi: 10.1111/j.1469-8749.1986.tb03932.x. [DOI] [PubMed] [Google Scholar]
- 41.Mayer DL, Dobson V. Assessment of vision in young children: a new operant approach yields estimates of acuity. Invest Ophthalmol Vis Sci. 1980;19:566–70. [PubMed] [Google Scholar]
- 42.Courage ML, Adams RJ. Visual acuity assessment from birth to three years using the acuity card procedure: cross-sectional and longitudinal samples. Optom Vis Sci. 1990;67:713–8. doi: 10.1097/00006324-199009000-00011. [DOI] [PubMed] [Google Scholar]
- 43.Salomao SR, Ventura DF. Large sample population age norms for visual acuities obtained with Vistech-Teller Acuity Cards. Invest Ophthalmol Vis Sci. 1995;36:657–70. [PubMed] [Google Scholar]
- 44.Westheimer G. Scaling of visual acuity measurements. Arch Ophthalmol. 1979;97:327–30. doi: 10.1001/archopht.1979.01020010173020. [DOI] [PubMed] [Google Scholar]