Abstract
Purpose
To evaluate the utility of in vivo imaging of rabbit model of choroidal melanoma utilizing high-frequency contrast-enhanced ultrasound (HF-CE-US) with 2-or 3-dimensional modes, and to correlate the sonographic findings with histopathologic characteristics.
Methods
Five New Zealand white rabbits which were immunosuppressed with daily cyclosporin A were inoculated into their right eyes with aliquots of 1.5×10⁶ / 50 µL of 92.1 human uveal melanoma cells cultured in RPMI. At week 4, the tumor-bearing eyes were imaged using high-frequency ultrasound with microbubble contrast agent to determine the 2-dimensional tumor size and relative blood volume and by 3-dimensional mode to determine tumor volume. Histologic tumor burden was quantified in enucleated eyes by ImageJ software, and microvascular density (MVD) was determined by counting vascular channels in PAS without hematoxylin sections.
Results
Utilizing HF-CE-US, melanomas were visualized as relatively hyperechoic regions in the images. The correlation coefficients of sonographic size or volume compared with histologic area were 0.72 and 0.70, respectively. The sonographic tumor relative blood volume correlated with the histologic tumor vascularity (R2=0.92, P=0.04)
Conclusions
There is a positive correlation between in vivo sonographic tumor volume/size and histologic tumor size in our rabbit choroidal melanoma model. HF-CE-US corresponds to microvascular density and blood volume.
Primary uveal melanoma is the most common primary intraocular malignancy in adults; its mean age-adjusted incidence is 5.1 per million, which has remained stable from 1973–2008.[1] Largest tumor diameter, location of the tumor, and histologic cell type have been generally accepted as important prognostic factors for uveal melanoma.[2] Ultrasound has been a useful tool in making the diagnosis, determining the tumor size, and monitoring the treatment for uveal melanoma.[3]
Recent advances in ultrasound technology have provided new opportunities to study additional prognostic parameters. Tumor volume can be measured by a 3-dimensional scanning system[4] or calculated from tumor diameter and tumor height by utilizing mathematical formulas.[5] It has been suggested that tumor volume may be a prognostic factor of survival of patients with choroidal melanoma.[5] Mean vascular density (MVD) of the uveal melanoma has been found to be an additional prognostic feature[6] and ultrasound imaging with enhanced contrast agents may potentially be used to visualize the blood flow within the tumor. These ultrasound contrast agents are microbubbles which enhance the acoustic signal in the blood flow within tumors.[7] We have demonstrated the usefulness of high-frequency microbubble contrast-enhanced ultrasound imaging in a mouse ocular melanoma model. There was a positive correlation between the sonographic tumor measurement and the histologic tumor burden in that model.[8] The relative blood volume within the tumor significantly correlated with mean vascular density.[8]
In this study, we evaluated the usefulness of in vivo imaging in a rabbit model of choroidal melanoma[9] utilizing high-frequency contrast-enhanced ultrasound (HF-CE-US) with 2-or 3-dimensional modes, and correlated the sonographic findings with the histologic characteristics of the tumor.
Materials and Methods
Cell Cultures
Human uveal melanoma 92.1 cells (courtesy of Dr. Jerry Y. Niederkorn, University of Texas Southwestern Medical Center, Dallas, TX) were cultured at 37 °C in 5% CO2 in complete culture medium (RPMI-1640 with 10% fetal bovine serum, 1% L-glutamine, 1% sodium pyruvate, 1% MEM vitamin mixture, 1% nonessential amino acids, 1% HEPES, 1% antibiotic-antimycotic solution containing 100 U/mL penicillin G, 250 ng/mL amphotericin B, and 100 µg/mL streptomycin solution, and 2-mercaptoethanol).
Animals and Induction of Immunosuppression
All animal procedures were approved by Institutional Animal Care and Use Committee of Emory University and conformed to the Association for Research in Vision and Ophthalmolgy statement for the Use of Animals in Ophthalmic and Vision Research. Five male New Zealand albino rabbits with a mean initial weight approximately 3 kg were used in this study. The rabbits were immunosuppressed with daily intramuscular injections of cyclosporin A (CsA; Sandiummune 50 mg/mL; Novartis Pharmaceuticals, Cambridge, MA). CsA administration was maintained throughout the experiment to prevent spontaneous tumor regression. The dosage schedule was 15 mg/kg per day for 3 days before cell inoculation and daily for 4 weeks thereafter as previously described.[9] CsA doses were adjusted weekly according to each animal’s body weight. The animals were monitored daily for signs of CsA toxicity such as gingival hypertrophy, drooling, diarrhea, and weight loss. Animals were sacrificed and excluded from the study when weight loss exceeded 10% of the baseline body weight.
Cell Injection Procedure
At day 3, 1.5×10⁶ of 92.1 human uveal melanoma cells in RPMI (Cellgro, Manassa, VA) in a volume of 50 µl suspension were injected into the suprachoroidal space (SCS) of the rabbits with a hollow microneedle.[10] The microneedle is a 34 gauge, 7 mm needle with a shallow bevel (Clearside Biomedical, Alpharetta, GA). The procedure was performed under anesthesia after intramuscular injection of xylazine and ketamine. The right eye (study eye) of each rabbit was proptosed with a forceps, and a microneedle was inserted perpendicular to the superotemporal sclera 5–7 mm posterior from the limbus.[11] A 50 μl suspension of cells was inoculated into the suprachoroidal space through the microneedle. The needle was slowly retracted, ensuring that there was no reflux from the injection site. A drop of 0.3% gentamicin ophthalmic solution was then applied to the right eye.
High-Frequency, Contrast-Enhanced Ultrasound Imaging of the Rabbit Eyes and Image Analysis
On week 4 after the intraocular injection of the tumors, in vivo HF-CE-US imaging was performed with a high-resolution imaging system (Vevo 770; VisualSonics, Inc., Toronto, ON, Canada) with a 30-MHz transducer. The rabbits were anethesized with a mixture of xylazine and ketamine. Sterile ultrasound gel (Aquasonic 100; Parker Laboratories, Fairfield, NJ) was placed on the right eye. The probe (RMV 707B; VisualSonics, Inc.) attached to the 3D motor was adjusted until the tumor was visualized on the ultrasound monitor within the focal zone. The probe was immobilized to reduce any artifact in the images and to improve the intensity comparison and subtraction in a given slice. The parameters of the ultrasound system were optimized according to the manufacturer for animal use: 50% transmitted power, 52-dB dynamic range, and 17.00 × 17.00 mm field of view. Baseline images without contrast agent were recorded at the beginning. Next, the contrast agent (MicroMarker; VisualSonics, Inc.) was prepared for the contrast-enhanced imaging; it was reconstituted with sterile saline and gently agitated. A 400-µL bolus containing a final count of 1.0 × 10⁸ microbubbles was injected through the ear vein with a 25G needle, and a real-time contrast-mode imaging was immediately recorded. For the 3D imaging, the ultrasound probe connected to the 3D motor moved linearly across the rabbit’s eye. The 3D images were reconstructed from the multiple 2D images which were parallel and regularly spaced at 150-µm intervals during the entire recording. The 3D volumetric data were calculated from the image acquisition protocol with 3D image reconstruction and visualization software.The rabbits were euthanized with an overdose of pentobarbital at the end of the study, and the tumor-bearing right eyes were oriented, enucleated, and submitted for routine histology processing. The measurements of the tumor volume and of the relative blood volume were computed using the manufacturer’s software as described previously.[8]
Estimation of Tumor Area from Histologic Sections
All enucleated rabbit eyes were fixed in 10% formalin, and oriented in the same transaxial plane imaged by the ultrasound. The central section containing the tumor was obtained, embedded in paraffin, dehydrated in increasing concentrations of alcohol, and cleared in xylene. Serial 8-µm sections were prepared, and stained with hematoxylin-eosin. Ten sections with the largest tumor area in each eye were photographed at x20 magnification (DP 10; Olympus, Tokyo, Japan). The tumor size was measured with ImageJ software (developed by Wayne Rasband, National Institutes of Health, Bethesda, MD)
Measurement of Mean Microvascular Density from Histologic Sections
Three sections from each rabbit eye were stained with periodic acid Schiff (PAS) without hematoxylin, and evaluated by light microscopy with a green filter. The portion of tumor with the highest vascular density (“hot spot”) was examined using ×100 magnification, and the number of blood vessels in the field was counted. The average of three counts of each case was calculated to determine the mean microvascular density (MVD).[12]
Statistical Analysis
Two-tailed Student’s t-tests and standard linear regression analysis were used to compare data between histologic sections and HF-CE-US images. The level of statistical significance was set at P < 0.05, and the results are expressed as mean ± standard deviation.
Results
High-Frequency Contrast-Enhanced Ultrasound Imaging of Choroidal Melanoma in Rabbits
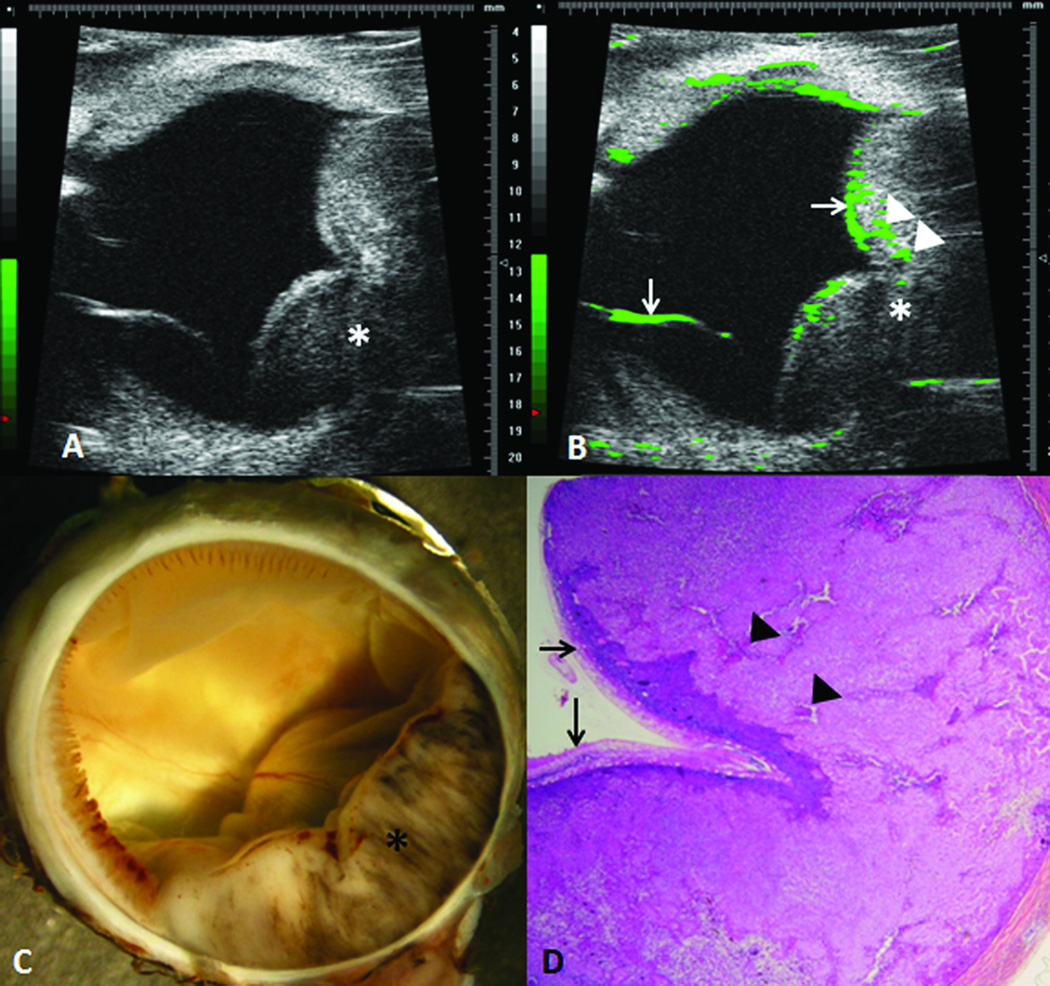
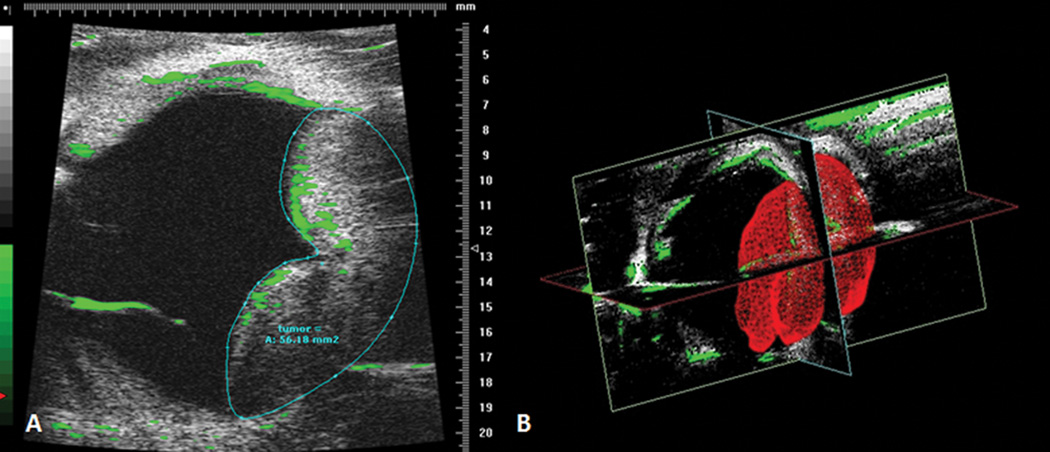
An example of ultrasound imaging of a uveal melanoma in the rabbit eye before and after contrast administration is shown in Figure 1. The tumor appeared as a relatively hyperechoic and heterogeneous region associated with a localized retinal detachment on the opposing side (Fig 1A). After the injection of microbubbles, the contrast-enhanced regions were highlighted with pseudocoloring in green (Fig 1B). The detached retina was highlighted with the microbubbles as well. The hyperechoic, enhanced area correlated with the gross findings and the histologic sections (Fig 1C and D). There was no histologic damage to intraocular structures observed. Three images with the largest tumor area were selected and the tumor area was measured.(Fig 2A) In the 3D mode, the tumor area was outlined from the temporal to the nasal section, and could be highlighted in red in the surface view (Fig 2B). The tumor volume was calculated from these measurements by utilizing manufacturer’s software, and was compared to the tumor area measured from the histological sections.
Figure 1.
Experimental choroidal melanoma in a rabbit. The intraocular tumor (*) is visualized with high-frequency ultrasound before (A) and after (B) contrast enhancement. The contrast enhanced regions are highlighted in green, including enhanced areas in the retina (arrows) and in the melanoma (arrowheads). The hyperechoic region in the ultrasound correlated with gross appearance of the melanoma (C) and the histologic findings (D). (D, hematoxylin and eosin, 25X)
Figure 2.
Ultrasound measurement of tumor area. An image corresponding with the largest tumor area is selected; the tumor area is then outlined and calculated with the manufacturer’s software (A). In the 3D mode, tumor is reconstructed and highlighted in red (B).
Tumor Size/Volume Measurements
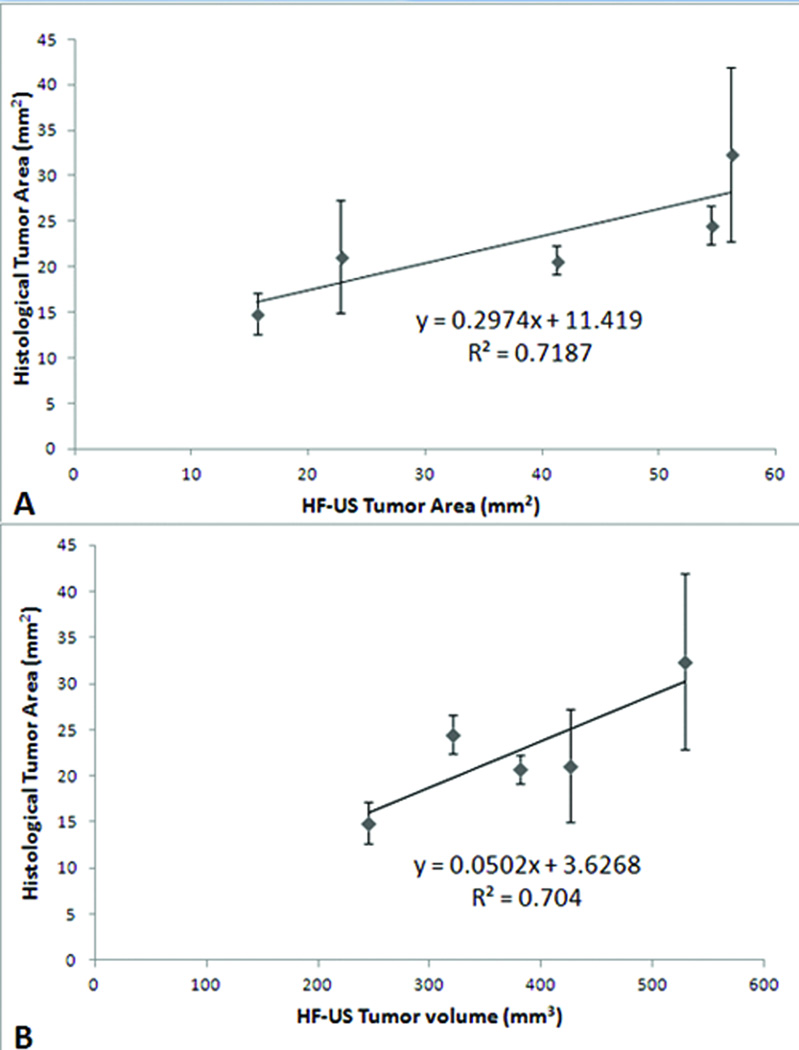
On the week 4, all tumors were visualized by the B-scans, and the largest tumor area was measured. The average size of tumor with 2D imaging was 38.04 ± 18.34 mm2 and the average tumor volume with 3D mode imaging was 380.27 ± 107.43 mm3. The average tumor area from the histologic measurements was 22.73 ± 6.43 mm2. Significant correlations were found between the histologic area measurements and sonographic 2D tumor area (Fig. 3A; R2 = 0.72; P=0.03) and 3D mode tumor volume (Fig. 3B; R2 = 0.70; P=0.001).
Figure 3.
Histologic tumor area correlates with sonographic tumor area and volume. There is a positive relationship between histologic and sonographic tumor area (A) as deterimined by the 2-dimensional mode (r2=0.718) and tumor volume (B) as determined by the 3-dimensional mode (bottom, r2=0.704).
Tumor Vasculature Measurements
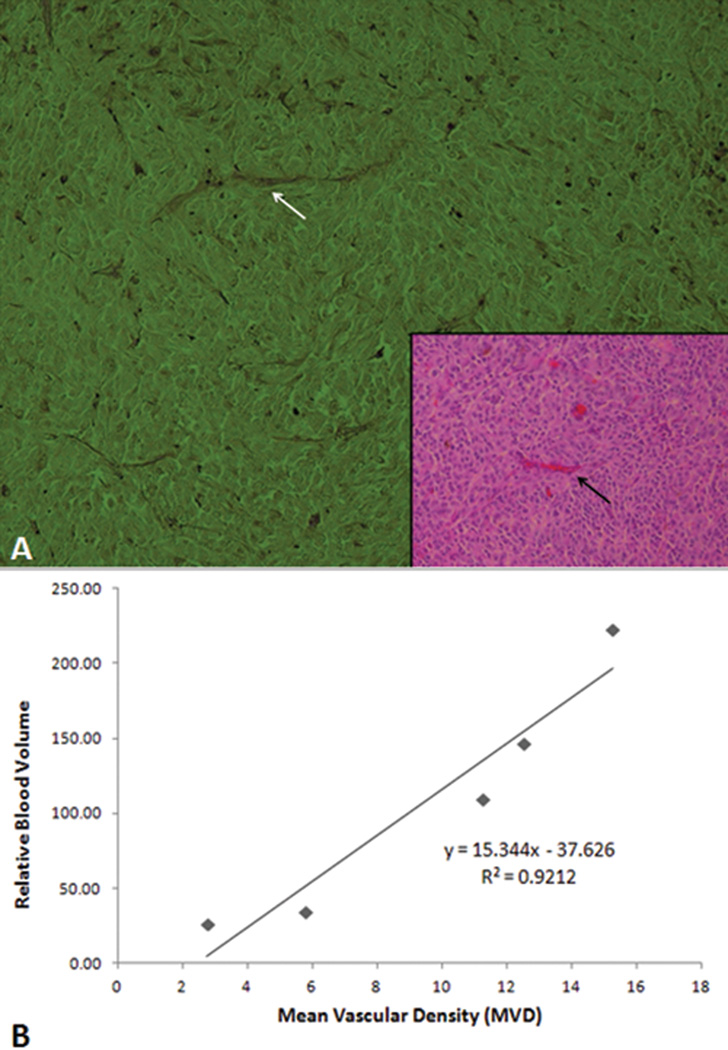
The relative blood volume of the tumor was calculated with the manufacturer’s software as previously described[29], and the average relative blood volume of the tumor was 108.14 ± 81.81. The microvascular density of the uveal melanoma was determined from the sections stained with PAS without hematoxylin, and the average value was 9.50 ± 5.12. (Fig 4A) There was a statistically significant correlation between the sonographic tumor relative blood volume and the histologic tumor vascularity (Fig 4B; R2=0.92, P=0.04)
Figure 4.
Tumor mean vascular density (MVD) correlates with sonographic tumor blood volume. (A) Histologic section of the melanoma stained with periodic acid-Schiff (PAS) without hematoxylin is used to determine mean vascular density. A blood vessel in the PAS stained section (white arrow) correlates with the section stained with hematoxylin and eosin (inset, black arrow). (PAS ×100; inset hematoxylin and eosin, 100×) (B) The relative blood volume obtained from the ultrasound correlates with the MVD measured from the histologic sections (R2=0.9212).
Discussion
Ultrasound has been a noninvasive and effective tool in the diagnosis of choroidalmelanoma, providing valuable information such as tumor diameter, tumor height, and location. Recent introduction of high-frequency ultrasound offers the advantage of rapid imaging speed, low cost, high resolution, and enables to measure the ocular structures with increased accuracy.[13] In our study, choroidal melanoma in the rabbit eye was visualized as a relatively hyperechoic region compared to the surrounding ocular structures. We used these high resolution images to measure the tumor area and volume.
Tumor volume can be either measured with 3-dimensional ultrasound, or calculated from the measurements obtained from 2-dimensional ultrasound[5] although the calculated volume differs according to the mathematical formula utilized.[14] Previous studies have demonstrated that 3D ultrasound measures the tumor volume measurements with high accuracy and reproducibility.[15,16] The sonographic tumor area and volume measured in our study significantly correlated withhistologic tumor area.
Microvascular density (MVD) has been suggested as an important prognostic factor for hepatic metastasis and survival in uveal melanoma.[6,17] The limitation of this information is that it is obtained from the histologic sections after enucleation. Functional assessment of vascularity is available with the use of color-coded doppler and power doppler imaging[18,19], although this is only a measure of macrovasculature and does not correlate with the extent of tumor angiogenesis in breast carcinoma.[18] The utility of color-coded doppler and power doppler imaging in uveal melanoma is under investigation. High frequency ultrasound imaging with enhanced contrast agents is a non-invasive means for in vivo analysis of blood flow in the brain, heart, liver, and kidneys.[13,20] Ultrasound contrast agents are microbubbles small enough to move freely through the bloodstream. The microbubbles remain confined to the vasculature before they cleared out, so they are ideal markers to visualize and analyze the regional microvascular blood flow of the tissue.[7] Previous studies have shown safety and improved diagnostic efficacy of contrast enhanced ultrasound imaging with microbubbles.[21] Hwang and co-workers demonstrated that the relative blood volume measured from contrast-enhanced ultrasonography strongly correlated with histologic MVD in subcutaneously implanted Lewis lung carcinoma[22], which is consistent with both our previous study of a murine model of uveal melanoma[8] and our current study of a rabbit model of choroidal melanoma. Thus, sonographic relative blood volume is potentially a new parameter for monitoring the biological behavior of uveal melanoma.
Since ultrasound imaging has been an important diagnostic tool, B-scan ultrasound for the eye is used with frequencies at or near 10 MHz, which provides good imaging of the vitreous, posterior globe, and the orbit. Instruments with higher frequencies (35–50 MHz) are now widely used for the imaging of the anterior segment of the eye.[23] A greater focal length is required to view the posterior pole, so higher frequency ultrasound has not been widely used for the posterior pole imaging. However, there are reports demonstrating the possible use of higher frequency ultrasound for the visualization of the posterior part of the eye. Coleman and co-workeres used 20-MHz ultrasound to visualize the retina, choroid and sclera, and showed that 20-MHz ultrasound provided a 2-fold improvement in resolution compared to the conventional 10-MHz instruments.[24] In our study, we used microbubbles as the ultrasound contrast agent and performed high frequency ultrasound imaging at 30 MHz to visualize the uveal melanoma in our rabbit model. The sonographic relative blood volume in the tumor significantly correlated the histologic tumor MVD (R2=0.92, P=0.04). Forte and co-workers were able to visualize vascularization in 25 cases choroidal melanoma using a microbubble contrast agent (Sonovue®) and a 3.5 MHz ultrasound instrument.[25] Compared to their study, our study provided images with better resolution due to a higher frequency transducer. Additionally, we found that the processed images with pseudo-coloring in green highlighted the vascularity in the tumor.
Limitations of our study include the small sample size and artifacts encountered during the imaging. False positive signal can arise from the movement of the eye during the imaging. This was minimized by maintaining adequate anesthesia of the rabbits during the procedure, although this may not be always possible in a clinical setting. A potential application of this study can be the high-resolution functional assessment of human uveal melanoma. The volumeof rabbit eyes is smaller than that of human eyes (approximately 0.7 times the volume); therefore, the higher frequency ultrasound of 30 MHz will likely not able to visualize the tumor in the posterior pole in human eyes. It may be possible to image intraocular tumors in the anterior segment and the choroid anterior to the equator. Further studies are required to apply this technique to uveal melanoma in human eyes.
In this study we documented a positive correlation between in vivo sonographic tumor volume/size and histologic tumor size in a rabbit choroidal melanoma model. We also showed the relationship between sonographic blood volume and histologic microvascular density. This technique is a real-time, non-invasive method for evaluation of experimental intraocular melanoma tumor area and relative blood volume. We have demonstrated the feasibility of imaging and measuring the tumor size/volume and the vascularity of experimental choroidal melanoma in the rabbits using contrast-enhanced high frequency ultrasound imaging. This technique is a safe, real-time, non-invasive, and reliable method for the assessment of the vascularity and blood volume in experimental chroidalmelanoma.
Acknowledgments
This work is supported in part by the National Institutes of Health grant numbers NIH NEI R24EY017045 and NEI P30 EY06360 and an unrestricted departmental grant from Research to Prevent Blindness, Inc.
Footnotes
The authors have no financial interests in any materials presented in this manuscript.
All authors contributed to conception and design, acquisition of data analasys and interpretation, drafting or revising the article, and final approval of the article.
References
- 1.Singh AD, Turrell ME, Topham A. Uveal melanoma: trends in incidence, treatment, and survival. Ophthalmology. 2011;118(9) doi: 10.1016/j.ophtha.2011.01.040. 1181-5.2. [DOI] [PubMed] [Google Scholar]
- 2.McLean IW, Foster WD, Zimmerman LE. Uveal melanoma: location, size, cell type, and enucleation as risk factors in metastasis. Hum Pathol. 1982;13(2):123–132. doi: 10.1016/s0046-8177(82)80116-0. [DOI] [PubMed] [Google Scholar]
- 3.Boldt HC, Byrne SF, Gilson MM, et al. Baseline echographic characteristics of tumors in eyes of patients enrolled in the Collaborative Ocular Melanoma Study: COMS report no. 29. Ophthalmology. 2008;115(8):1390–1397. 97 e1–97 e2. doi: 10.1016/j.ophtha.2007.12.015. [DOI] [PubMed] [Google Scholar]
- 4.Cusumano A, Coleman DJ, Silverman RH, et al. Three-dimensional ultrasound imaging: clinical applications. Ophthalmology. 1998;105(2):300–306. doi: 10.1016/s0161-6420(98)93211-0. [DOI] [PubMed] [Google Scholar]
- 5.Richtig E, Langmann G, Mullner K, et al. Calculated tumour volume as a prognostic parameter for survival in choroidal melanomas. Eye (Lond) 2004;18(6):619–623. doi: 10.1038/sj.eye.6700720. [DOI] [PubMed] [Google Scholar]
- 6.Foss AJ, Alexander RA, Jefferies LW, et al. Microvessel count predicts survival in uveal melanoma. Cancer Res. 1996;56(13):2900–2903. [PubMed] [Google Scholar]
- 7.Ferrara K, Pollard R, Borden M. Ultrasound microbubble contrast agents: fundamentals and application to gene and drug delivery. Annu Rev Biomed Eng. 2007;9:415–447. doi: 10.1146/annurev.bioeng.8.061505.095852. [DOI] [PubMed] [Google Scholar]
- 8.Zhang Q, Yang H, Kang SJ, et al. In vivo high-frequency, contrast-enhanced ultrasonography of uveal melanoma in mice: imaging features and histopathologic correlations. Invest Ophthalmol Vis Sci. 2011;52:2662–2668. doi: 10.1167/iovs.10-6794. [DOI] [PMC free article] [PubMed] [Google Scholar]
- 9.Blanco PL, Marshall JC, Antecka E, et al. Characterization of ocular and metastatic uveal melanoma in an animal model. Invest Ophthalmol Vis Sci. 2005;46(12):4376–4382. doi: 10.1167/iovs.04-1103. [DOI] [PubMed] [Google Scholar]
- 10.Patel SR, Lin AS, Edelhauser HF, et al. Suprachoroidal drug delivery to the back of the eye using hollow microneedles. Pharm Res. 2011;28(1):166–176. doi: 10.1007/s11095-010-0271-y. [DOI] [PMC free article] [PubMed] [Google Scholar]
- 11.Patel SR, Berezovsky DE, McCarey BE, et al. Targeted administration into the suprachoroidal space using a microneedle for drug delivery to the posterior segment of the eye. Invest Ophthalmol Vis Sci. 2012;53(8):4433–4441. doi: 10.1167/iovs.12-9872. [DOI] [PMC free article] [PubMed] [Google Scholar]
- 12.Grossniklaus HE. Tumor vascularity and hematogenous metastasis in experimental murine intraocular melanoma. Trans Am Ophthalmol Soc. 1998;96:721–752. [PMC free article] [PubMed] [Google Scholar]
- 13.Foster FS, Zhang MY, Zhou YQ, et al. A new ultrasound instrument for in vivo microimaging of mice. Ultrasound Med Biol. 2002;28(9):1165–1172. doi: 10.1016/s0301-5629(02)00567-7. [DOI] [PubMed] [Google Scholar]
- 14.Singh AD, Terman S, Sculley L. Estimating choroidal melanoma volume: comparison of methods. Ophthalmology. 2007;114(6):1212–1214. doi: 10.1016/j.ophtha.2006.08.056. [DOI] [PubMed] [Google Scholar]
- 15.Chang FM, Hsu KF, Ko HC, et al. Three-dimensional ultrasound assessment of fetal liver volume in normal pregnancy: a comparison of reproducibility with two-dimensional ultrasound and a search for a volume constant. Ultrasound Med Biol. 1997;23(3):381–389. doi: 10.1016/s0301-5629(96)00218-9. [DOI] [PubMed] [Google Scholar]
- 16.Gilja OH, Thune N, Matre K, et al. In vitro evaluation of three-dimensional ultrasonography in volume estimation of abdominal organs. Ultrasound Med Biol. 1994;20(2):157–165. doi: 10.1016/0301-5629(94)90080-9. [DOI] [PubMed] [Google Scholar]
- 17.Toivonen P, Makitie T, Kujala E, et al. Microcirculation and tumor-infiltrating macrophages in choroidal and ciliary body melanoma and corresponding metastases. Invest Ophthalmol Vis Sci. 2004;45(1):1–6. doi: 10.1167/iovs.03-0622. [DOI] [PubMed] [Google Scholar]
- 18.Peters-Engl C, Medl M, Mirau M, et al. Color-coded and spectral Doppler flow in breast carcinomas--relationship with the tumor microvasculature. Breast Cancer Res Treat. 1998;47(1):83–89. doi: 10.1023/a:1005992916193. [DOI] [PubMed] [Google Scholar]
- 19.Abdallah W, Fawzi A, Patel H, et al. Blood velocity measurement in the posterior segment of the rabbit eye using combined spectral Doppler and power Doppler ultrasound. Graefes Arch Clin Exp Ophthalmol. 2010;248(1):93–101. doi: 10.1007/s00417-009-1200-9. [DOI] [PMC free article] [PubMed] [Google Scholar]
- 20.Wang YX, Betton G, Floettmann E, et al. Imaging kidney in conscious rats with high-frequency ultrasound and detection of two cases of unilateral congenital hydronephrosis. Ultrasound Med Biol. 2007;33(3):483–486. doi: 10.1016/j.ultrasmedbio.2006.08.010. [DOI] [PubMed] [Google Scholar]
- 21.Moriyasu F, Itoh K. Efficacy of perflubutane microbubble-enhanced ultrasound in the characterization and detection of focal liver lesions: phase 3 multicenter clinical trial. AJR Am J Roentgenol. 2009;193(1):86–95. doi: 10.2214/AJR.08.1618. [DOI] [PubMed] [Google Scholar]
- 22.Hwang M, Hariri G, Lyshchik A, et al. Correlation of quantified contrast-enhanced sonography with in vivo tumor response. J Ultrasound Med. 2010;29(4):597–607. doi: 10.7863/jum.2010.29.4.597. [DOI] [PubMed] [Google Scholar]
- 23.Pavlin CJ, Harasiewicz K, Sherar MD, et al. Clinical use of ultrasound biomicroscopy. Ophthalmology. 1991;98(3):287–295. doi: 10.1016/s0161-6420(91)32298-x. [DOI] [PubMed] [Google Scholar]
- 24.Coleman DJ, Silverman RH, Chabi A, et al. High-resolution ultrasonic imaging of the posterior segment. Ophthalmology. 2004;111(7):1344–1351. doi: 10.1016/j.ophtha.2003.10.029. [DOI] [PubMed] [Google Scholar]
- 25.Forte R, Cennamo G, Staibano S, et al. Echographic examination with new generation contrast agent of choroidal malignant melanomas. Acta Ophthalmol Scand. 2005;83(3):347–354. doi: 10.1111/j.1600-0420.2005.00428.x. [DOI] [PubMed] [Google Scholar]


