

Abstract
Recent research suggests cell-to-cell transfer of pathogenic proteins such as tau and α-synuclein may play a role in neurodegeneration. Pathogenic spread along neural pathways may give rise to specific spatial patterns of the neuronal cytoplasmic inclusions (NCI) characteristic of these disorders. Hence, the spatial patterns of NCI were compared in four tauopathies, viz., Alzheimer’s disease, Pick’s disease, corticobasal degeneration, and progressive supranuclear palsy, two synucleinopathies, viz., dementia with Lewy bodies and multiple system atrophy, the ‘fused in sarcoma’ (FUS)-immunoreactive inclusions in neuronal intermediate filament inclusion disease, and the transactive response DNA-binding protein (TDP-43)-immunoreactive inclusions in frontotemporal lobar degeneration, a TDP-43 proteinopathy (FTLD-TDP). Regardless of molecular group or morphology, NCI were most frequently aggregated into clusters, the clusters being regularly distributed parallel to the pia mater. In a significant proportion of regions, the regularly distributed clusters were in the size range 400–800 μm, approximating to the dimension of cell columns associated with the cortico-cortical pathways. The data suggest that cortical NCI in different disorders exhibit a similar spatial pattern in the cortex consistent with pathogenic spread along anatomical pathways. Hence, treatments designed to protect the cortex from neurodegeneration may be applicable across several different disorders.
Keywords: Tauopathy, Synucleinopathy, FUS proteinopathy, TDP-43 proteinopathy, Spatial patterns, Neuronal cytoplasmic inclusions (NCI), Cell to cell transfer
Introduction
The formation of neuronal cytoplasmic inclusions (NCI), which vary in morphology and molecular composition, is a characteristic feature of many neurodegenerative disorders (Armstrong et al. 2008). These include neurofibrillary tangles (NFT) in Alzheimer’s disease (AD) (Armstrong 1993a) and progressive supranuclear palsy (PSP) (Armstrong et al. 2007), Pick bodies (PB) in Pick’s disease (PiD) (Armstrong et al. 1998), tau-immunoreactive neuronal inclusions in corticobasal degeneration (CBD) (Armstrong 2009a, b), Lewy bodies (LB) in dementia with Lewy bodies (DLB) (Armstrong et al. 1997), and NCI in multiple system atrophy (MSA) (Armstrong et al. 2006a), neuronal intermediate filament inclusion disease (NIFID) (Cairns et al. 2004a, b, c; Armstrong et al. 2006b), and frontotemporal lobar degeneration (FTLD) (Armstrong et al. 2010).
The majority of inclusions are characterised by either abnormal aggregates of the microtubule-associated protein (MAP) tau (tauopathies), e.g., AD, PiD, argyrophilic grain disease (AGD) (Saito et al. 2004), PSP, CBD, and frontotemporal dementia and parkinsonism linked to chromosome 17 (FTDP-17) (Reed et al. 2001), or α-synuclein (synucleinopathies), e.g., Parkinson’s disease (PD), DLB, and MSA (Goedert et al. 2001). Within the tauopathies, the molecular composition of tau varies, PiD being characterised by tau with three microtubule repeats (3R tau) while PSP and CBD are composed of four-repeat (4R) tau (Dickson 1999; Morris et al. 2002). In AD, NFT are characterised by both 3R and 4R tau and composition also varies markedly depending on whether NFT are intracellular (I-NFT) or extracellular (E-NFT) (Yamaguchi et al. 1991). In addition to tau and α-synuclein, other molecular pathologies have been recently identified. Hence, NCI in FTLD are characterised by transactive response (TAR) DNA-binding protein (TDP-43)-immunoreactive inclusions and therefore, FTLD is a TDP-43 proteinopathy (FTLD-TDP) (Neumann et al. 2006; Armstrong et al. 2010) while NCI in NIFID are characterised by ‘fused in sarcoma’ (FUS)-immunoreactivity (Yokota et al. 2008; Neumann et al. 2009; Armstrong et al. 2011a, b). NCI also exhibit different morphologies, but the majority are either flame-shaped, e.g., NFT in AD, CBD, and PSP or globose, e.g., PiD, DLB, and NIFID. In contrast, a variety of inclusion morphologies are often present in FTLD-TDP including rounded, spicular, or skein-like inclusions (Davidson et al. 2007; Yaguchi et al. 2004).
The relationship between the various types of inclusion and the disease process itself is controversial. At least three hypotheses could be proposed to explain the relationship between the appearance of a particular inclusion and disease pathogenesis. First, that the pathological inclusions are the primary cause of the observed neurodegeneration (‘causal hypothesis’), e.g., deposition of abnormal tau or α-synuclein may be the key event causing neuronal degeneration. Second, that the lesions are a consequence of neurodegenerative processes but not directly related to their cause (‘reaction hypothesis’), e.g., in PiD and CBD, a pathological process unrelated to tau deposition could cause the degeneration of neurons and result in the aggregation of tau. Third, inclusions could be a consequence of the neurodegeneration, but their formation may be directly linked to the primary pathological mechanism (‘causal/reaction/hypothesis’). Hence, the presence of α-synuclein within cells could initiate the process of degeneration of neuronal pathways and then the subsequent formation of abnormal aggregates in the form of inclusions.
Hardy and Gwinn-Hardy (1998) suggested that there may be relatively few cellular pathways leading to cell death in different disorders, and as a consequence, diseases classified within different molecular groups may have pathological mechanisms in common. Recent research suggests that pathogenic proteins such as tau and α-synuclein can be secreted from cells, enter other cells, and seed small intracellular aggregates within these cells (Goedert et al. 2010; Steiner et al. 2011). This raises the possibility, first suggested by Braak and colleagues with reference to PD (Hawkes et al. 2007), that pathogenic agents may transfer along unmyelinated axons to basal areas of brain, the brain stem, and then to the cerebral cortex. If pathogenic proteins can spread from cell to cell in the cortex, then the resulting NCI may exhibit a spatial pattern which reflects this spread. Previous studies have suggested non-random distributions of NCI in the cerebral cortex of various disorders, the inclusions often exhibiting a distinct clustering pattern (Armstrong et al. 2001). The present study compared the spatial patterns of NCI in eight neurodegenerative disorders including four tauopathies (AD, PiD, CBD, PSP), two synucleinopathies (DLB, MSA), FTLD-TDP, and NIFID to determine whether the spatial patterns of the inclusions were consistent with cell-to-cell spread along anatomical pathways.
Materials and methods
Cases
With the exception of NIFID and FTLD-TDP, all cases were obtained from the Brain Bank, Department of Neuropathology, Institute of Psychiatry, King’s College, London, UK. NIFID cases (N = 10) (Armstrong et al. 2006b) were obtained from centres in Canada, Norway, Spain, Japan (one case from each), and from France, the UK, and the USA (two cases from each) and have been described in detail by Cairns et al. (2004c). FTLD-TDP cases (N = 15) were obtained from Harvard Brain Tissue Resource Centre, Belmont, MA (2 cases), Vancouver General Hospital (6 cases), University of Pittsburgh (3 cases), Washington University, St Louis (3 cases), and the University of California, Davis (1 case) (Armstrong et al. 2010). Demographic data and diagnostic criteria for the various disorders are listed in Table 1. Stage of disease was represented by neurofibrillary tangle score (range: 0, 1–6) (Braak et al. 2006) with the exception of DLB in which a PD staging scale for LB was used (range: 0, 1–6) (Braak et al. 2004).
Table 1.
Summary of demographic details, diagnostic criteria, immunohistochemistry, and brain areas studied in the different disorders
| Disorder | N | Age | M:F | IHC | Diagnostic criteria | Regions studied |
|---|---|---|---|---|---|---|
| AD | 6 | 78 (9.2) | 3:3 | AT8 (tau) | NINCDS/ADRDA/CERAD | SFG, SPL, ITG, PHG VC |
| PiD | 10 | 65.3 (11.3) | 7:3 | TP70 (tau) | Cairns et al. (2007) | SFG, ITG, PHG |
| CBD | 12 | 64.7 (9.07) | 8:4 | TP007 (tau) | NIH-ORD | SFG, SPL, ITG, PHG |
| PSP | 8 | 73.4 (7.4) | 4:4 | TP70 (tau) | NINDS-SPSP | SFG, ITG, PHG |
| DLB | 12 | 73.8 (7.2) | 12:0 | α116 | CDLB (α-synuclein) | SFG, ITG, PHG |
| MSA | 10 | 66.5 (8.51) | 7:3 | α116 | MCC (α-synuclein) | SFG, ITG, PHG |
| NIFID | 10 | 45.3 (12.1) | 7:3 | FUS | Cairns et al. (2007) | SFG, ITG, PHG |
| FTLD-TDP | 15 | 69.6 (8.50) | 7:2 | TDP-43 | Cairns et al. (2007) | SFG, ITG, PHG |
AD Alzheimer’s disease, PiD Pick’s disease, CBD corticobasal degeneration, PSP progressive supranuclear palsy, DLB dementia with Lewy bodies, MSA multiple system atrophy, NIFID neuronal intermediate filament inclusion disease, FTLD-TDP frontotemporal lobar degeneration with TDP-43 proteinopathy, FUS fused in sarcoma, TDP-43 transactive response (TAR) DNA-binding protein, N number of cases studied, IHC immunohistochemistry, M male, F female, SFG superior frontal gyrus (B8), SPL superior parietal lobule (B7a/7b), ITG inferior temporal gyrus (B22), PHG parahippocampal gyrus (B28), VC visual cortex (B17). Diagnostic criteria: ‘National Institute of Neurological and Communicative Disorders and Stroke and the Alzheimer Disease and Related Disorders Association’ (NINCDS/ADRDA) (Tierney et al. 1988), ‘Consortium to Establish a Registry of Alzheimer Disease’ (CERAD) criteria (Mirra et al. 1991); National Institute of Health-Office of rare disorders (NIH-ORD); National Institute of Neurological Disorders and Stroke (NINDS) and the Society of PSP (SPSP) (NINDS-SPSP) (Hauw et al. 1994, Litvan et al. 1996); ‘Consortium on Dementia with Lewy bodies’ (CDLB)’ (McKeith et al. 1996); ‘Minneapolis Consensus Criteria (MCC) (Gilman et al. 1998); Diagnostic criteria for PiD, NIFID and FTLD-TDP according to Cairns et al. (2007)
Tissue preparation
After death, the consent of the next of kin was obtained for brain removal, following local Ethical Committee procedures and the 1999 Declaration of Helsinki (as modified Edinburgh, 2000). Brain tissue was preserved in buffered 10 % formalin or 4 % paraformaldehyde. Tissue blocks were taken from various cortical areas (Table 1) including the superior frontal gyrus (SFG) (B8), the superior parietal lobule (SPL) (B7a/7b), the inferior temporal gyrus (ITG) (B22), the parahippocampal gyrus (PHG) (B28), and the occipital cortex (B17). Brain material was fixed in 10 % phosphate-buffered formal-saline, and embedded in paraffin wax. Immunohistochemistry (IHC) was performed on 6- to 8-μm sections using appropriate antibodies (Table 1). Sections were counterstained with haematoxylin.
Morphometric methods
In each region of the cerebral cortex examined, NCI were counted along a strip of tissue (3,200–6,400 μm in length) located parallel to the pia mater, using 250 × 50 μm sample fields arranged contiguously (Armstrong 2003) (Fig. 1). The sample fields were located both in the upper (approximating to laminae II/III) and lower (approximating to laminae V/VI) cortex, the short edge of the sample field being orientated parallel with the pia mater and aligned with guidelines marked on the slide. The number of NCI present in each sample field was counted.
Fig. 1.

Morphometric method of sampling the cerebral cortex in the various neurodegenerative disorders. Inclusions were counted along two strips of tissue parallel to the pia mater (1,600–3,200 μm in length) using 50 × 250 μm contiguous sample fields (X1–X5 etc). The sample fields were located both in the upper and lower cortical laminae and extend along the gyrus from sulcus to sulcus; the short edge of the field being aligned with guidelines marked on the slide
Data analysis
The data were analysed by spatial pattern analysis (Armstrong 1993b, 1997, 2006, 2007). This method uses the variance-mean ratio (V/M) to determine whether NCI were distributed randomly (V/M = 1), regularly (V/M <1), or were clustered (V/M >1) along a strip of tissue. Counts of NCI in adjacent sample fields were added together successively to provide data for increasing field sizes, e.g., 50 × 250 μm, 100 × 250 μm, 200 × 250 μm etc., up to a size limited by the length of the strip sampled. V/M was then plotted against field size to determine whether the clusters of NCI were regularly or randomly distributed and to estimate the mean cluster size parallel to the tissue boundary. A V/M peak indicates the presence of regularly spaced clusters while an increase in V/M to an asymptotic level suggests the presence of randomly distributed clusters. The statistical significance of a peak was tested using ‘t’ tests (Armstrong 1997). Spatial patterns of inclusions in the various regions were classified initially into four categories: random, uniform or regular, regularly distributed clusters, and large clusters (≥1,600 μm). The frequency of regions in which regularly distributed clusters were in the size range 400–800 μm was also determined. In addition, a more complex spatial pattern was evident in some areas in which smaller clusters of inclusions were aggregated into large superclusters and frequency of this pattern was determined for each disorder. The effect of inclusion morphology, type of disorder, and molecular pathology on the frequency of the different types of spatial pattern was tested using Chi-square (χ2) contingency table analysis.
In addition, the various disorders were compared using principal component analysis (PCA) (Armstrong et al. 2010) (STATISTICA software, Statsoft Inc., 2300 East 14th St, Tulsa, Ok, 74104, USA). The result of a PCA is a scatter plot of the eight disorders in relation to the extracted PC in which the distance between disorders reflects their similarity or dissimilarity based on the frequency of the different types of spatial patterns of their respective inclusions.
Finally, mean cluster size of NCI was compared between disorders using a one-way analysis of variance (ANOVA) (STATISTICA software, Statsoft Inc., 2300 East 14th St, Tulsa, Ok, 74104, USA) followed by Scheffé’s post hoc test. In each disorder, the correlation (Pearson’s ‘r’) between cluster size of the inclusions, disease duration, and disease stage were tested.
Results
Examples of the spatial patterns exhibited by various NCI in different disorders are shown in Figs. 2, 3, 4. Figure 2 shows a random distribution of tau-immunoreactive neuronal inclusions in CBD, while Fig. 3 shows a small cluster of LB, approximately 70 μm in diameter in DLB, and Fig. 4 a larger cluster of NCI in NIFID.
Fig. 2.

A random distribution of tau-immunoreactive neuronal inclusions in the tauopathy corticobasal degeneration (CBD). (tau immunohistochemistry, TP007 antibody, haematoxylin, Bar 80 μm)
Fig. 3.

A small cluster of Lewy bodies (LB), approximately 70 μm in diameter, in the synucleinopathy dementia with Lewy bodies (DLB) (α-synuclein immunohistochemistry, α116 antibody, haematoxylin, Bar 25 μm)
Fig. 4.
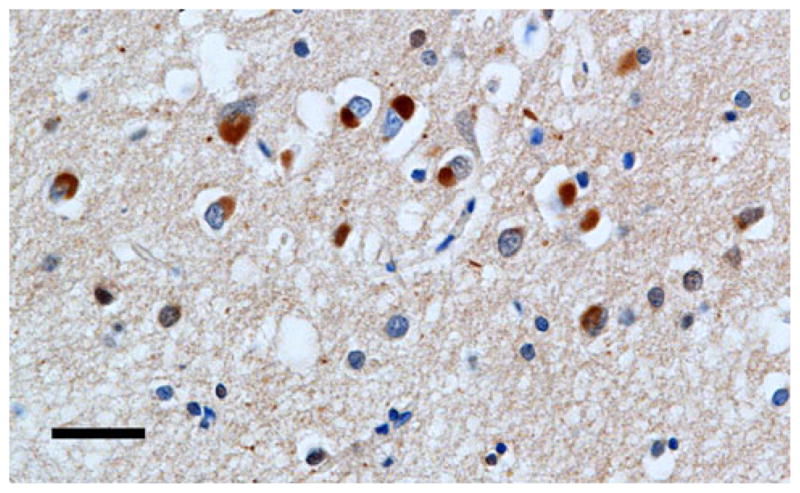
A larger cluster of neuronal cytoplasmic inclusions (NCI) in neuronal intermediate filament inclusion disease (NIFID) NIFID (FUS immunohistochemistry, haematoxylin, Bar 25 μm)
A comparison of the spatial patterns exhibited by the 3R tau-immunoreactive PB and α-synuclein-immunoreactive LB in the ITG of cases of PiD and DLB, respectively, is shown in Fig 5. Both types of inclusion are distributed in regular clusters. Hence, LB in DLB exhibited two V/M peaks, the first at a field size of 400 μm and the second at 1,600 μm, suggesting the presence of clusters of LB, 400 μm in diameter, regularly distributed parallel to the pia mater, and aggregated into larger clusters 1,600 μm in diameter. By contrast, PB in PiD exhibited a single V/M peak at a field size of 1,600 μm suggesting regularly distributed clusters of PB, 1,600 μm in diameter.
Fig. 5.

Pattern analysis plots showing examples of the spatial patterns exhibited by neuronal cytoplasmic inclusions (NCI) in the inferior temporal gyrus (ITG). A comparison of Lewy bodies (LB) in dementia with Lewy bodies (DLB) and Pick bodies (PB) in Pick’s disease (PiD). Significance of V/M peaks, *P <0.05, **P <0.01
A summary of the frequencies of the four types of spatial patterns exhibited by NCI in the upper and lower cortex of the eight disorders is shown in Table 2. Most frequently, NCI were clustered, mean cluster size being in the range 50–1,600 μm, and the clusters were regularly distributed parallel to the pia mater. This spatial pattern varied in frequency in different disorders from 33 % of gyri studied in MSA to 74 % in NIFID. Larger-scale clustering, in which the NCI occurred in clusters of at least 1,600 μm in diameter, but without regular spacing, was also present especially in PiD, CBD, and DLB. In some disorders, viz., PSP, MSA, and FTLD-TDP, the NCI were randomly distributed in a significant number of gyri.
Table 2.
Frequency of the different types of spatial pattern (R Random, U/RG uniform or regular, RGC in regularly distributed clusters, 50–1,600 μm in diameter, LC in large clusters, ≥1,600 μm in diameter) exhibited by neuronal cytoplasmic inclusions (NCI) in the upper (U) and lower (L) cortex of various neurodegenerative disorders: AD Alzheimer’s disease, PiD Pick’s disease, CBD corticobasal degeneration, PSP progressive supranuclear palsy, DLB dementia with Lewy bodies, MSA multiple system atrophy, NIFID neuronal intermediate filament inclusion disease, FTLD-TDP frontotemporal lobar degeneration with TDP-43 proteinopathy, NFT neurofibrillary tangles, PB Pick bodies, LB Lewy bodies
| Frequency of spatial pattern
| ||||||||
|---|---|---|---|---|---|---|---|---|
| Disorder | NCI | LM | N | R | U/RG | RGC | LC | % RGC |
| AD | NFT | U | 17 | 1 | 0 | 12 | 4 | |
| L | 13 | 0 | 0 | 10 | 3 | |||
| Total | 30 | 1 | 0 | 22 | 7 | 73 | ||
| PiD | PB | U | 29 | 1 | 0 | 16 | 12 | |
| L | 19 | 0 | 0 | 11 | 8 | |||
| Total | 48 | 1 | 0 | 27 | 20 | 53 | ||
| CBD | NCI | U | 43 | 2 | 1 | 24 | 16 | |
| L | 33 | 0 | 1 | 24 | 8 | |||
| Total | 76 | 2 | 2 | 48 | 24 | 63 | ||
| PSP | NFT | U | 11 | 6 | 0 | 5 | 0 | |
| L | 12 | 5 | 0 | 5 | 2 | |||
| Total | 23 | 11 | 0 | 10 | 2 | 43 | ||
| DLB | LB | U | 38 | 1 | 1 | 23 | 13 | |
| L | 32 | 1 | 0 | 20 | 11 | |||
| Total | 70 | 2 | 1 | 43 | 24 | 61 | ||
| MSA | NCI | U | 6 | 3 | 0 | 2 | 1 | |
| L | 3 | 2 | 0 | 1 | 0 | |||
| Total | 9 | 5 | 0 | 3 | 1 | 33 | ||
| NIFID | NCI | U | 27 | 4 | 1 | 20 | 2 | |
| L | 26 | 3 | 2 | 19 | 2 | |||
| Total | 53 | 7 | 3 | 39 | 4 | 74 | ||
| FTLD-TDP | NCI | U | 30 | 9 | 0 | 20 | 1 | |
| L | 19 | 9 | 1 | 7 | 2 | |||
| Total | 49 | 18 | 1 | 27 | 3 | 55 | ||
N total number of regions analysed for each disorder
Chi-square (χ2) contingency tests comparing totals of upper and lower cortex
Comparing all groups: χ2 = 107.78 (21 df, P <0.001)
Comparing tauopathies and synucleinopathies: χ2 = 0.16 (3 df, P >0.05)
Comparing tauopathies: χ2 = 55.27 (9 df, P <0.001)
Comparing 3R tauopathies with 4R tauopathies: χ2 = 5.94 (3 df, P >0.05)
Comparing synucleinopathies: χ2 = 27.36 (3 df, P <0.001)
Comparing PiD and CBD: χ2 = 2.52 (3 df, P >0.05)
Comparing AD and PSP: χ2 = 9.47 (2 df, P <0.01)
Comparing tauopathies and NIFID: χ2 = 13.96 (3 df, P <0.001)
Comparing tauopathies and FTLD-TDP: χ2 = 28.87 (3 df, P <0.001)
Comparing synucleinopathies and NIFID: χ2 = 12.13 (3 df, P <0.001)
Comparing synucleinopathies and FTLD-TDP: χ2 = 21.20 (3 df, P <0.001)
Comparing different morphologies: χ2 = 7.34 (3 df, P >0.05)
Chi-square (χ2) contingency tests (Table 2) suggested the following: (1) the frequency of the different spatial patterns of NCI was similar in the tauopathies and syncleinopathies (χ2 = 0.16, 3 df, P >0.05), (2) within the tauopathies, the spatial pattern of the PB in PiD was similar to that of the NCI in CBD (χ2 = 2.52, 3 df, P >0.05), but NFT in PSP exhibited a higher proportion of random distributions than in AD (χ2 = 9.47, 2 df, P <0.01), (3) within the tauopathies, disorders characterised by 3R tau (PiD) had similar spatial patterns of NCI to those characterised by 4R tau (PSP,CBD) (χ2 = 5.94, P >0.05, 3 df, P >0.05), (4) within the synucleinopathies, there was a greater frequency of random distributions of NCI in MSA compared with LB in DLB (χ2 = 27.36, 3 df, P <0.001), (5) there were significant differences in spatial patterns of NCI between the tauopathies and synucleinopathies compared with NIFID (χ2 = 13.96, 3 df, P <0.001) and FTLD-TDP (χ2 = 28.87, 3 df, P <0.001), smaller-scale clustering being more frequent in the latter two disorders, and (6) spatial patterns of NCI in disorders with predominantly cortical flame-shaped inclusions (AD, PSP, CBD) were similar to those in disorders with predominantly round or oval inclusions (PiD, DLB, NIFID) (χ2 = 7.34, 3 df, P >0.05). There were no significant differences in frequency of spatial patterns between upper and lower regions of the cortex.
A summary of the number of regions in each disorder in which first, regularly distributed clusters were in the size range 400–800 μm and second, a more complex spatial pattern was present is shown in Table 3. In a significant proportion of gyri in all disorders, with the exception of MSA, the regularly distributed clusters of inclusions were in the size range 400–800 μm. A more complex spatial pattern in which smaller clusters were aggregated into larger superclusters is present in a small number of regions in all disorders with the exception of MSA and PSP.
Table 3.
Frequency of brain regions in which regularly distributed clusters (RGC) of neuronal cytoplasmic inclusions (NCI) were either in the size range 400–800 μm or exhibited a more complex clustering pattern in which small clusters were aggregated to form larger clusters in various neurodegenerative disorders: AD Alzheimer’s disease, PiD Pick’s disease, CBD corticobasal degeneration, PSP progressive supranuclear palsy, DLB dementia with Lewy bodies, MSA multiple system atrophy, NIFID neuronal intermediate filament inclusion disease, FTLD-TDP frontotemporal lobar degeneration with TDP-43 proteinopathy, NFT neurofibrillary tangles, PB Pick bodies, LB Lewy bodies
| Frequency of spatial pattern | |||
|---|---|---|---|
| Disorder | NCI | RGC (400–800 μm) | Clusters/superclusters |
| AD | NFT | 6 | 4 |
| PiD | PB | 15 | 2 |
| CBD | NCI | 24 | 9 |
| PSP | NFT | 2 | 0 |
| DLB | LB | 14 | 6 |
| MSA | NCI | 0 | 0 |
| NIFID | NCI | 11 | 1 |
| FTLD-TDP | NCI | 5 | 6 |
Mean cluster size of NCI (Fig 6), averaged over all cortical areas, varied between the different disorders (F = 14.73, P <0.001), post hoc tests suggesting that (1) cluster sizes were essentially similar in AD, PiD, CBD, and DLB and (2) clusters were significantly larger in AD, PiD, CBD, and DLB than in PSP, MSA, NIFID, and FTLD-TDP. No statistically significant correlations were observed between cluster size of inclusions and either disease duration or stage.
Fig. 6.

Mean cluster size of the neuronal cytoplasmic inclusions (NCI) in the cortex of Alzheimer’s disease (AD), Pick’s disease (PiD), corticobasal degeneration (CBD), progressive supranuclear palsy (PSP), dementia with Lewy bodies (DLB), multiple system atrophy (MSA), neuronal intermediate filament inclusion disease (NIFID), frontotemporal lobar degeneration with TDP-43 proteinopathy (FTLD-TDP). Analysis of variance (ANOVA) (one-way with Scheffé’s post hoc tests): Cluster size F = 14.73 (P <0.001); Significant differences between groups: AD >PSP, NIFID, FTLD; PiD >PSP, NIFID, FTLD; CBD >NIFID, FTLD; DLB >PSP
A PCA of the data, based on the frequencies of the different types of spatial patterns, is shown in Fig. 7. The first two PC accounted for 96 % of the total variance in the data (PC1 = 69 %, PC2 = 27 %). A plot of the various disorders in relation to the first two PC (PC1 and PC2) suggested that spatial patterns of NCI in AD, CBD, PiD, DLB, and NIFID were similar, viz., in a significant proportion of regions, the inclusions were clustered and regularly distributed. However, in PSP and MSA the inclusions were also randomly distributed in a significant number of areas. FTLD-TDP cases adopt a more intermediate position and although primarily a cortical disorder, also exhibited random distributions of inclusions in some gyri.
Fig. 7.

A principal component analysis (PCA) of the neurodegenerative diseases based on the frequency of different types of spatial pattern: Alzheimer’s disease (AD), Pick’s disease (PiD), corticobasal degeneration (C), progressive supranuclear palsy (PSP), dementia with Lewy bodies (D), multiple system atrophy (MSA), neuronal intermediate filament inclusion disease (NIFID), frontotemporal lobar degeneration with TDP-43 proteinopathy (FTLD-TDP)
Discussion
Comparison between the different disorders is complicated by three factors. First, different antibodies were used for the various tauopathies. However, no differences in density, type, or morphology of NCI have been observed between the tau antibodies used (Armstrong et al. 2001). Second, there are different pathways of spread in the different disorders and the regions selected for study, mainly frontal and temporal, may not reflect the critical regions in all disorders. In AD, for example, the entorhinal cortex and PHG are affected early in the disease process, the pathology then spreading to affect the association areas of the brain and finally the primary sensory regions (De lacoste and White 1993). By contrast, in PiD, early stages of the disease are represented by loss of neurons in the fronto-insular cortex and anterior cingulate gyrus while the rest of the neocortex is affected much later in the disease. However, SFG, ITG, and PHG were studied in all disorders and are likely to be significantly affected by the relevant pathology. Third, different stages of the disease process are likely to be present within the various disorders. To attempt to address the effect of disease stage, the correlation between cluster size of inclusions and disease duration and disease stage was investigated. However, the data provided little evidence that cluster sizes altered consistently during the disease process which could have been due to the small number of cases studied within each disease category.
The data suggest that all types of NCI, regardless of morphology or molecular composition, were frequently clustered in the cortex and, in a significant proportion of gyri, the clusters of NCI were regularly distributed parallel to the pia mater (Armstrong et al. 2001). The frequency of this spatial pattern varied between disorders, being most frequent in NIFID and AD and least common in MSA. This spatial pattern includes disorders which have a prominent additional glial pathology, e.g., CBD (Armstrong 2009a), PSP (Armstrong et al. 2007), MSA (Armstrong et al. 2006a), and FTLD-TDP (Armstrong et al. 2010) or an additional molecular pathology in the form of beta-amyloidosis, as in AD (Armstrong 2009b). In addition, the PCA suggested the disorders could be divided into two groups: (1) AD, DLB, PiD, CBD, and NIFID which are characterised largely by regularly distributed clusters of inclusions, random distributions being rare and (2) PSP and MSA, in which random distributions of NCI were more frequent. FTLD-TDP occupies a somewhat intermediate position, NCI being essentially distributed in regularly distributed clusters but with a significant proportion of gyri exhibiting random distributions.
We suggest that the spatial patterns of the NCI is consistent with their development in association with the cells of origin of specific anatomical pathways (Armstrong 1993a, 2008; Armstrong et al. 2002) and therefore could be the result from cell-to-cell transfer of pathogenic proteins (Goedert et al. 2010; Steiner et al. 2011). In cortical regions, the cells of origin of the cortico-cortical projections are clustered and occur in bands which are more or less regularly distributed along the cortex. Individual bands of cells traverse the cortical laminae and, in the primate brain, these bands of cells may vary in width from 400–500 μm up to 800–1,000 μm depending on cortical region (Hiorns et al. 1991; De Lacoste and White 1993). In a proportion of gyri, the width of the NCI clusters and their distribution along the cortex is consistent with an association with these pathways with two exceptions. First, in some gyri, NCI occurred in significantly larger clusters, usually greater than 1,600 μm in diameter, and in some regions, small clusters of NCI were aggregated into larger ‘superclusters’. These results suggest that the smaller regularly distributed clusters of inclusions may ‘coalesce’ to form larger clusters as transfer and aggregation of pathogenic proteins proceeds (Armstrong 1993a). Second, NCI are randomly distributed in some gyri, especially in PSP and MSA, and to some extent in FTLD-TDP. Random distributions of inclusions are usually the result of low density (Armstrong et al. 2001) which is more likely to be the case in the cortex in PSP and MSA: primarily subcortical disorders (Armstrong Armstrong 2006, 2007). In contrast, FTLD-TDP is predominantly a cortical disorder but the NCI also exhibit random distributions in a significant proportion of gyri. Multiple TDP-immunoreactive pathologies including NCI, glial inclusions (GI), neuronal intranuclear inclusions (NII), and dystrophic neuritis (DN), however, are characteristic of FTLD-TDP and the density of NCI alone can be quite low, especially in some subtypes of the disease (Armstrong et al. 2010).
Despite similarities in spatial pattern, there were differences in cluster sizes of NCI suggesting variation in the degree to which specific cortical columns are affected in the different diseases. Hence, the largest clusters were observed in AD, PiD, DLB, and CBD and the smallest in PSP, MSA, FTLD-TDP, and NIFID. In MSA and PSP, the small cluster size could be attributable to the largely subcortical pathology, cortical degeneration occurring later in the disease process (Bigio et al. 1999, Armstrong 2006, 2007). In FTLD-TDP and NIFID-FUS, however, clusters of NCI were usually 50–200 μm in diameter, significantly smaller than the estimated diameter of the cell columns of the cortico-cortical projections. Hence, a more localised pattern of cortical degeneration appears to be present in NIFID and FTLD-TDP, and there could be additional molecular pathologies that may contribute to cortical degeneration in these two disorders.
Hence, NCI characterised by different molecular pathologies appear to be associated with similar spatial patterns, viz., the regularly distributed cluster of inclusions. In each disorder, there is the formation of a unique, abnormally aggregated, or misfolded protein which either causes neurodegeneration of specific anatomical pathways or results in a cellular response designed to sequester proteins into less harmful aggregates (Forman et al. 2004; Armstrong 2009b; Armstrong et al. 2008). A variety of mechanisms have been proposed by which misfolded proteins can directly affect cellular homeostasis including disruption of the ubiquitin degradation system, axonal transport, synaptic function, and protein sequestration (Forman et al. 2004). Of particular interest is whether the spatial patterns reflect cell-to-cell transfer of pathogenic proteins as suggested by Steiner et al. (2011). Proteins such as tau and α-synuclein can exit host cells, transfer between cells, gain access to new cells, and create pathology within these cells (Steiner et al. 2011). For example, α-synuclein taken up from the extracellular space can induce aggregation of other α-synuclein proteins in recipient cells. By analogy with the scrapie form of prion protein (PrPsc), nucleation or seeding activity of α-synuclein may result in a core of an NCI of transferred α-synuclein surrounded by additional layers of cytoplasmic α-synuclein contributed by the host cell. It is also possible that TDP-43 and FUS may have these properties and therefore, that cell-to-cell transfer may be a common mechanism determining cortical degeneration in a range of diseases.
In conclusion, neurodegenerative disorders characterised by NCI expressing different molecular pathologies and varying in morphology exhibit similar spatial patterns in the cerebral cortex, consistent with an association with specific anatomical pathways. The data provide some support for the hypothesis of cell-to-cell transfer of pathogenic proteins and that there are common patterns of cortical neurodegeneration occurring across the different disorders. It would be interesting to follow the spatial pattern of inclusions along the anatomical pathways in the various disorders to test more rigorously the hypothesis of cell-to-cell transport. Different disorders may be amenable to similar interventions, e.g., immunotherapy which targets extracellular pathogenic proteins could lead to their removal thus preventing or slowing cell-to-cell propagation (Villoslada et al. 2008).
Acknowledgments
We thank the families of patients whose generosity made this research possible. Support for this work was provided by grants from the National Institute on Aging of the National Institutes of Health (P50-AG05681 and P01-AG03991), the Hope Center for Neurological Disorders, the Charles F. and Joanne Knight Alzheimer’s Disease Research Centre, University School of Medicine, St. Louis, MO, USA. We thank the following for making tissue sections available for this study: Knight Alzheimer’s Disease Research Center, Washington University School of Medicine, St. Louis, MO, USA, Brain Bank, Institute of Psychiatry, King’s College London, London, UK, William Ellis (Department of Pathology, University of California, Davis, Sacramento, CA, USA), Ronald L. Hamilton (Department of Pathology, University of Pittsburgh, Pittsburgh, PA, USA), Ian R. A. Mackenzie (Department of Pathology, Vancouver General Hospital, Vancouver, Canada), E. Tessa Hedley-Whyte (Massachusetts General Hospital and Harvard Brain Tissue Resource Center, Belmont, MA, USA), Marla Gearing (Center for Neurodegenerative Disease, Emory University, Atlanta, GA, USA), Robert Perry Department of Neuropathology, Newcastle General Hospital, Newcastle-upon-Tyne, NE4 6BE, UK), Charles Duyckaerts, Laboratoire de Neuropathologie, Hôpital de la Salpêtrière, AP-HP, 75651, Paris, France), Felix Cruz-Sanchez (Institute of Neurological and Gerontological Sciences, International University of Catalonia, Barcelona, Spain), Kari Skullerud (Department of Pathology, Rikshospitalet, N-0027, Oslo, Norway), Eileen Bigio (Department of Pathology, Northwestern University Medical School, Chicago, Illinois, USA), and Hideaki Yokoo (Department of Pathology, Gunma University School of Medicine, Maebashi, Japan).
Footnotes
Conflict of interest: The authors report no conflicts of interest.
Contributor Information
Richard A. Armstrong, Email: R.A.Armstrong@aston.ac.uk, Vision Sciences, Aston University, Birmingham B4 7ET, UK
Nigel J. Cairns, Departments of Neurology and Pathology and Immunology, Washington University School of Medicine, Saint Louis, MO 63108, USA
References
- Armstrong RA. Is the clustering of neurofibrillary tangles in Alzheimer’s patients related to the cells of origin of specific cortico-cortical projections? Neurosci Lett. 1993a;160:57–60. doi: 10.1016/0304-3940(93)90916-9. [DOI] [PubMed] [Google Scholar]
- Armstrong RA. The usefulness of spatial pattern analysis in understanding the pathogenesis of neurodegenerative disorders, with special reference to plaque formation in Alzheimer’s disease. Neurodegeneration. 1993b;2:73–80. [Google Scholar]
- Armstrong RA. Analysis of spatial patterns in histological sections of brain tissue. J Neurosci Methods. 1997;73:141–147. doi: 10.1016/s0165-0270(96)02221-2. [DOI] [PubMed] [Google Scholar]
- Armstrong RA. Quantifying the pathology of neurodegenerative disorders: quantitative measurements, sampling strategies and data analysis. Histopathology. 2003;42:521–529. doi: 10.1046/j.1365-2559.2003.01601.x. [DOI] [PubMed] [Google Scholar]
- Armstrong RA. Methods of studying the planar distribution of objects in histological sections of brain tissue. J Microsc (Oxf) 2006;221:153–158. doi: 10.1111/j.1365-2818.2006.01559.x. [DOI] [PubMed] [Google Scholar]
- Armstrong RA. Measuring the spatial arrangement patterns of pathological lesions in histological sections of brain tissue. Folia Neuropathol. 2007;44:229–237. [PubMed] [Google Scholar]
- Armstrong RA. Clustering and periodicity of neurofibrillary tangles in the upper and lower cortical laminae in Alzheimer’s disease. Folia Neuropathol. 2008;46:26–31. [PubMed] [Google Scholar]
- Armstrong RA. Quantitative methods in neuropathology. Folia Neuropathol. 2009a;48:217–230. [PubMed] [Google Scholar]
- Armstrong RA. The molecular biology of senile plaques and neurofibrillary tangles in Alzheimer’s disease. Folia Neuropathol. 2009b;47:289–299. [PubMed] [Google Scholar]
- Armstrong RA, Cairns NJ. Clustering and spatial correlations of the neuronal cytoplasmic inclusions, astrocytic plaques and ballooned neurons in corticobasal degeneration. J Neural Transm. 2009;116:1103–1110. doi: 10.1007/s00702-009-0251-8. [DOI] [PubMed] [Google Scholar]
- Armstrong RA, Cairns NJ, Lantos PL. Dementia with Lewy bodies: clustering of Lewy bodies in human patients. Neurosci Lett. 1997;224:41–44. doi: 10.1016/s0304-3940(97)13451-6. [DOI] [PubMed] [Google Scholar]
- Armstrong RA, Cairns NJ, Lantos PL. Clustering of Pick bodies in cases of Pick’s disease. Neurosci Lett. 1998;242:81–84. doi: 10.1016/s0304-3940(98)00052-4. [DOI] [PubMed] [Google Scholar]
- Armstrong RA, Lantos PL, Cairns NJ. What does the study of spatial patterns of pathological lesions tell us about the pathogenesis of neurodegerative disorders. Neuropathology. 2001;21:1–12. doi: 10.1046/j.1440-1789.2001.00373.x. [DOI] [PubMed] [Google Scholar]
- Armstrong RA, Cairns NJ, Lantos PL. Are pathological lesions in neurodegenerative disorders the cause or the effect of the degeneration? Neuropathology. 2002;22:114–127. doi: 10.1046/j.1440-1789.2002.00446.x. [DOI] [PubMed] [Google Scholar]
- Armstrong RA, Cairns NJ, Lantos PL. Multiple system atrophy: topographic distribution of the α-synuclein associated pathological changes. Parkinsonism Rel Disord. 2006a;12:356–362. doi: 10.1016/j.parkreldis.2006.02.005. [DOI] [PubMed] [Google Scholar]
- Armstrong RA, Kerty E, Skullerud K, Cairns NJ. Neuropathological changes in ten cases of neuronal intermediate filament inclusion disease (NIFID): a study using α-internexin immunohistochemistry and principal components analysis (PCA) J Neural Transm. 2006b;113:1207–1215. doi: 10.1007/s00702-005-0387-0. [DOI] [PubMed] [Google Scholar]
- Armstrong RA, Lantos PL, Cairns NJ. Spatial topography of the neurofibrillary tangles in cortical and subcortical regions in progressive supranuclear palsy. Parkinsonism Rel Disord. 2007;13:50–54. doi: 10.1016/j.parkreldis.2006.07.004. [DOI] [PubMed] [Google Scholar]
- Armstrong RA, Lantos PL, Cairns NJ. What determines the molecular composition of abnormal protein aggregates in neurodegenerative disease? Neuropathology. 2008;28:351–365. doi: 10.1111/j.1440-1789.2008.00916.x. [DOI] [PubMed] [Google Scholar]
- Armstrong RA, Ellis W, Hamilton RL, Mackenzie IRA, Hedreen J, Gearing M, Montine T, Vonsattel J-P, Head E, Lieberman AP, Cairns NJ. Neuropathological heterogeneity in frontotemporal lobar degeneration with TDP-43 proteinopathy: a quantitative study of 94 cases using principal components analysis. J Neural Transm. 2010;117:227–239. doi: 10.1007/s00702-009-0350-6. [DOI] [PMC free article] [PubMed] [Google Scholar]
- Armstrong RA, Gearing M, Bigio EH, Cruz-Sanchez FF, Duyckaerts C, Mackenzie IRA, Perry RH, Skullerud K, Yokoo H, Cairns NJ. The spectrum and severity of FUS-immunoreactive inclusions in the frontal and temporal lobes of ten cases of neuronal intermediate filament inclusion disease. Acta Neuropathol. 2011a;121:219–228. doi: 10.1007/s00401-010-0753-3. [DOI] [PMC free article] [PubMed] [Google Scholar]
- Armstrong RA, Gearing M, Bigio EH, Cruz-Sanchez FF, Duyckaerts C, Mackenzie IRA, Perry RH, Skullerud K, Yokoo H, Cairns NJ. Spatial patterns of FUS-immunoreactive neuronal cytoplasmic inclusions (NCI) in neuronal intermediate filament inclusion disease. J Neural Transm. 2011b;118:1651–1657. doi: 10.1007/s00702-011-0690-x. [DOI] [PMC free article] [PubMed] [Google Scholar]
- Bigio EH, Brown DF, White CL. Progressive supranuclear palsy with dementia: cortical pathology. J Neuropath Exp Neurol. 1999;58:359–364. doi: 10.1097/00005072-199904000-00006. [DOI] [PubMed] [Google Scholar]
- Braak H, Ghebremedhin E, Rub U, Bratzke H, Del Tredici K. Stages in the development of Parkinson’s disease-related pathology. Cell Tissue Res. 2004;318:121–134. doi: 10.1007/s00441-004-0956-9. [DOI] [PubMed] [Google Scholar]
- Braak H, Alafuzoff I, Arzberger T, Kretzschmar H, Del Tredici K. Staging of Alzheimer disease-associated neurofibrillary pathology using paraffin sections and immunocytochemistry. Acta Neuropathol. 2006;112:389–404. doi: 10.1007/s00401-006-0127-z. [DOI] [PMC free article] [PubMed] [Google Scholar]
- Cairns NJ, Zhukareva V, Uryu K, Zhang B, Bigio E, Mackenzie IRA, Gearing M, Duyckaerts C, Yokoo H, Nakazato Y, Jaros E, Perry RH, Lee VMY, Trojanowski JQ. α-Internexin is present in the pathological inclusions of neuronal intermediate filament inclusion disease. Am J Pathol. 2004a;164:2153–2161. doi: 10.1016/s0002-9440(10)63773-x. [DOI] [PMC free article] [PubMed] [Google Scholar]
- Cairns NJ, Jaros E, Perry RH, Armstrong RA. Temporal lobe pathology of human patients with neurofilament inclusion disease. Neurosci Lett. 2004b;354:245–247. doi: 10.1016/j.neulet.2003.10.020. [DOI] [PubMed] [Google Scholar]
- Cairns NJ, Grossman M, Arnold SE, Burn DJ, Jaros E, Perry RH, Duyckaerts C, Stankoff B, Pillon B, Skullerud K, Cruz-Sanchez FF, Bigio EH, Mackenzie IRA, Gearing M, Juncos JL, Glass JD, Yokoo H, Nakazato Y, Mosaheb S, Thorpe JR, Uryu K, Lee VM-Y, Trojanowski JQ. Clinical and neuropathologic variation in neuronal intermediate filament inclusion disease (NIFID) Neurology. 2004c;63:1376–1384. doi: 10.1212/01.wnl.0000139809.16817.dd. [DOI] [PMC free article] [PubMed] [Google Scholar]
- Cairns NJ, Bigio EH, Mackenzie IRA, Neumann M, Lee VMY, Hatanpaa KJ, White CL, Schneider JA, Grinberg LT, Halliday G, Duyckaerts C, Lowe JS, Holm IE, Tolnay M, Okamoto K, Yokoo H, Murayama S, Woulfe J, Munoz DG, Dickson DW, Ince PG, Trojanowski JQ, Mann DMA. Neuropathologic diagnostic and nosological criteria for frontotemporal lobar degeneration: consensus of the Consortium for Frontotemporal Lobar Degeneration. Acta Neuropathol. 2007;114:5–22. doi: 10.1007/s00401-007-0237-2. [DOI] [PMC free article] [PubMed] [Google Scholar]
- Davidson Y, Kelley T, Mackenzie IRA, Pickering Brown S, Du Plessis D, Neary D, Snowden JS, Mann DMA. Ubiquinated pathological lesions in frontotemporal lobar degeneration contain TAR DNA-binding protein, TDP-43. Acta Neuropathol. 2007;113:521–533. doi: 10.1007/s00401-006-0189-y. [DOI] [PubMed] [Google Scholar]
- De Lacoste M, White CL. The role of cortical connectivity in Alzheimer’s disease pathogenesis: a review and model system. Neurobiol Aging. 1993;14:1–16. doi: 10.1016/0197-4580(93)90015-4. [DOI] [PubMed] [Google Scholar]
- Dickson DW. Neuropathological differentiation of progressive supranuclear palsy and corticobasal degeneration. J Neurol. 1999;246(Supp 2):6–15. doi: 10.1007/BF03161076. [DOI] [PubMed] [Google Scholar]
- Forman MS, Trojanowski JQ, Lee VM-Y. Neurodegenerative diseases: a decade of discoveries paves the way for therapeutic breakthroughs. Nat Med. 2004;10:1055–1063. doi: 10.1038/nm1113. [DOI] [PubMed] [Google Scholar]
- Gilman S, Low PA, Quinn N, Albanese A, Ben-Schlomo Y, Fowler CJ, Kaufmann H, Klockgether T, Lang AE, Lantos PL, Litvan I, Mathias CJ, Oliver E, Roberstson D, Schatz I, Wenning GK. Consensus statement on the diagnosis of multiple system atrophy. J Auton Nerv Syst. 1998;74:189–192. [PubMed] [Google Scholar]
- Goedert M, Spillantini MG, Serpell LC, Berriman J, Smith MJ, Jakes R, Crowther RA. From genetics to pathology: tau and alpha-synuclein assemblies in neurodegenerative diseases. Phil Trans Roy Soc (Lond) B Biol Sci. 2001;356:213–227. doi: 10.1098/rstb.2000.0767. [DOI] [PMC free article] [PubMed] [Google Scholar]
- Goedert M, Clavaguera F, Tolnay M. The propagation of prion-like protein inclusions in neurodegenerative diseases. Trends Neurosci. 2010;33:317–325. doi: 10.1016/j.tins.2010.04.003. [DOI] [PubMed] [Google Scholar]
- Hardy J, Gwinn-Hardy K. Genetic classification of primary neurodegenerative disease. Science. 1998;282:1075–1079. doi: 10.1126/science.282.5391.1075. [DOI] [PubMed] [Google Scholar]
- Hauw JJ, Daniel SE, Dickson D, Horoupian DS, Jellinger K, Lantos PL, McKee A, Tabaton M, Litvan I. Preliminary NINDS neuropathologic criteria for Steele-Richardson-Olszewski syndrome (PSP) Neurology. 1994;44:2015–2019. doi: 10.1212/wnl.44.11.2015. [DOI] [PubMed] [Google Scholar]
- Hawkes CH, Del Tredici K, Braak H. Parkinson’s disease: a dual hit hypothesis. Neuropathol Appl Neurobiol. 2007;33:599–614. doi: 10.1111/j.1365-2990.2007.00874.x. [DOI] [PMC free article] [PubMed] [Google Scholar]
- Hiorns RW, Neal JW, Pearson RCA, Powell TPS. Clustering of ipsilateral cortico-cortical projection neurons to area 7 in the rhesus monkey. Proc Roy Soc (Lond) 1991;246:1–9. doi: 10.1098/rspb.1991.0117. [DOI] [PubMed] [Google Scholar]
- Litvan I, Agid Y, Calne D, Campbell G, Dubois B, Davoisen RC, Goetz CG, Golbe LI, Grafman J, Growden JH, Hallett M, Jankovic J, Quinn NP, Tolisa E, Zee DS, Chase TW, FitzGibbon EJ, Hall Z, Juncos J, Nelson KB, Oliver E, Pramstaller P, Reich SG, Verny M. Clinical research criteria for the diagnosis of progressive supranuclear palsy (Steele-Richardson-Olszewski syndrome): report of the NINDS-SPSP International Workshop. Neurology. 1996;47:1–9. doi: 10.1212/wnl.47.1.1. [DOI] [PubMed] [Google Scholar]
- McKeith IG, Galasko D, Kosaka K, Perry EK, Dickson DW, Hansen LA, Salmon DP, Lowe J, Mirra SS, Byrne EJ, Lennox G, Quinn NP, Edwardosn JA, Ince PG, Bergeron C, Burns A, Miller BL, Lovestone S, Collerton D, Jansen ENH, Ballard C, de Vos RAI, Wilcock GK, Jellinger KA, Perry RH. Consensus guidelines for the clinical and pathological diagnosis of dementia with Lewy bodies (DLB): report of the consortium on DLB international workshop. Neurology. 1996;47:1113–1124. doi: 10.1212/wnl.47.5.1113. [DOI] [PubMed] [Google Scholar]
- Mirra SS, Heyman A, McKeel D, Sumi SM, Crain BJ, Brownlee LM, Vogel FS, Hughes JP, van Belle G, Berg L. The consortium to establish a registry for Alzheimer’s disease (CERAD). Part II. Standardization of the neuropathologic assessment of Alzheimer’s disease. Neurology. 1991;41:479–486. doi: 10.1212/wnl.41.4.479. [DOI] [PubMed] [Google Scholar]
- Morris HR, Baker M, Yasojima K, Houlden H, Khan MN, Wood NW, Hardy J, Grossman M, Trojanowski J, Revesz T, Bigio EH, Bergeron C, Janssen JC, McGeer PL, Rossor MW, Lees AJ, Lantos PL, Hutton M. Analysis of tau haplotypes in Pick’s disease. Neurology. 2002;59:443–445. doi: 10.1212/wnl.59.3.443. [DOI] [PubMed] [Google Scholar]
- Neumann M, Sampathu DM, Kwong LK, Truax AC, Micsenyi MC, Chou TT, Bruce J, Schuck T, grossman M, Clarke CM, McCluskey LF, Miller BL, Masliah E, Mackenzie IR, Feldmen H, Feiden W, Kretzschmar HA, Trojanowski JQ, Lee VMY. Ubiquinated TDP-43 in frontotemporal lobar degeneration and amylotrophic lateral sclerosis. Science. 2006;314:130–133. doi: 10.1126/science.1134108. [DOI] [PubMed] [Google Scholar]
- Neumann M, Roeher S, Kretzschmar HA, Rademakers R, Baker M, Mackenzie IRA. Abundant FUS-immunoreactive pathology in neuronal intermediate filament inclusion disease (NIFID) Acta Neuropathol. 2009;118:605–616. doi: 10.1007/s00401-009-0581-5. [DOI] [PMC free article] [PubMed] [Google Scholar]
- Reed LA, Wszolek ZK, Hutton M. Phenotypic correlates in FTDP-17. Neuropathol Aging. 2001;22:89–107. doi: 10.1016/s0197-4580(00)00202-5. [DOI] [PubMed] [Google Scholar]
- Saito Y, Ruberu NN, Sawabe M, Arai T, Tanaka N, Kakuta Y, Yamanouchi H, Marayama S. Staging of argyrophilic grains: an age-associated tauopathy. J Neuropathol Exp Neurol. 2004;63:911–918. doi: 10.1093/jnen/63.9.911. [DOI] [PubMed] [Google Scholar]
- Steiner JA, Angot E, Brunden P. A deadly spread: cellular mechanisms of α-synuclein transfer. Cell Death Differ. 2011;18:1425–1433. doi: 10.1038/cdd.2011.53. [DOI] [PMC free article] [PubMed] [Google Scholar]
- Tierney MC, Fisher RH, Lewis AJ, Zorzitto ML, Snow WG, Reid DW, Nieuwstraten P. The NINCDS-ADRDA work group criteria for the clinical diagnosis of probable Alzheimer’s disease. Neurology. 1988;38:359–364. doi: 10.1212/wnl.38.3.359. [DOI] [PubMed] [Google Scholar]
- Villoslada P, Melero I, Pablus JL, Martino G, Ucelli A, Montalban Y, Avila J, Rivest S, Acarin L, Appel S, Khoury SJ, McGeer P, Ferrer I, Delgado M, Obeso J, Schwartz M. Immunotherapy for neurological disease. Clin Immunol. 2008;128:294–305. doi: 10.1016/j.clim.2008.04.003. [DOI] [PubMed] [Google Scholar]
- Yaguchi M, Fujita Y, Amari M, Takatama M, Al-Sarraj S, Leigh PN, Okamoto K. Morphological differences of intraneural ubiquitin positive inclusions in the dentate gyrus and parahippocampal gyrus of motor neuron disease with dementia. Neuropathology. 2004;24:296–301. doi: 10.1111/j.1440-1789.2004.00567.x. [DOI] [PubMed] [Google Scholar]
- Yamaguchi H, Nakazato Y, Shoji M, Okamoto K, Ihara Y, Morimatsu M, Hirai S. Secondary deposition of beta amyloid within extracellular tangles in Alzheimer-type dementia. Am J Pathol. 1991;138:699–705. [PMC free article] [PubMed] [Google Scholar]
- Yokota O, Tsuchiya K, Terada S, Ishizu H, Uchikado H, Ikeda M, Oyanagi K, Nakano I, Murayama S, Kuroda S, Akiyama H. Basophilic inclusion body disease and neuronal intermediate filament inclusion disease: a comparative clinicopathological study. Acta Neuropathol. 2008;115:561–575. doi: 10.1007/s00401-007-0329-z. [DOI] [PubMed] [Google Scholar]