Abstract
An apoptosing cell demonstrates multitude of characteristic morphological and biochemical features, which vary depending on the stimuli and cell type. The gross majority of classical apoptotic hallmarks can be rapidly examined by flow and image cytometry. Cytometry thus became a technology of choice in diverse studies of cellular demise. A large variety of cytometric methods designed to identify apoptotic cells and probe mechanisms associated with this mode of cell demise have been developed during the past two decades.
In the present chapter we outline a handful of commonly used methods that are based on the assessment of: mitochondrial transmembrane potential, activation of caspases, plasma membrane alterations and DNA fragmentation.
Keywords: flow cytometry, apoptosis, single cell analysis, mitochondria, caspases, Annexin V, DNA fragmentation
1. Introduction
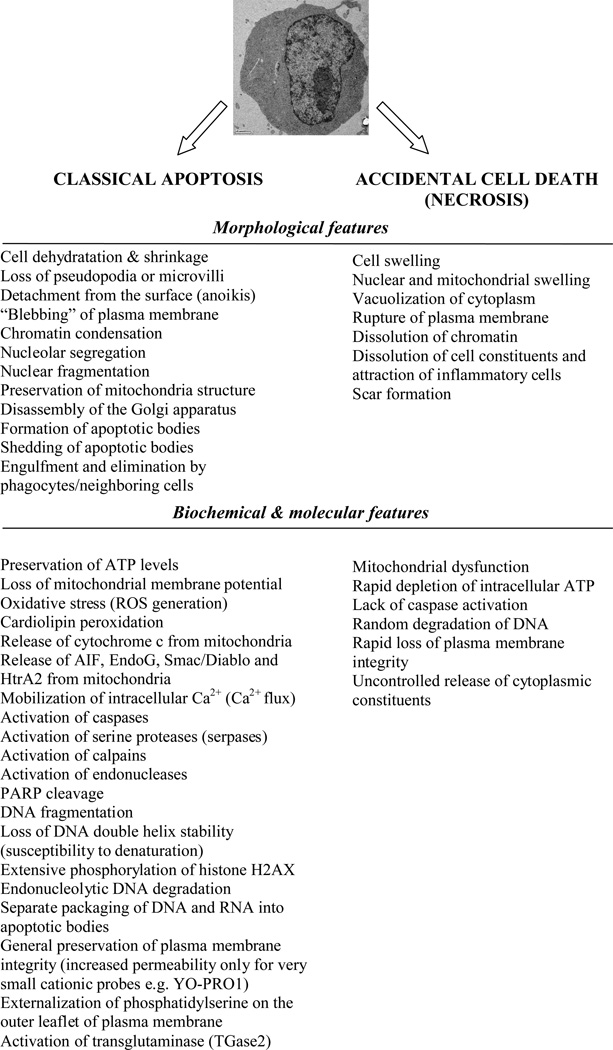
During the past decade mechanisms underlying cell death have entered into a focus of many researchers in diverse fields of biomedicine. These mechanisms include a wide range of signaling cascades that regulate initiation, execution and post-mortem cell disposal mechanisms (1–3). Figure 1 outlines major morphological and molecular changes occurring during classical caspase-dependent apoptosis vs. accidental cell death (herein termed as necrosis). Alterations in parameters presented in Figure 1 become a foundation to development of many markers for microscopy, cytometry and molecular biology techniques (1, 4). It is important to note, however, that the occurrence of specific apoptotic markers can show a profound divergence. Moreover, burgeoning data demonstrate that elimination of many cells may rely on alternative mechanisms (i.e. caspase-independent apoptosis-like PCD [programmed cell death], cornification, autophagy, necrosis-like PCD, mitotic catastrophe, etc) with critical connotations in both physiological and pathological processes (5, 6). The colloquial term “apoptosis” should be, therefore, restricted only to the demise program featuring all “hallmarks of apoptotic cell death”, namely: (i) activation of caspases as an absolute marker of cell death ; (ii) tight (geometric) compaction of chromatin; (iii) activation of endonucleases(s) causing internucleosomal DNA cleavage and extensive DNA fragmentation; (iv) appearance of distinctive cellular morphology with preservation of organelles, (v) cell shrinkage, (vi) plasma membrane blebbing and (vii) nuclear fragmentation followed by formation of apoptotic bodies (Fig 1) (7, 8).
Fig. 1.
Morphological and biochemical hallmarks of apoptosis and accidental cell death (necrosis). Note that some features characterizing apoptosis may not be present as they heavily depend on particular cell type, stimuli and cellular microenvironment.
In this context, a gross majority of classical apoptotic attributes can be quantitatively examined by flow cytometry, the preferred platform for rapid assessment of multiple cellular attributes at a single cell level (1–4, 9). The major advantages of flow cytometry include the possibility of multiparameter measurements (correlation of different cellular events at a time), single cell analysis (avoidance of bulk analysis), and rapid analysis time (thousand of cells per second) (3, 9). Flow cytometry overcomes, thus, sensitivity problems of traditional bulk techniques such as fluorimetry, spectrophotometry or gel techniques (e.g. Western blot). In this chapter, we outline only a handful of commonly used cytometric assays based on the assessment of: (i) mitochondrial transmembrane potential (Δψm loss), (ii) caspase activation, (iii) plasma membrane remodeling and (iv) DNA fragmentation (1–3).
2. Materials
2.1 Dissipation of mitochondrial transmembrane potential (Δψm)
Cell suspension (2.5×10⁵ – 2×10⁶ cells/mL).
1× PBS.
1.5 mL Eppendorf tubes.
12×75 mm Falcon FACS tubes (BD Biosciences).
1 mM tetramethylrhodamine methyl ester perchlorate (TMRM; Invitrogen/Molecular Probes) stock solution in DMSO. Store protected from light at −20°C. Reagent is stable for over 12 months. Caution: although there are no reports on TMRM toxicity, appropriate precautions should always be applied when handling TMRM solutions.
1 µM working solution of TMRM probe in PBS (make fresh as required).
TMRM staining mixture (for one sample). Prepare by adding 15 µL of 1 µM TMRM working solution to 85 µL of PBS (make fresh as required).
2.2 Activation of caspases – FLICA assay
Cell suspension (2.5×10⁵ – 2×10⁶ cells/mL).
1× PBS.
DMSO.
1.5 mL Eppendorf tubes.
12×75 mm Falcon FACS tubes (BD Biosciences)
Poly-caspases FLICA reagent (FAM-VAD-FMK; Immunochemistry Technologies LLC) (powder). Store protected from light at −20°C, stable for over 12 months.
Reconstituted stock of poly-caspases FLICA reagent. Prepare by adding 50 µl DMSO to the vial & mix by rolling. Store protected from light at −20°C, stable for over 6 months.
FLICA working solution. Make fresh as required by 5× dilution of the reconstituted FLICA stock in PBS.
50 µg/mL propidium iodide (PI) stock solution in PBS. Store protected from light at +4°C. Stable for over 12 months. Caution: PI is a DNA binding molecule and thus can be considered as a potential carcinogen. Always handle with care and use protective gloves.
Propidium iodide staining mixture. Prepare fresh as required by 10× dilution of PI stock in PBS.
2.3 Apoptotic changes in the plasma membrane – Annexin V assay
Cell suspension (2.5×10⁵ – 2×10⁶ cells/mL).
1× PBS.
Annexin V Binding Buffer (AVBB): 10 mM HEPES/NaOH pH 7.4; 140 mM NaCl, 2.5 mM CaCl2. Store at +4°C as long as no precipitate is visible.
1.5 mL Eppendorf tubes.
12×75 mm Falcon FACS tubes (BD Biosciences).
Annexin V- FITC or Annexin V-APC conjugate (Invitrogen/Molecular Probes), store protected from light at +4°C. Stable for over 12 months.
50 µg/mL propidium iodide (PI) stock solution in PBS. Store protected from light at +4°C. Reagent is stable for over 12 months. Caution: PI is a DNA binding molecule and thus can be considered as a potential carcinogen. Always handle with care and use protective gloves.
Propidium iodide staining mixture. Prepare fresh as required by 10× dilution of PI stock in AVBB.
2.4 Assessment of fractional DNA content (sub-G1 fraction)
Cell suspension (5×10⁵ – 1×10⁶ cells/mL).
Cold 70% EtOH (store at −20°C).
1× PBS.
1.5 mL Eppendorf tubes.
12×75 mm Falcon FACS tubes (BD Biosciences).
1 mg/mL propidium iodide (PI) stock solution in PBS. Store protected from light at +4°C. Reagent is stable for over 12 months. Caution: PI is a DNA binding molecule and thus can be considered as a potential carcinogen. Always handle with care and use protective gloves.
1 mg/mL RNase A solution in MilliQ water (available from Sigma). Store protected from light at −20°C. Reagent is stable for over 12 months.
Staining mixture (for one sample). Prepare fresh as required by adding 954 µL of PBS, 30 µL of RNase A and 16 µL of PI stock solution.
3 Methods
3.1 Dissipation of mitochondrial transmembrane potential (Δψm)
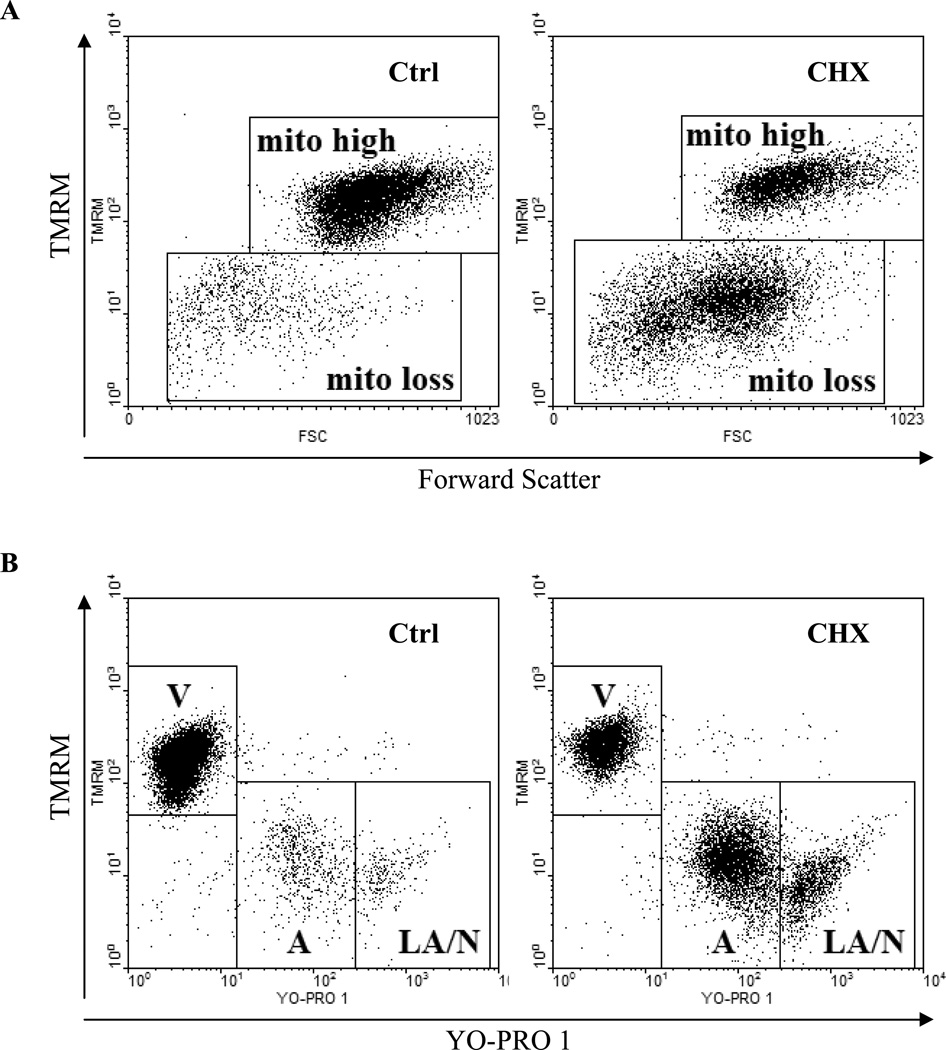
The cytometric detection of Δψm loss is a sensitive marker of early apoptotic events (see Notes 1–3). Procedure is based on a tetramethylrhodamine methyl ester perchlorate (TMRM), a fluorescent lipofilic cationic probe readily taken up by live cells and accumulating in energized mitochondria (10). The extent of its uptake, as measured by intensity of cellular fluorescence, is proportional to cellular Δψm status (Fig. 2A; see Notes 4 & 5). TMRM probe is particularly useful for multiparameter assays combining diverse apoptotic markers (see Note 6) (Fig 2B) (4, 10, 11).
Collect cell suspension into 12×75 mm Falcon FACS tube and centrifuge 5 min, 1100 rpm at room temperature (RT).
Resuspend cell pellet in 1–2 mL of PBS and centrifuge 5 min, 1100 rpm.
Discard supernatant and add 100 µL of TMRM staining mix.
Gently agitate to resuspend cell pellet.
Incubate 20 min at +37°C, protected from direct light.
Add 500 µL PBS and keep samples on ice.
Analyze on a flow cytometer. Use 488 nm excitation line (Argon-ion laser or solid state laser) and emission collected at 575 nm. Adjust the logarithmic amplification scale to distinguish between viable cells (bright TMRM+), apoptotic cells/necrotic cells with compromised plasma membranes (TMRM−) (see Fig. 2A).
Fig. 2.
Dissipation of mitochondrial transmembrane potential (Δψm).
A) Analysis by staining with tetramethylrhodamine methyl ester (TMRM). Human B-cell lymphoma cells were either untreated (Ctrl) or treated with cycloheximide (CHX) to induce apoptosis and supravitally loaded with TMRM as described (10, 17). Cells with collapsed mitochondrial transmembrane potential (mito loss) have decreased intensity of orange TMRM fluorescence. Note that by only employing the Δψm- sensitive probe there is no distinction between early, late apoptotic and necrotic cells.
B) Multiparameter analysis employing mitochondrial potential sensitive probes using concurrent analysis of collapse of Δψm and early plasma membrane permeability during apoptosis. Cells were treated as in Fig. 4A and supravitally stained with both YO-PRO 1 and TMRM probes (20). Their green and orange fluorescence was measured by flow cytometry. Live cells (V) are both TMRMhigh and exclude YO-PRO 1. Early apoptotic cells (A) exhibit loss of Δψm (TMRMlow) and moderate uptake of YO-PRO 1. Late apoptotic/secondary necrotic cells (LA/N) are highly permeant to YO-PRO 1 probe. Note that multiparameter analysis of Δψm-sensitive probe with YO-PRO 1 allows for a lucid distinction between live, early, late apoptotic and necrotic cells.
3.2 Activation of caspases – FLICA assay
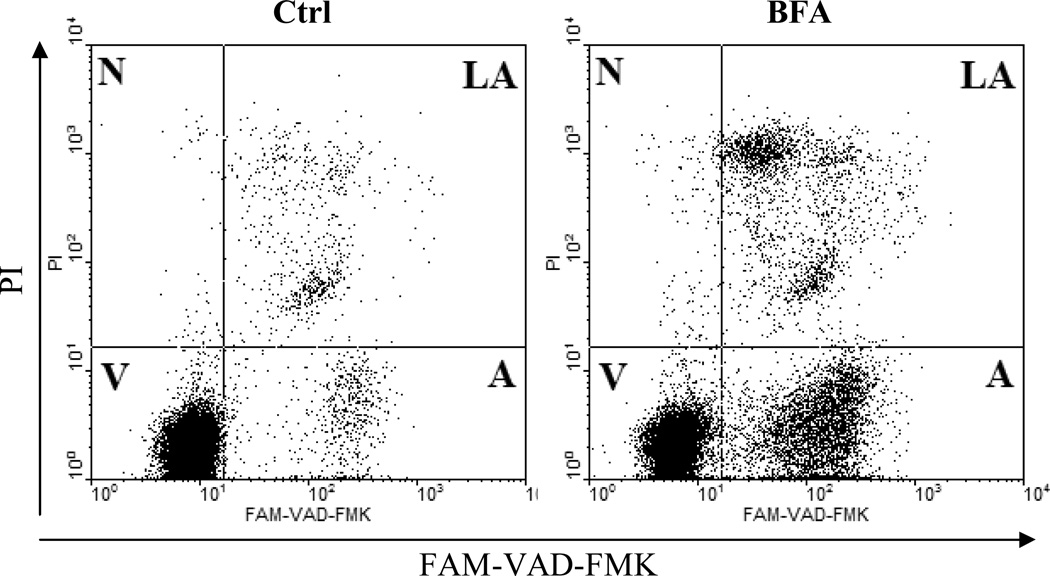
Use of fluorochrome-labeled inhibitors of caspases (FLICA) allows for a convenient estimation of apoptosis by both cytometry and fluorescence microscopy (11) (see Notes 1–3). FLICAs were designed as affinity ligands to active centers of individual caspases and their specificity towards individual caspases is provided by the four amino-acid peptide. Presence of the fluorescent tag (FITC or SR) allows detection of FLICA-caspase complexes inside viable cells (11, 12). When applied together with the plasma membrane permeability marker propidium iodide (PI), several consecutive stages of apoptosis can be distinguished (see Fig. 3 and Notes 6 & 7) (11, 12).
Collect cell suspension into 12×75 mm Falcon FACS tube and centrifuge 5 min, 1100 rpm at room temperature (RT).
Resuspend cell pellet in 1–2 mL of PBS and centrifuge 5 min, 1100 rpm.
Discard supernatant and add 100 µL of PBS.
Gently agitate to resuspend cell pellet and add 3 µL of FLICA working solution.
Incubate 60 min at +37°C, protected from direct light. Gently agitate cells every 20 min to allow homogenous loading with FLICA probe.
Add 2 mL of PBS and centrifuge 5 min, 1100 rpm at RT.
Discard supernatant and repeat step 6.
Discard supernatant and add 100 µL of PI staining mix.
Incubate 3–5 min and add 500 µL of PBS. Keep samples on ice.
Analyze samples on a flow cytometer. Use 488 nm excitation line (Argon-ion laser or solid state laser) and emission collected at 530 nm (green, FLICA) and 575–610 nm (orange, PI). Carefully adjust the logarithmic amplification scale and compensation between green and orange channels. Distinguish between viable cells (FLICA− / PI−), early apoptotic cells (FLICA+ / PI−), late apoptotic/secondary necrotic cells (FLICA+ / PI+) and primary necrotic cells (FLICA− / PI+)(see Fig. 3).
Fig. 3.
Detection of activated caspases by fluorescently labeled inhibitors of caspases (FLICA) combined with plasma membrane permeability assessment (propidium iodide; PI). Human B-cell lymphoma cells were either untreated (Ctrl) or treated with Brefeldin A (BFA) to induce apoptosis as described (20). Cells were subsequently supravitally stained with FAM-VAD-FMK (pan caspase marker; FLICA) and PI. Their logarithmically amplified green and red fluorescence signals were measured by flow cytometry. Live cells (V) are both FAM-VAD-FMK and PI negative. Early apoptotic cells (A) bind FAM-VAD-FMK but exclude PI. Late apoptotic/secondary necrotic cells (LA) are both FAM-VAD-FMK and PI positive. Primary necrotic and some very late apoptotic cells (N) stain with PI only.
3.3 Apoptotic changes in the plasma membrane – Annexin V assay
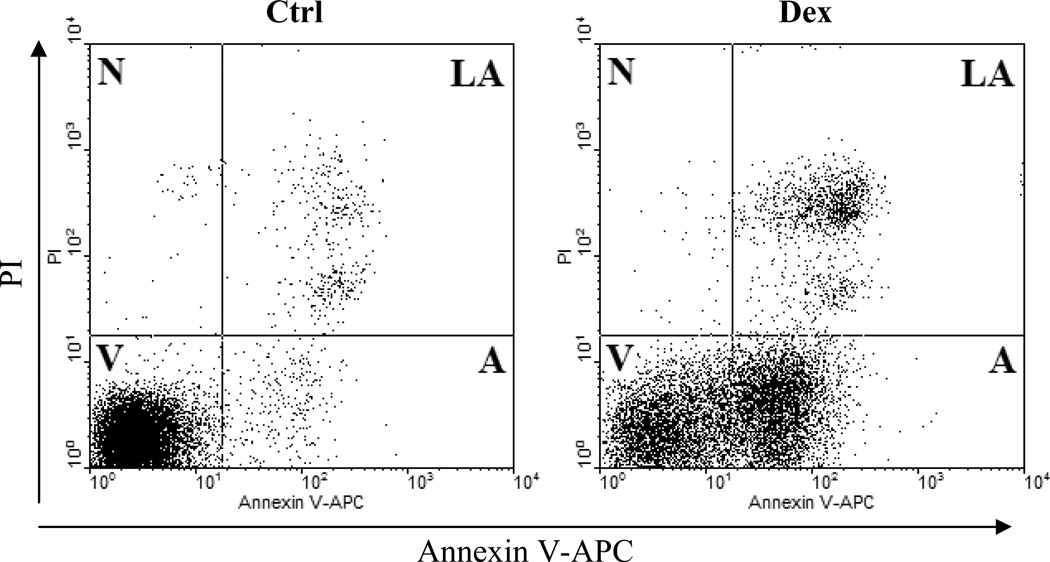
Under physiological conditions, choline phospholipids (phosphatidylcholine, sphingomyelin) are exposed on the external leaflet while aminophospholipids (phosphatidylserine, phosphatidylethanolamine) are exclusively located on the cytoplasmic surface of the lipid bilayer. This asymmetry is scrambled during apoptosis when phosphatidylserine (PS) becomes exposed on the outside leaflet of the membrane (13, 14). The detection of PS by fluorochrome-tagged 36 kDa anticoagulant protein Annexin V allows for a precise estimation of apoptotic incidence (14) (see Fig. 4 and Notes 1–3). This probe reversibly binds to phosphatidylserine residues only in the presence of mM concentration of divalent calcium ions.
Collect cell suspension into 12×75 mm Falcon FACS tube and centrifuge 5 min, 1100 rpm at room temperature (RT).
Resuspend cell pellet in 1–2 mL of Annexin V Binding Buffer (AVBB) and centrifuge as in step 1.
Discard supernatant and add 100 µL of PI staining mix in AVBB.
Add 2–4 µl of Annexin V-FITC or -APC conjugate.
Incubate 15 min at RT.
Add 500 µL of AVBB and keep samples on ice.
Analyze samples on a flow cytometer. Use 488 nm excitation line (Argon-ion laser or solid state laser) and emission collected at 530 nm (green, FITC) and 575–610 nm (orange, PI). Alternatively use flow cytometer with 488 nm excitation for PI (emission collected at 530 nm) and 633 nm excitation for Annexin V-APC conjugate (emission collected at 660 nm). Carefully adjust the logarithmic amplification scale and compensation between green and orange channels. No compensation between PI and APC conjugate is needed. Distinguish between viable cells (Annexin V− / PI−), early apoptotic cells (Annexin V+ / PI−), late apoptotic/necrotic cells (Annexin V+ / PI+) and late necrotic cells (Annexin V− / PI+) as seen in Fig. 4 (also see Notes 8 & 9).
Fig. 4.
Apoptotic changes in plasma membrane. Detection of apoptosis by concurrent staining with annexin V–APC and PI. Human B-cell lymphoma cells were untreated (left panel) or treated with dexamethasone (right panel), as described previously (17). Cells were subsequently stained with annexin V – APC conjugate and PI and their far-red and red fluorescence was measured by flow cytometry. Live cells (V) are both annexin V and PI negative. At early stage of apoptosis (A) the cells bind annexin V while still excluding PI. At late stage of apoptosis (N) they bind annexin V-FITC and stain brightly with PI.
3.4 Assessment of fractional DNA content (sub-G1 fraction)
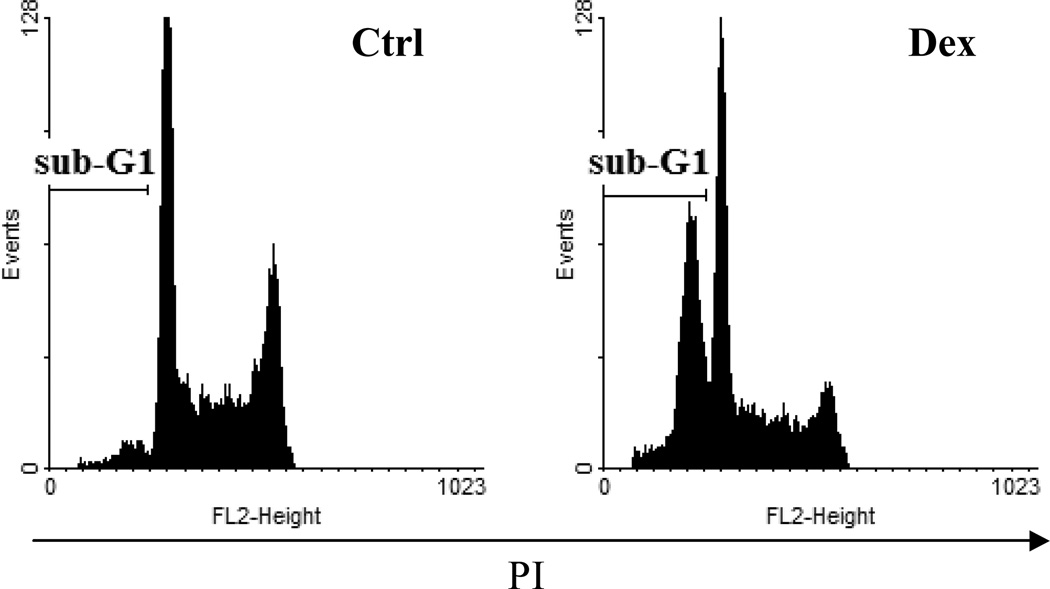
The fragmented, low molecular weight DNA can be extracted from cells during the process of cell staining in aqueous solutions (15, 16). Such extraction takes place when the cells are treated with precipitating fixatives such as ethanol or methanol (see Note 10). As a result of DNA extraction apoptotic cells exhibit a deficit in DNA content and following staining with a DNA-specific fluorochrome they can be recognized by flow cytometry as cells having fractional DNA content (16). On frequency distribution histograms these events are characterized by a distinctive “sub-G1" peak that represents oligonucleosomal DNA fragments (Fig 5; see Notes 11–13).
Collect 1 mL of cell suspension into Eppendorf tubes and centrifuge 5 min, 1500 rpm at room temperature (RT).
Resuspend cell pellet in 60 µL of PBS.
While vortexing add drop-by-drop 1 mL of ice-cold 70% EtOH.
Permeabilize cells for at least 1.5 h at −20°C or overnight at +4°C. Samples can be stored for months at −20°C.
Centrifuge 10 min, 1800 rpm at room temperature (RT).
Gently discard supernatant and add 1 mL staining mixture containing PI and RNase A. Residual EtOH can be left without interference with assay performance.
Vortex to resuspend cell pellet and incubate 60 min at +37°C protected from direct light.
Analyze on a flow cytometer. Use 488 nm excitation line (Argon-ion laser or solid state laser) and emission collected at 575–610 nm. Adjust the linear amplification scale to obtain cell cycle profile and “sub-G1” peak as seen in Fig. 5 (also see Notes 11–12).
Fig. 5.
Detection of fractional DNA content (“sub-G1 peak”). Apoptosis of human follicular lymphoma cells was induced with dexamethasone (Dex). Ethanol fixed and propidium iodide (PI) stained cells were analyzed on a flow cytometer. Red fluorescence of PI was collected using linear amplification scale. Debris were gated out electronically. Note distinctive sub-G1 peak. For further details refer to text.
Acknowledgements
Supported by NCI CA RO1 28 704 (ZD). JS received the L’Oreal Poland-UNESCO “For Women In Science” 2007 Award and MRC Career Development fellowship.
Footnotes
The universal term “apoptosis”, has a propensity to misinterpret the actual phenotype of cell suicide program (4, 5, 8). Thus, the use of the generic term apoptosis should be always accompanied by listing the particular morphological and/or biochemical apoptosis-associated feature(s) that was(were) detected (4, 7, 8).
Morphological criteria (examined by the light, fluorescent and electron microscopy) are still the “gold standard” to define the mode of cell death and confirm results obtained by flow cytometry (1–5). Lack of microscopic examination may potentially lead to the misclassification and false positive or negative artifacts, and is a common drawback of the experimental design (1–4). The best example of such misclassification is identification of phagocytes that engulfed apoptotic bodies as individual apoptotic cells (3).
Cell harvesting by trypsinization, mechanical or enzymatic cell disaggregation from tissues, extensive centrifugation steps, may all lead to preferential loss of apoptotic cells. On the other hand some cell harvesting procedures interfere with apoptotic assays as discussed elsewhere (1–3).
Loss (dissipation) of the mitochondrial transmembrane potential appears to be and early and initially a transient event, followed by permanent collapse later during apoptotic cascade (3, 4). Depolarization of mitochondrial membrane is usually followed by rapid activation of caspases followed by externalization of phosphatidylserine. As a result loss of staining with TMRM probe precedes binding of fluorescently labeled inhibitors of caspases (FLICA). Our recent studies revealed also that the time-window of apoptosis detected by FLICA binding is much wider than that by the Annexin V binding (4, 11).
According to Nernst equation, the intracellular distribution of any cationic mitochondrial probe reflects the differences in the transmembrane potential across both the plasma membrane (i.e. between exterior vs. interior of the cell) and the outer mitochondrial membrane (2, 3, 10). Thus, apart from mitochondria the probes can also accumulate in the cytosol. This is facilitated by both active and passive transport across the plasma membrane. Caution should be also taken, as cationic probes may be targeted to other organelles like endoplasmic reticulum (ER) or lysosomes. Moreover, accumulation of some probes may be influenced by the activity of multidrug efflux pumps (MDR). In each experiment it is advisable to assess probes’ specificity by pre-incubation of cells for 20 to 30 min with 50–100 µM protonophores CCCP or FCCP. Both agents collapse the mitochondrial transmembrane potential and should be used as positive controls (2, 3, 10).
FLICAs are highly permeant to plasma membrane and relatively nontoxic. This provides a unique opportunity to detect caspase activation in living cells where uptake of these reagents is followed by covalent binding to activated caspases. To date, no interference resulting by MDR efflux pump activity has been reported for FLICA uptake. Extensive multiplexing combinations are compatible with both single and multilaser instrumentation (11, 12, 17).
FLICAs withstand cell fixation (with 4% paraformaldehyde; PFA) and subsequent cell permeabilization with 70% ethanol or methanol. As a result, this assay can be combined with the analysis of cell attributes that can require prior cell permeabilization such as DNA content measurement, DNA fragmentation (TUNEL assay), etc (11, 12, 17).
A range of Annexin V conjugates with organic fluorescent probes is commercially available with the predominant popularity of FITC, PE and APC conjugates. There is also a considerable progress in inorganic, semiconductor nanocrystals (Quantum Dots; QDs) conjugates (18). Their significant advantages over currently available organic fluorochromes are rapidly attracting attention in both cytometric and imaging applications (19).
The interpretation of results from Annexin V assay may be difficult after mechanical disaggregation of tissues to isolate individual cells, enzymatic (e.g. by trypsinization) or mechanic detachment (e.g. by “rubber policeman”) of adherent cells from culture flasks, cell electroporation, chemical cell transfection or high-titer retroviral infections. These conditions reportedly influence phosphatidylserine flipping. A high surface expression of phosphatidylserine has also been detected on some healthy cells such as: differentiating monocytes, activated T cells, positively selected B lymphocytes, activated neutrophils or myoblasts fusing into myotubes (1–3, 9).
Fixation with crosslinking fixatives such as formaldehyde, on the other hand, results in the retention of low MW DNA in the cell as they become crosslinked to intercellular proteins. Therefore a formaldehyde fixation is incompatible with the "sub-G1" assay (1–3).
Optimally, the “sub-G1 peak” representing apoptotic cells should be separated with little or no overlapping from the G1 peak of the nonapoptotic cell population. The degree low molecular weight DNA extraction varies, however, markedly depending on the extent of DNA degradation (duration of apoptosis), the number of cell washings, pH and molarity of the washing/staining buffers. Shedding of apoptotic bodies containing fragments of nuclear chromatin may also contribute to the loss of DNA from apoptotic cells. As a result, the separation of "sub-G1" is not always satisfactory (1–3).
Estimation of the sub-G1 fraction fails when DNA degradation does not proceed to internucleosomal regions but stops after generating 50–300 kb fragments. Little DNA can be extracted then from the cells and rigid reliance on this method provides false negative results (1–3). If G2/M or even late S phase cells undergo apoptosis, the loss of DNA from these cells may not produce the sub-G1 peak. These apoptotic cells often end up with DNA content equivalent to G1/early S phase and are, thus, indistinguishable (1–3).
Some markers (like oligonucleosomal DNA fragmentation) may not be detected in specimens challenged with divergent stimuli or microenvironmental conditions (e.g. cytokines, growth factor deprivation, heterotypic cell culture, etc.). It is always advisable to simultaneously study several markers to provide a multidimensional view of advancing apoptotic cascade (1–3). Multiparameter assays detecting several cell attributes are the most desirable solution for flow cytometric quantification of apoptosis (3, 4).
Views and opinions described in this chapter were not influenced by any conflicting commercial interests.
References
- 1.Darzynkiewicz Z, Juan G, Li X, Gorczyca W, Murakami T, Traganos F. Cytometry in cell necrobiology: analysis of apoptosis and accidental cell death (necrosis) Cytometry. 1997;27:1–20. [PubMed] [Google Scholar]
- 2.Darzynkiewicz Z, Li X, Bedner E. Use of flow and laser-scanning cytometry in analysis of cell death. Methods Cell Biol. 2001;66:69–109. doi: 10.1016/s0091-679x(01)66005-9. [DOI] [PubMed] [Google Scholar]
- 3.Darzynkiewicz Z, Huang X, Okafuji M, King MA. Cytometric methods to detect apoptosis. Methods Cell Biol. 2004;75:307–341. doi: 10.1016/s0091-679x(04)75012-8. [DOI] [PubMed] [Google Scholar]
- 4.Wlodkowic D, Skommer J, Darzynkiewicz Z. SYTO probes in the cytometry of tumor cell death. Cytometry A. 2008;73:496–507. doi: 10.1002/cyto.a.20535. [DOI] [PubMed] [Google Scholar]
- 5.Leist M, Jaattela M. Four deaths and a funeral: from caspases to alternative mechanisms. Nat Rev Mol Cell Biol. 2001;2:589–598. doi: 10.1038/35085008. [DOI] [PubMed] [Google Scholar]
- 6.Kroemer G, Martin SJ. Caspase-independent cell death. Nat Med. 2005;11:725–730. doi: 10.1038/nm1263. [DOI] [PubMed] [Google Scholar]
- 7.Blagosklonny MV. Cell death beyond apoptosis. Leukemia. 2000;14:1502–1508. doi: 10.1038/sj.leu.2401864. [DOI] [PubMed] [Google Scholar]
- 8.Zhivotovsky B. Apoptosis, necrosis and between. Cell Cycle. 2004;3:64–66. [PubMed] [Google Scholar]
- 9.Telford WG, Komoriya A, Packard BZ. Multiparametric analysis of apoptosis by flow and image cytometry. Methods Mol Biol. 2004;263:141–160. doi: 10.1385/1-59259-773-4:141. [DOI] [PubMed] [Google Scholar]
- 10.Castedo M, Ferri K, Roumier T, Metivier D, Zamzami N, Kroemer G. Quantitation of mitochondrial alterations associated with apoptosis. J Immunol Methods. 2002;265:39–47. doi: 10.1016/s0022-1759(02)00069-8. [DOI] [PubMed] [Google Scholar]
- 11.Pozarowski P, Huang X, Halicka DH, Lee B, Johnson G, Darzynkiewicz Z. Interactions of fluorochrome-labeled caspase inhibitors with apoptotic cells: a caution in data interpretation. Cytometry A. 2003;55:50–60. doi: 10.1002/cyto.a.10074. [DOI] [PubMed] [Google Scholar]
- 12.Smolewski P, Grabarek J, Lee BW, Johnson GL, Darzynkiewicz Z. Kinetics of HL-60 cell entry to apoptosis during treatment with TNF-α or camptothecin assayed by stathmo-apoptosis method. Cytometry. 2002;47:143–149. doi: 10.1002/cyto.10062. [DOI] [PubMed] [Google Scholar]
- 13.Koopman G, Reutelingsperger CPM, Kuijten GAM, Keehnen RMJ, Pals ST, van Oers MHJ. Annexin V for flow cytometric detection of phosphatidylserine expression of B cells undergoing apoptosis. Blood. 1994;84:1415–1420. [PubMed] [Google Scholar]
- 14.van Engeland M, Nieland LJW, Ramaekers FCS, Schutte B, Reutelingsperger PM. Annexin V-affinity assay: a review on an apoptosis detection system based on phosphatidylserine exposure. Cytometry. 1998;31:1–9. doi: 10.1002/(sici)1097-0320(19980101)31:1<1::aid-cyto1>3.0.co;2-r. [DOI] [PubMed] [Google Scholar]
- 15.Nicoletti I, Migliorati G, Pagliacci MC, Grignani F, Riccardi C. A rapid and simple method for measuring thymocyte apoptosis by propidium iodide staining and flow cytometry. J Immunol Meth. 1991;139:271–280. doi: 10.1016/0022-1759(91)90198-o. [DOI] [PubMed] [Google Scholar]
- 16.Gong J, Traganos F, Darzynkiewicz Z. A selective procedure for DNA extraction from apoptotic cells applicable for gel electrophoresis and flow cytometry. Anal. Biochem. 1994;218:314–319. doi: 10.1006/abio.1994.1184. [DOI] [PubMed] [Google Scholar]
- 17.Wlodkowic D, Skommer J, Pelkonen J. Multiparametric analysis of HA14-1-induced apoptosis in follicular lymphoma cells. Leukemia Res. 2006;30:1187–1192. doi: 10.1016/j.leukres.2005.11.024. [DOI] [PubMed] [Google Scholar]
- 18.Le Gac S, Vermes I, van den Berg A. Quantum dots based probes conjugated to annexin V for photostable apoptosis detection and imaging. Nano Lett. 2006;6:1863–1869. doi: 10.1021/nl060694v. [DOI] [PubMed] [Google Scholar]
- 19.Chattopadhyay PK, Price DA, Harper TF, Betts MR, Yu J, Gostick E, Perfetto SP, Goepfert P, Koup RA, de Rosa SC, Bruchez MP, Roederer M. Quantum dot semiconductor nanocrystals for immunophenotyping by polychromatic flow cytometry. Nat Med. 2006;12:972–977. doi: 10.1038/nm1371. [DOI] [PubMed] [Google Scholar]
- 20.Wlodkowic D, Skommer J, Pelkonen J. Brefeldin A triggers apoptosis associated with mitochondrial breach and enhances HA14-1- and anti-Fas-mediated cell killing in follicular lymphoma cells. Leuk Res. 2007;31:1687–1700. doi: 10.1016/j.leukres.2007.03.008. [DOI] [PubMed] [Google Scholar]


