

Abstract
Low density lipoprotein (LDL) plays a critical role in cholesterol transport and is closely linked to the progression of several diseases. This motivates the development of methods to study LDL behavior from the microscopic to whole-body level. We have developed an approach to efficiently load LDL with a range of diagnostically active nanocrystals or hydrophobic agents. We performed focused experiments on LDL labeled with gold nanocrystals (Au-LDL). The labeling procedure had minimal effect on LDL size, morphology or composition. Biological function was found to be maintained from both in vitro and in vivo experiments. Tumor bearing mice were injected intravenously with LDL, DiR-LDL, Au-LDL or a gold-loaded nanoemulsion. LDL accumulation in the tumors was detected with whole body imaging methods, such as computed tomography (CT), spectral CT and fluorescence imaging. Cellular localization was studied with transmission electron microscopy (TEM) and fluorescence techniques. In conclusion, this LDL labeling procedure should permit the study of lipoprotein biointeractions in unprecedented detail.
Keywords: low density lipoprotein, gold nanoparticles, electron microscopy, computed tomography, fluorescence imaging
Low density lipoprotein (LDL) plays an important role in the transport of cholesterol to peripheral tissues,1 which is crucial for the maintenance of cell membranes.2 LDL consists of a hydrophobic core containing cholesteryl esters, which is covered by a phospholipid monolayer and is 20–25 nm in diameter.1, 3, 4 One apolipoprotein (ApoB100) per LDL nanoparticle is embedded into the phospholipid monolayer, covering about half of its surface. ApoB100 is insoluble, non exchangeable and is recognized by the LDL receptor (LDLr).3 LDL is a key contributor to a variety of pathological processes. The accumulation of oxidized LDL in the arterial wall and the consequent induction of inflammation is a main factor in the formation of early atherosclerotic lesions, which can progress into vulnerable plaques that may rupture and cause detrimental events such as myocardial infarctions or strokes.5–7 In addition to cardiovascular diseases, LDL also has a role in the progression of certain tumors as a result of the high demand for cholesterol in tumorigenesis.4 These important roles of LDL motivate its study and imaging of its biointeractions, in particular.
To facilitate imaging, the core of LDL can been substituted with hydrophobic small molecules by Krieger’s method,8 which allows the inclusion of fluorophores,9 small molecules,10 and triglycerides.11 Despite their high diagnostic and therapeutic potential,12 to the best of our knowledge, robust methods to load nanocrystals in the core of LDL have not been reported. This is due to the difficulty of reconstituting LDL, as ApoB100 is insoluble and non-exchangeable.3
Gold nanoparticles have been used as therapeutics to enhance radiotherapy,13 for targeted drug delivery14 and for photothermal ablation.15 Gold nanoparticles have also a major role in imaging, and are used as contrast agents in sub-cellular TEM,16, 17 fluorescence imaging,18 photoacoustics,19 surface enhanced Raman spectroscopy (SERS),20, 21 CT22, 23 and most recently, spectral CT, a novel multicolor CT technique.24 Hence the ability to load LDL with gold nanoparticles would allow LDL to be tracked using various imaging modalities or act as a platform to deliver therapeutically active gold nanocrystals to diseased tissue.
In this study, we report a novel method to label human LDL with a variety of diagnostically active nanocrystals as well as amphiphilic or hydrophobic fluorophores (Figure 1). The method relies on encapsulation of the aforementioned compounds in micelles and their subsequent translocation into the LDL core using sonication and ultracentrifugation procedures. We studied gold loaded LDL (Au-LDL) in depth, determining from analytical, in vitro and in vivo experiments that its properties are similar to that of native LDL. We will show how these gold labeled LDL nanoparticles can be tracked and exploited for the visualization of lipoprotein biointeractions in vitro and in a tumor mouse model.
Figure 1. Labeling schematic of low density lipoprotein.

Dodecanethiol coated gold nanocrystals were mixed with phospholipids and Cy5.5 lipids in CHCL3. a, This solution was dripped into >70 °C H2O, forming micelles enclosing a gold nanocrystal. b, The phospholipid coated gold nanocrystals were mixed with native LDL in PBS and sonicated yielding three different particles: free phospholipid-coated gold nanocrystals, native LDL, and native LDL with gold nanocrystals in the hydrophobic core. c, This solution was purified on a dual density gradient, resulting in a solution of gold labeled LDL nanoparticles (Au-LDL).
Results and Discussion
Labeling of low density lipoprotein
A novel and simple strategy was used to incorporate gold nanocrystals in the lipid core of LDL. To that end, LDL was isolated from human blood plasma via standard centrifugation procedures.25 Dodecanethiol coated 2–3 nm gold nanoparticles were synthesized by the method of Brust,26 subsequently coated with phospholipids and added to the native LDL solution (Figure 2a and b). Sonication of this solution resulted in labeling of LDL with gold cores (Figure 2c). A density gradient centrifugation method was optimized to purify the sample and remove unincorporated gold (Figure 1). The final product contained LDL of which 77% was labeled with gold (with an average of a 1.5 Au/LDL), as shown in Figure 2d. The incorporation of Cy5.5 or Rhodamine labeled phospholipids into LDL can be achieved by their inclusion in the initial phospholipid coating of the gold nanocrystals.
Figure 2. LDL labeled with different payloads.

Negative stain TEM micrographs of: a, phospholipid-coated gold nanocrystals; b, native human LDL; c, unpurified Au-LDL; d, purified Au-LDL; e, TEM of LDL labeled with 3 nm Au nanocrystals using Krieger’s reconstitution method.8 Most LDL nanoparticles stay unlabeled and their morphology has changed. f, TEM of Au-NE nanoemulsions, the control particle used in the animal experiments. g, TEM of 10 nm IO-LDL. Most LDL stays unlabeled, some cores seem to attach to the side of the LDL, but not enter the core (arrowhead). h, TEM of QD-LDL. QDs are visible in the core of the LDL (arrowheads). i, TEM of BODIPY-LDL. Scale bar is the same for all TEM micrographs. NE = nano emulsion, IO = iron oxide, QD = quantum dot.
This new labeling method was compared with the method of Krieger,8 which has been used to substitute the core of LDL with hydrophobic small molecules, such as photosensitizers.9 We found the sonication method for labeling LDL with gold nanocores to be markedly more efficient than the Krieger method, and better preserved LDL’s morphology (Figure 2e). Gold containing nanoemulsions (Au-NE) (Figure 2f) were synthesized using a method we described previously27 and used as control particles with a similar morphology and diameter as Au-LDL, but without apolipoprotein ApoB100.
To investigate the broader applicability of this labeling method, we performed test experiments with iron oxide nanocores (10 nm), quantum dots (7.5 nm, Figure S1) and the hydrophobic fluorophores BODIPY and DiR, of which the latter two acted as model drugs. Each of these compounds was encapsulated in phospholipid micelles and sonicated with LDL to form IO-LDL, QD-LDL, BODIPY-LDL and DiR-LDL, respectively. BODIPY-LDL and DiR-LDL were re-purified via Havel’s centrifugation method25 to isolate them from any unincorporated label. TEM of these formulations (Figure 2g–i) indicated that the general morphology of LDL was maintained. LDL was found to be labeled with both iron oxides and quantum dots, however in the case of iron oxides, the nanocores were not homogenously merged into the LDL core. This difference in labeling is likely related to the differing ligands of the iron oxide (oleic acid) as compared to the gold nanocrystals and quantum dots (dodecanethiol), although potentially it could be due to the larger size of the iron oxides.
Characterization of labeled LDL
TEM showed that Au-LDL has the same morphology and size as native human LDL (Figure 2b–d, Figure 3a), indicating little effect of sonication on these parameters. Au-LDL typically was loaded with 8.3 mg Au/mg ApoB100. LDL can be oxidized, which alters its selectivity28 due to chemical changes in ApoB100.29 Importantly, an ELISA assay showed no significant difference in oxidation between LDL and Au-LDL (Figure 3b), indicating that the sonication procedure did not affect the oxidation level. LDL had 3.55 mg protein/mM phosphate while Au-LDL had 2.85 mg protein/mM phosphate as determined by analytical methods. This change is likely due to inclusion of the phospholipids used to coat the gold cores in Au-LDL. Western blots for ApoB100 on LDL and Au-LDL (Figure 3c) showed the same molecular weight of ApoB100, again indicating no change from sonication. All together, these data corroborated that our labeling technique does not affect the physiochemical integrity of the LDL nanoparticle. From phantoms of Au-LDL imaged with CT, we found the attenuation to be linear in the 0 to 200 mM concentration range, with an attenuation rate of 4.3 HU/mM Au at 120 kV (Figure 3d,e).
Figure 3. Characterization of labeled LDL.
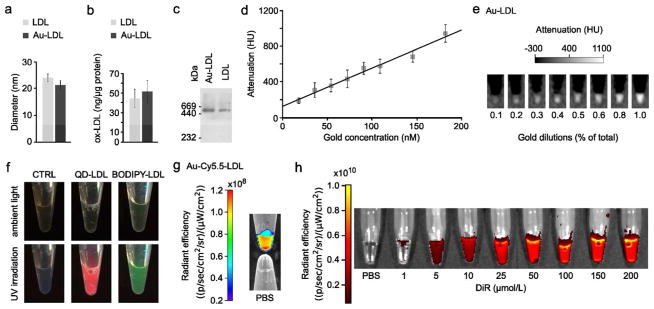
a, Diameters of LDL and Au-LDL derived from TEM. b, ELISA on oxidation of LDL and Au-LDL. c, Western blot of ApoB100 of Au-LDL and LDL. d, Gold concentration – attenuation curve of Au-LDL phantom. e, Phantom of increasing Au-LDL concentrations. f, Photograph of CTRL, QD-LDL, and BODIPY-LDL in ambient light and under UV irradiation. g, Phantom of Au-Cy5.5-LDL compared with control PBS. h, Fluorescence images of DiR-LDL.
QD-LDL and BODIPY-LDL exhibited strong fluorescence under UV irradiation, while Au-Cy5.5-LDL and DiR-LDL were strongly fluorescent when imaged with a fluorescence imaging system, confirming successful labeling and that the process does not deactivate the fluorophores (Figure 3f–h). Due to the hydrophobic nature of the BODIPY and DiR dye molecules, we expect them to be loaded in the core. We chose to perform in depth in vitro and in vivo experiments with Au-LDL, due to its potential for detection with high resolution techniques such as electron microscopy and computed tomography.
Labeled LDL is taken up in a receptor-dependent fashion in vitro
In vitro competition inhibition assays were undertaken in three different cell types known to express the LDLr, i.e. hepatocytes (HepG2),30 macrophages (J774A.1),31 and melanoma cells (B16-F10).30 LDLr upregulation was achieved by incubation in DMEM containing 1% BSA and confirmed by Western blotting (Figure S2). Fluorescence microscopy of these cells incubated with Rhodamine labeled Au-LDL revealed strong nanoparticle uptake, which was reduced when incubations were performed with an excess of LDL (Figure 4a–i). The uptake of Au-LDL could also be measured by CT imaging of pellets of the cells (Figure 4j–l). Furthermore, TEM showed gold uptake in cells incubated with Au-LDL only and reduced uptake in cells incubated with Au-LDL in competition with an excess of native LDL (Figure S3a–i). This reduced uptake of Au-LDL when incubated with native LDL in the competition inhibition assay indicates that the nanoparticles are taken up in a receptor dependent manner, revealing that Au-LDL has preserved biological functionality.
Figure 4. In vitro competition inhibition assay.

Fluorescence microscopy of LDL (control) (a–c), Au-LDL (test) (d–f) and LDL + Au-LDL (inhibition competition) (g–h) in HepG2, J774A.1 and B16-F10 cells. CT of control and Au-LDL in HepG2 (j), J774A.1 (k) and B16-F10 (l) cells. Red fluorescence is Au-LDL, blue fluorescence is DAPI.
Labeled LDL retains its function in vivo
In order to ensure the in vivo biological functionality of Au-LDL, we performed experiments in wild type mice and LDLr knockout (KO) mice. LDL has been established to have an extended blood circulation half-life in LDLr KO compared with wild type mice, as a result of lack of uptake by the LDL receptor.32 We injected Au-LDL into these mice (n=5/group), performed blood draws over 24 hours and measured the gold content of the blood with ICP-MS (Figure 5a). We found the half-life of Au-LDL to be 2 hours in wild type mice and 4 hours in LDLr KO mice, closely matching literature figures of 2 and 5 hours in these animals.32 Next, we examined the biodistribution of Au-LDL in these mice. We found there to be 50% higher liver uptake in the wild type mice as compared to the LDLr KO mice, supporting our findings from pharmacokinetics data (Figure 5b). On a cellular level, the presence of the LDL receptor in wild type mice should lead to substantial uptake in hepatocytes, the main cell type in the liver, whereas the lack of this receptor in LDLr KO mice should result in low hepatocyte uptake and more uptake in Kupffer cells, a minority cell type in the liver. We investigated the liver distribution of Au-LDL using light microscopy of silver-stained sections (silver staining makes accumulations of gold nanoparticles visible in light microscopy) and TEM. In light microscopy, we observed darker, diffuse staining of the liver in wild type mice, whereas we observed punctuate staining in LDLr KO mice (Figure 5c,d). In TEM micrographs, gold cores were found in more vesicles and in greater quantities in hepatocytes in the liver tissue of wild type mice than LDLr KO mice (Figure 5e–h). Thus the cellular distribution of Au-LDL in the liver is consistent with that expected for native LDL. These experiments demonstrate the functionality of Au-LDL in vivo.
Figure 5. In vivo functionality of Au-LDL in wild type and LDLr KO mice.

a, Pharmacokinetics of Au-LDL in mice. b, Biodistribution of Au-LDL in mice at 2 hr post-injection. c,d, Light microscopy of sliver stained sections of mouse livers. Black arrowheads indicate intense areas of silver staining. e–h, TEM of hepatocytes in mouse livers. White arrowheads indicate accumulations of gold nanoparticles. f and h are higher magnification images of the boxed areas in e and g, respectively.
Labeling allows macroscopic imaging of LDL
Mice bearing tumors that over express the LDL receptor were used for in vivo imaging studies (Lewis lung carcinoma or B16F10).30, 33 When the tumors reached an average volume of 4 mm3, mice bearing Lewis lung carcinoma tumors were injected intravenously with DiR-LDL (DiR is a high quantum yield, near-infrared fluorophore, suited for in vivo imaging). 24 h after injection, fluorescence imaging of the mice (Figure 6a) revealed distinct accumulation in the tumors and, when the mice were dissected, in the liver and spleen as well (Figure S4).
Figure 6. In vivo and ex vivo imaging.

a, IVIS of mice, arrowheads indicate the B16-F10 tumor. b, CT of mice, the tumors are circled. c, Tumor attenuation relative to control. Attenuation in the tumors of the Au-LDL mice were higher than in the Au-NE mice (p=0.009). d, FACS of tumor tissue. MACs: macrophages, TCs; tumor cells, ECs: endothelial cells. e, TEM of control tumor tissue, inset shows no gold. f, TEM of Au-LDL tumor tissue, inset shows gold particles in a vesicle. g, TEM of Au-NE tumor tissue, inset shows gold particles in a vesicle.
Mice bearing B16F10 tumors were injected with either Au-LDL or Au-NE and imaged in vivo with CT and, after sacrifice, with spectral CT (Figures 6b,c, 7 and S5). We observed the attenuation in the tumors to be higher for Au-LDL than for Au-NE injected mice (p = 0.009, Figure 6c). Spectral CT showed clear accumulation of gold at the rim of the tumor (Figure 7a and S5a) and accumulation in the liver (Figure 7b and S5b) – which is as expected considering the LDLr expression in these tissues. Significant accumulations of gold in other tissues were not observed.
Figure 7. Spectral CT of Au-LDL injected B16-F10 tumor bearing mice.
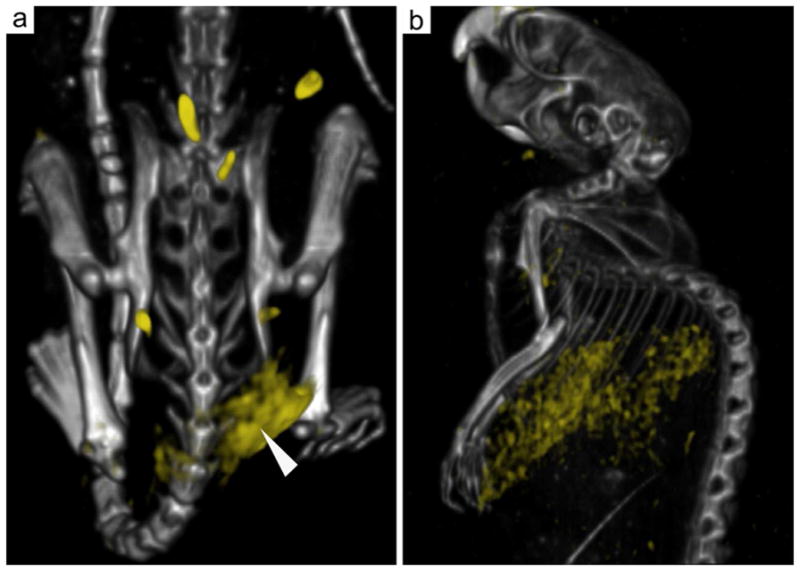
Gold accumulation is displayed in yellow and overlaid on conventional CT images. a, 3D reconstruction of the rear of a mouse injected with Au-LDL. Gold accumulation can be observed in the tumor. b, 3D reconstruction of the front of a mouse with gold accumulation found in the liver.
Cellular and subcellular localization of LDL
FACS analysis of the tumors revealed that the majority of both Au-LDL and Au-NE was taken up by macrophages, while smaller fractions of the nanoparticles were found in endothelial cells and cancer cells (Figure 6d). In TEM micrographs of tumor tissue of control mice, tumor cells with melanosomes, tumor associated macrophages (TAMs), muscle cells and endothelial cells could be identified. In tumor tissue of mice injected with Au-LDL or Au-NE highly electron scattering regions were observed inside lysosomal structures in tumor cells, macrophages and endothelial cells. Such highly electron scattering regions were absent in control tumor tissue and EDX element analysis confirmed that these were gold (Figure S6). Visual inspection indicated that more gold nanospheres were observed in Au-LDL tumor tissue than in Au-NE tumor tissue. 3D reconstructions from electron tomography of tissue showed that tumor vesicles were extensively loaded with gold nanoparticles (Figure S7).
We established a new LDL labeling method based on sonication followed by ultracentrifugation purification. Using this method, we were able to label native human LDL with a variety of payloads and in this study we reported the first gold labeled LDL (Au-LDL) for CT, fluorescence techniques and TEM. This sonication based loading method, compared to the Krieger method,8 proved to be far more effective in terms of labeling efficiency and morphology conservation (Figure 2a–e). We have shown Au-LDL to have similar characteristics to native LDL in terms of size, morphology, composition, oxidation state, ApoB100 function and molecular weight. Au-LDL was taken up in a receptor-like, saturable manner and could be detected by fluorescence based techniques, TEM and CT in a variety of LDLr expressing cell types. Experiments performed in LDLr KO and wild type mice confirmed LDL-like behavior in vivo. In comparison to the currently available labeling methods, our method has the advantage that it can be applied to a variety of nanocrystals, hydrophobic molecules and, we expect, lipoproteins, which makes it of broad relevance.
In the current study, the in vivo application in B16-F10 tumor bearing mice revealed that the gold nanoparticles were mostly associated with TAMs. The uptake of Au-LDL in the TAMs is likely due to both LDLr mediated uptake and non-specific uptake via phagocytosis after the Au-LDL has accumulated in the tumor via the enhanced permeability and retention effect. Recent studies have shown TAMs to be an interesting therapeutic target, as their number is inversely correlated with patient survival.34 For example, Edris et al. showed that treatment with antibodies against CD47, a factor signaling between tumor cells and macrophages, resulted in a decrease in the size and the number of metastases.35 To be able to detect TAMs by CT imaging may allow monitoring of early responses to anti-TAM therapy in a quantitative fashion and may also allow predictions of therapeutic outcome.
We have clearly demonstrated that labeling LDL with gold cores enables detection with CT, TEM and fluorescence based techniques, permitting LDL localization from the whole body level to the sub-cellular level. Others have previously labeled LDL with radionuclides for imaging with nuclear based methods.36–38 In addition, LDL has been labeled with fluorophores for fluorescence imaging and gadolinium chelates for MRI (2, 10, 49, 59).1, 30, 39, 40 Such imaging methods are more sensitive than CT, but nuclear imaging has poor resolution and cellular localization of injected LDL is difficult with the labels used for either nuclear imaging or MRI. The use of spectral CT, as we showed here, allows detection of Au-LDL accumulation in a ‘hot-spot’ fashion, without the need for comparison of pre- and post-injection images as for MRI. This work is notable also, as Au-LDL represents one of only a few reports of targeted CT contrast agents. Potentially, Au-LDL could be ‘retargeted’ to other receptors or cell types by attaching additional targeting ligands to the apoB100 component, as has been reported by Zheng et al.40
LDL has been proposed as a drug delivery vehicle. For example, Firestone et al. loaded LDL with cytotoxic cholesterol oleate appended nitrogen mustards and observed specific uptake of the nanoparticles as well as complete cell death in vitro.41 The method used in the current study, i.e. co-sonication of LDL with gold nanocores coated with phospholipids, could also be applied to load LDL with hydrophobic drugs, as our experiments with BODIPY and DiR indicate. As we have shown, iron oxides, quantum dots, hydrophobic fluorophores or drug could also be included to create a multifunctional or ‘theranostic’ platform.42
Conclusions
In this study we established a novel sonication method for core labeling native LDL particles with 2–3 nm gold nanocrystals, which is far more efficient than the well-established Krieger method. Furthermore, this sonication based labeling method of LDL could be applied to incorporate iron oxide nanocores, QDs, and hydrophobic drugs, allowing LDL to be studied with MRI and optical imaging as well as be used as a nanosized drug delivery system. Native LDL loaded with gold nanocrystals has a comparable composition and morphology to untreated LDL, and, importantly, has no change in oxidation level. Gold labeling permitted detection of LDL on the sub-cellular (TEM), cellular (fluorescence), and anatomical level (CT and spectral CT). Au-LDL was taken up by macrophages, hepatocytes and a melanoma cell line in vitro in a receptor dependent manner as determined by the afore-mentioned techniques. Au-LDL has different pharmacokinetics, liver uptake and liver cellular distribution in wild type compared to LDLr KO mice, indicating that it has LDL-like functionality in vivo. Furthermore, investigations in tumor bearing mice with Au-LDL enabled study of LDL uptake by tumors by both conventional and spectral CT, in vivo fluorescence imaging and ex vivo microscopy methods. Therefore, Au-LDL can likely be used as a marker to study LDL interactions, cholesterol metabolism, atherosclerotic plaque formation and tumor growth with the imaging techniques used herein and others such as photoacoustics, as well as be used to deliver gold nanomaterials for therapeutic purposes.
Materials and methods
For detailed materials and methods, please see the supplementary information.
Synthesis
Au-Cy5.5-MHPC nanoparticle synthesis
MHPC coated gold nanocores were synthesized in a similar method to that described previously by Cormode et al.43 Typically, 100 mg MHPC dissolved in 10 mL 20:1 CHCl3:CH3OH, 100 mg dodecanethiol coated gold nanocores (synthesized via the Brust method26) dissolved in 5 mL CHCl3, and 1 mg Cy5.5-DMPE in CHCl3 were mixed and dripped into 10 mL >70 °C diH2O at 60 μL/min speed. The resulting solution was concentrated to 7.2 mL and purified by centrifuging 200 μL on 1 ml of 1.25 mg/mL KBr per vial at 14,500 rpm for 1 h using an Eppendorf Minispin Plus. Afterwards the top 250 μL was taken off and discarded, the remaining solution was collected, washed once with PBS using a 10,000 MWCO tube, and concentrated to 4.8 mL. The 1.25 g/mL gradient spin at 14,500 rpm was repeated and again the top 250 μL was taken off and the remaining solution collected. The solution was washed twice with PBS and concentrated to 500 μL. The Au concentration was determined using CT imaging and Au-Cy5.5-MHPC was stored in the dark at 4 °C.
LDL labeling with Au-Cy5.5-MPHC
1.7 mg of native human LDL (by protein content) in PBS was mixed with Au-Cy5.5-MHPC in PBS, containing 4.74 mg gold. PBS was added to make a total volume of 2 mL and the solution was sonicated in a water bath for 5 min. Unlabeled LDL particles and Au-Cy5.5-MHPC aggregates were removed via centrifugation on a dual (700 μL 1.06 mg/mL on top of 300 μL 1.35 mg/mL) KBr density gradient. 200 μL of the sonicated sample was pipetted on top of the KBr gradient and spun for 6 h at 10,000 rpm in an Eppendorf Minispin Plus. Subsequently, the top ~400 μL light pink layer (containing unlabeled LDL and other lipid residues) was removed and discarded, the next ~700 μL was collected, leaving the pellet (containing Au-Cy5.5-MHPC aggregates) undisturbed. Au-Cy5.5-LDL (Au-LDL) was washed twice with PBS using 10,000 MWCO tubes, concentrated to 100 μL, and stored at 4 °C. This procedure was performed repeatedly and the batches combined.
LDL labeling using core reconstitution
LDL was also labeled using the well known Krieger method8 as a comparison. To this end, 500 TL native human LDL in diH2O and 25 mg starch (Sigma-Aldrich), for LDL stability, were frozen with a combination of ethanol and dry ice and subsequently lyophilized. The core of LDL was not extracted; instead 6 mg Au-MHPC in 200 μL heptane was added to enter the core. The mixture was placed in the freezer for 10 min and dried with N2 gas. Dried samples were kept on ice and resuspended in 1 mL 10 mM tricine (pH 4) and left for 20 h at 4 °C to release the LDL from the starch. Samples were then centrifuged at 2000 rpm for 10 min in a 5810R Eppendorf Centrifuge followed by 10000 rpm. Success of labeling was measured using negative stain TEM (see ‘Characterization’ section).
LDL labeling with QD-MHPC
The preparation of the quantum dots (QDs) used has been previously reported.44 Their optical properties are displayed in Figure S1. Their capping ligands were exchanged by incubation with an excess of dodecanethiol in CHCl3 for 72 h and subsequent isolation by precipitation with CH3CH2OH, centrifugation and repeated washing. 2.5 nmol of these QDs were dissolved in 5 mL of a 9:1 CHCl3:CH3OH solvent mixture that contained 12 mg of MHPC. This solution was dripped into >70 °C diH2O to form QD-MHPC and purified as per the methods used for Au-MHPC. The volume of the solution was adjusted to 900 μL and 225 μL was mixed with 0.8 mg of LDL (by protein content). The volume was increased to 1 mL with PBS and the solution was sonicated for 5 minutes.
LDL labeling with BODIPY or DiR
The hydrophobic fluorophores BODIPY (4,4-Difluoro-1,3,5,7-Tetramethyl-4-Bora-3a,4a-Diaza-s-Indacene (BODIPY® 505/515)) and DiR (1,1′-Dioctadecyl-3,3,3′,3′-Tetramethylindotricarbocyanine Iodide) were purchased from Invitrogen. In the case of BODIPY, 5 mg was dissolved in 10 mL of a 9:1 CHCl3:CH3OH solvent mixture that contained 100 mg of MHPC. This solution was dripped into >70 °C diH2O to form BODIPY-MHPC. Unincorporated BODIPY fluorophore was removed by centrifugation at 4000 rpm for 5 min using a 5810R Eppendorf Centrifuge. 160 μL of BODIPY-MHPC was mixed with 17 mg of LDL (by protein content) and the volume was increased to 20 mL with PBS. This solution was sonicated for ten minutes and was then purified by repeating the LDL isolation process (see above), to exclude any BODIPY unincorporated into LDL. In the case of DiR, the same procedure was used except 25 mg of MHPC was used and 338 μL of the resulting solution was sonicated with LDL.
Nanoemulsion synthesis
Control nanoemulsions (Au-NE) with a similar size and composition to the LDL nanoparticles, but lacking the ApoB100 lipoprotein were prepared by first incubating 18 mg of dodecanethiol coated gold cores in CHCl3 with cis-9-octadene-1-thiol for 10 min for ligand exchange. Next, 12 mg DSPE-PEG, 5.6 mg DSPC, 1.16 mg cholesterol, 20 mg soybean oil, and 0.176 mg Cy5.5 in CHCl3 were mixed and the Au was added to this solution. A lipid film was made and subsequently hydrated with 5 mL 65 °C PBS. The solution was tip sonicated for 15 min and concentrated to 500 μL using 10,000 MWCO tubes.
Characterization
Nanoparticle size and morphology were determined by negative stain TEM,45 the ApoB100 concentration by a modified Lowry assay,46 the gold concentration was determined by CT, and the phosphorous content with Rouser’s phosphorus assay.47 Oxidation of LDL was tested with ELISA and Western blotting was performed for ApoB100.
In vitro experiments
HepG2 hepatocytes, J774A.1 macrophages, and B16-F10 melanoma cells were cultured as per the supplier’s instructions. Prior to Au-LDL uptake experiments, the cells were passaged into 6 wells plates and washed with 1% BSA DMEM medium (no FBS) and incubated with this pre-incubation medium for 20 h to upregulate LDLr,9 as confirmed by Western blotting. Cells were incubated with LDL (control), Au-LDL (test) or Au-LDL and a five fold excess of LDL (competition inhibition). The concentrations used for in vitro experiments depended on the sensitivity of the imaging equipment used. For TEM, LDL with a concentration of 100 μg ApoB100/mL was used, for fluorescence 20 μg ApoB100/mL and for CT 500 μg ApoB100/mL. Cells were washed and harvested as pellets for either TEM or CT analysis. For fluorescence microscopy the same was performed with cells grown on glass cover slips and mounted on slides with DAPI-containing mounting medium.
Animal experiments
All experiments were approved by the Institutional Animal Care and Use Committee. To investigate Au-LDL functionality in vivo we used wild type C57BL/6 mice and LDLr KO mice from the same background (Jackson Laboratories). For pharmacokinetics, Au-LDL was injected into the mice via the tail vein (n=5/group, 12 mg Au/kg) and blood drawn via retro-orbital bleeds at 5 min, 30 min, 1 h, 2 h, 4 h and 24 h. For biodistribution, Au-LDL was injected into the mice via the tail vein (n=5/group, 12 mg Au/kg). The mice were sacrificed, perfused with PBS and dissected. Small pieces of the livers were retained for microscopy analysis. The gold content of the blood samples and organs was determined via ICP-MS performed by the Pennsylvania Animal Diagnostic Laboratory System, Kennett Square, PA. 1 mm cubes of liver were fixed in 2.5 % glutaraldehyde and prepared for TEM analysis by the normal methods.48 3 mm cubes of liver were embedded in paraffin, sectioned and stained using a Silver Enhancer Kit (Sigma Aldrich) according to the manufacturers instructions.
For fluorescence imaging, four 7 week old female NCR/NU mice were injected in the right flank with 100 μL DMEM containing 2 million Lewis Lung Cancer cells. On day seven mice were injected with DiR-LDL (n=3) or PBS (n=1). Fluorescence in the mice was measured using a Xenogen IVIS Spectrum (Alameda, CA) at 24 h post-injection. Tissue was excited at 745 nm and the emission spectra recorded from 820 nm. The mice were subsequently sacrificed, perfused and their excised organs imaged under the same conditions.
For CT imaging experiments, eleven 7 week old female NCR/NU mice were injected in the right flank with 100 μL DMEM containing 1 million B16-F10 cells. On day seven, tumors reached the size of 4 mm3, and the mice were divided into four groups by tumor size, and subsequently randomly divided into control (n=4), Au-LDL (n=4), and Au-NE (n=3) groups. The nanoparticles were injected in the tail vein at 250 mg Au/kg doses 24 h before imaging and sacrifice. Mice were scanned by CT (120 kV, 256-slice clinical scanner), imaging the distribution of the nanoparticles in the mice. Of each group, two mice were anesthetized with isoflurane and sacrificed using heart perfusion and tumors were removed. The remaining mice were sacrificed using CO2, snap-frozen with liquid N2 and were subsequently scanned with spectral CT (a custom built device, Philips Research Europe, Hamburg.49 This scanner uses photon-counting detectors that analyze the energy of the incident X-rays to identify the materials in the field of view. In this case, it was used to identify the gold distribution in the mice.
Ex vivo experiments
Excised tumor tissue was used for FACS and TEM. FACS analysis was performed against tumor cells (SSC anti CD31), endothelial cells (CD31+CD11b− Gr-1−), and macrophages (CD11b+ Gr-1+). TEM was used to localize the gold in the cells and study the distribution, EDX to confirm the nature of the gold nanoparticles and ET to confirm that the gold particles were inside vesicles in the cells.
Supplementary Material
Acknowledgments
This work was supported by the National Heart, Lung, and Blood Institute, National Institutes of Health, as a Program of Excellence in Nanotechnology (PEN) Award, Contract #HHSN268201000045C, the NIH grants R00 EB012165 (D.P.C.), R01 EB009638 (Z.A.F.), and R01 CA155432 (W.J.M.M.), the Dutch Heart Foundation (I.E.A.), the Dutch Society for Microscopy (I.E.A.), and the Master Mobility Scholarship (I.E.A.). Furthermore we thank S.-H. Chen of Mount Sinai School of Medicine for her input on the FACS analysis and S. Lund-Katz for the gift of a sample of LDL.
Footnotes
The supporting information contains data on the optical properties of the quantum dots used. Western blotting of LDL receptor expression in the cell lines used is shown, as is TEM of Au-LDL uptake in these cells. Fluorescence images of the organs of DiR-LDL injected mice and transverse spectral CT images of Au-LDL injected mice are provided. Detailed methods are given for various experiments. This information is available free of charge via the Internet at http://pubs.acs.org/.
References
- 1.Corbin IR, Li H, Chen J, Lund-Katz S, Zhou R, Glickson JD, Zheng G. Low-Density Lipoprotein Nanoparticles as Magnetic Resonance Imaging Contrast Agents. Neoplasia. 2006;8:488–498. doi: 10.1593/neo.05835. [DOI] [PMC free article] [PubMed] [Google Scholar]
- 2.Brown M, Goldstein J. Receptor-Mediated Endocytosis: Insights from the Lipoprotein Receptor System. Proc Natl Acad Sci USA. 1979;76:3330–3337. doi: 10.1073/pnas.76.7.3330. [DOI] [PMC free article] [PubMed] [Google Scholar]
- 3.Segrest J, Jones M, De Loof H, Dashti N. Structure of Apolipoprotein B-100 in Low Density Lipoproteins. J Lipid Res. 2001;42:1346–1367. [PubMed] [Google Scholar]
- 4.Firestone RA. Low-Density Lipoprotein as a Vehicle for Targeting Antitumor Compounds to Cancer Cells. Bioconjugate Chem. 1994;5:105–113. doi: 10.1021/bc00026a002. [DOI] [PubMed] [Google Scholar]
- 5.Berliner J, Heinecke J. The Role of Oxidized Lipoproteins in Atherogenesis. Free Radic Biol Med. 1996;20:707–727. doi: 10.1016/0891-5849(95)02173-6. [DOI] [PubMed] [Google Scholar]
- 6.Libby P, Aikawa M, Schönbeck U. Cholesterol and Atherosclerosis. Biochim Biophys Acta. 2000;1529:299–309. doi: 10.1016/s1388-1981(00)00161-x. [DOI] [PubMed] [Google Scholar]
- 7.Packard R, Libby P. Inflammation in Atherosclerosis: From Vascular Biology to Biomarker Discovery and Risk Prediction. Clin Chem. 2008;54:24–38. doi: 10.1373/clinchem.2007.097360. [DOI] [PubMed] [Google Scholar]
- 8.Krieger M. Reconstitution of the Hydrophobic Core of Low-Density Lipoprotein. Meth Enzymol. 1986;128:608–13. doi: 10.1016/0076-6879(86)28094-5. [DOI] [PubMed] [Google Scholar]
- 9.Zheng G, Li H, Zhang M, Lund-Katz S, Chance B, Glickson JD. Low-Density Lipoprotein Reconstituted by Pyropheophorbide Cholesteryl Oleate as Target-Specific Photosensitizer. Bioconjugate Chem. 2002;13:392–396. doi: 10.1021/bc025516h. [DOI] [PubMed] [Google Scholar]
- 10.Song L, Li H, Sunar U, Chen J, Corbin I, Yodh A, Zheng G. Naphthalocyanine-Reconstituted Ldl Nanoparticles for in Vivo Cancer Imaging and Treatment. Int J Nanomedicine. 2007;2:767–774. [PMC free article] [PubMed] [Google Scholar]
- 11.Hill ML, Corbin IR, Levitin RB, Cao W, Mainprize JG, Yaffe MJ, Zheng G. In Vitro Assessment of Poly-Iodinated Triglyceride Reconstituted Low-Density Lipoprotein: Initial Steps toward Ct Molecular Imaging. Acad Radiol. 2010;17:1359–1365. doi: 10.1016/j.acra.2010.06.006. [DOI] [PubMed] [Google Scholar]
- 12.Mieszawska AJM, Willem JM, Fayad, Zahi A, Cormode, David P. Multifunctional Gold Nanoparticles for Diagnosis and Therapy of Disease. Mol Pharmaceutics. 2013;10:831–847. doi: 10.1021/mp3005885. [DOI] [PMC free article] [PubMed] [Google Scholar]
- 13.Hainfeld JF, Slatkin DN, Smilowitz HM. The Use of Gold Nanoparticles to Enhance Radiotherapy in Mice. Phys Med Biol. 2004;49:N309–N315. doi: 10.1088/0031-9155/49/18/n03. [DOI] [PubMed] [Google Scholar]
- 14.Libutti SK, Paciotti GF, Byrnes AA, Alexander HR, Gannon WE, Walker M, Seidel GD, Yuldasheva N, Tamarkin L. Phase I and Pharmacokinetic Studies of Cyt-6091, a Novel Pegylated Colloidal Gold-Rhtnf Nanomedicine. Clin Cancer Res. 2010;16:6139–6149. doi: 10.1158/1078-0432.CCR-10-0978. [DOI] [PMC free article] [PubMed] [Google Scholar]
- 15.von Maltzahn G, Park JH, Agrawal A, Bandaru NK, Das SK, Sailor MJ, Bhatia SN. Computationally Guided Photothermal Tumor Therapy Using Long-Circulating Gold Nanorod Antennas. Cancer Res. 2009;69:3892–3900. doi: 10.1158/0008-5472.CAN-08-4242. [DOI] [PMC free article] [PubMed] [Google Scholar]
- 16.Oyasu M, Fujimiya M, Kashiwagi K, Ohmori S, Imaeda H, Saito N. Immunogold Electron Microscopic Demonstration of Distinct Submembranous Localization of the Activated Pkc Depending on the Stimulation. J Histochem Cytochem. 2007;56:253–265. doi: 10.1369/jhc.7A7291.2007. [DOI] [PMC free article] [PubMed] [Google Scholar]
- 17.Bos E, SantAnna C, Gnaegi H, Pinto R, Ravelli R, Koster A, de Souza W, Peters P. A New Approach to Improve the Quality of Ultrathin Cryo-Sections; Its Use for Immunogold Em and Correlative Electron Cryo-Tomography. J Struct Biol. 2011;175:62–72. doi: 10.1016/j.jsb.2011.03.022. [DOI] [PubMed] [Google Scholar]
- 18.Durr NJ, Larson T, Smith DK, Korgel BA, Sokolov K, Ben-Yakar A. Two-Photon Luminescence Imaging of Cancer Cells Using Molecularly Targeted Gold Nanorods. Nano Lett. 2007;7:941–945. doi: 10.1021/nl062962v. [DOI] [PMC free article] [PubMed] [Google Scholar]
- 19.Kircher MF, de la Zerda A, Jokerst JV, Zavaleta CL, Kempen PJ, Mittra E, Pitter K, Huang R, Campos C, Habte F, et al. A Brain Tumor Molecular Imaging Strategy Using a New Triple-Modality Mri-Photoacoustic-Raman Nanoparticle. Nat Med. 2012;18:829–34. doi: 10.1038/nm.2721. [DOI] [PMC free article] [PubMed] [Google Scholar]
- 20.Huang X, El-Sayed I, Qian W, El-Sayed M. Cancer Cells Assemble and Align Gold Nanorods Conjugated to Antibodies to Produce Highly Enhanced, Sharp, and Polarized Surface Raman Spectra: A Potential Cancer Diagnostic Marker. Nano Lett. 2007;7:1591–1597. doi: 10.1021/nl070472c. [DOI] [PubMed] [Google Scholar]
- 21.Keren S, Zavaleta C, Cheng Z, de la Zerda A, Gheysens O, Gambhir SS. Noninvasive Molecular Imaging of Small Living Subjects Using Raman Spectroscopy. Proc Natl Acad Sci USA. 2008;105:5844–5849. doi: 10.1073/pnas.0710575105. [DOI] [PMC free article] [PubMed] [Google Scholar]
- 22.Hainfeld JF, Slatkin DN, Focella TM, Smilowitz HM. Gold Nanoparticles: A New X-Ray Contrast Agent. Brit J Radiol. 2006;79:248–253. doi: 10.1259/bjr/13169882. [DOI] [PubMed] [Google Scholar]
- 23.van Schooneveld MM, Cormode DP, Koole R, van Wijngaarden JT, Calcagno C, Skajaa T, Hilhorst J, Hart DC, Fayad ZA, Mulder WJM, et al. A Fluorescent, Paramagnetic and Pegylated Gold/Silica Nanoparticle for Mri, Ct and Fluorescence Imaging. Contrast Media Mol Imaging. 2010;5:231–236. doi: 10.1002/cmmi.376. [DOI] [PMC free article] [PubMed] [Google Scholar]
- 24.Cormode DP, Roessl E, Thran A, Skajaa T, Gordon RE, Schlomka JP, Fuster V, Fisher EA, Mulder WJM, Proksa R, et al. Atherosclerotic Plaque Composition: Analysis with Multicolor Ct and Targeted Gold Nanoparticles. Radiology. 2010;256:774–782. doi: 10.1148/radiol.10092473. [DOI] [PMC free article] [PubMed] [Google Scholar]
- 25.Havel RJ, Eder HA, Bragdon JH. The Distribution and Chemical Composition of Ultracentrifugally Separated Lipoproteins in Human Serum. J Clin Invest. 1955;34:1345–1353. doi: 10.1172/JCI103182. [DOI] [PMC free article] [PubMed] [Google Scholar]
- 26.Brust M, Walker M, Bethell D, Schiffrin DJ, Whyman R. Synthesis of Thiol-Derivatised Gold Nanoparticles in a Two-Phase Liquid–Liquid System. Chem Commun. 1994:801–802. [Google Scholar]
- 27.Jarzyna PA, Skajaa T, Gianella A, Cormode DP, Samber DD, Dickson SD, Chen W, Griffioen AW, Fayad ZA, Mulder WJM. Iron Oxide Core Oil-in-Water Emulsions as a Multifunctional Nanoparticle Platform for Tumor Targeting and Imaging. Biomaterials. 2009;30:6947–6954. doi: 10.1016/j.biomaterials.2009.09.004. [DOI] [PMC free article] [PubMed] [Google Scholar]
- 28.Lougheed M, Steinbrecher U. Mechanism of Uptake of Copper-Oxidized Low Density Lipoprotein in Macrophages Is Dependent on Its Extent of Oxidation. J Biol Chem. 1996;271:11798–11805. doi: 10.1074/jbc.271.20.11798. [DOI] [PubMed] [Google Scholar]
- 29.Lund-Katz S, Laplaud P, Phillips M, Chapman M. Apolipoprotein B-100 Conformation and Particle Surface Charge in Human Ldl Subspecies: Implication for Ldl Receptor Interaction. Biochemistry. 1998;37:12867–12874. doi: 10.1021/bi980828m. [DOI] [PubMed] [Google Scholar]
- 30.Geninatti Crich S, Lanzardo S, Alberti D, Belfiore S, Ciampa A, Giovenzana GB, Lovazzano C, Pagliarin R, Aime S. Magnetic Resonance Imaging Detection of Tumor Cells by Targeting Low-Density Lipoprotein Receptors with Gd-Loaded Low-Density Lipoprotein Particles. Neoplasia. 2007;9:1046–1056. doi: 10.1593/neo.07682. [DOI] [PMC free article] [PubMed] [Google Scholar]
- 31.Rowe A. Enhanced Synthesis of the Oxysterol 24(S),25-Epoxycholesterol in Macrophages by Inhibitors of 2,3-Oxidosqualene: Lanosterol Cyclase: A Novel Mechanism for the Attenuation of Foam Cell Formation. Circ Res. 2003;93:717–725. doi: 10.1161/01.RES.0000097606.43659.F4. [DOI] [PubMed] [Google Scholar]
- 32.Ishibashi S, Brown MS, Goldstein JL, Gerard RD, Hammer RE, Herz J. Hypercholesterolemia in Low-Density-Lipoprotein Receptor Knockout Mice and Its Reversal by Adenovirus-Mediated Gene Delivery. J Clin Invest. 1993;92:883–893. doi: 10.1172/JCI116663. [DOI] [PMC free article] [PubMed] [Google Scholar]
- 33.Versluis A, van Geel P, Oppelaar H, van Berkel T, Bijsterbosch M. Receptor-Mediated Uptake of Low-Density Lipoprotein by B16 Melanoma Cells in Vitro and in Vivo in Mice. Brit J Cancer. 1996;74:525–532. doi: 10.1038/bjc.1996.396. [DOI] [PMC free article] [PubMed] [Google Scholar]
- 34.Steidl C, Lee T, Shah SP, Farinha P, Han G, Nayar T, Delaney A, Jones SJ, Iqbal J, Weisenburger DD, et al. Tumor-Associated Macrophages and Survival in Classic Hodgkin’s Lymphoma. New Engl J Med. 2010;362:875–885. doi: 10.1056/NEJMoa0905680. [DOI] [PMC free article] [PubMed] [Google Scholar]
- 35.Edris B, Weiskopf K, Volkmer AK, Volkmer JP, Willingham SB, Contreras-Trujillo H, Liu J, Majeti R, West RB, Fletcher JA, et al. Antibody Therapy Targeting the Cd47 Protein Is Effective in a Model of Aggressive Metastatic Leiomyosarcoma. Proc Natl Acadm Sci USA. 2012;109:6656–6661. doi: 10.1073/pnas.1121629109. [DOI] [PMC free article] [PubMed] [Google Scholar]
- 36.Ginsberg HN, Goldsmith SJ, Vallabajosula S. Noninvasive Imaging of 99mtechnetium-Labeled Low Density Lipoprotein Uptake by Tendon Xanthomas in Hypercholesterolemic Patients. Arteriosclerosis. 1990;10:256–262. doi: 10.1161/01.atv.10.2.256. [DOI] [PubMed] [Google Scholar]
- 37.Sinzinger H, Bergmann H, Kaliman J, Angelberger P. Imaging of Human Atherosclerosis Lesions Using I-123 Low-Density-Lipoprotein. Eur J Nucl Med. 1986;12:291–292. doi: 10.1007/BF00251990. [DOI] [PubMed] [Google Scholar]
- 38.Shaish A, Keren G, Chouraqui P, Levkovitz H, Harats D. Imaging of Aortic Atherosclerotic Lesions by 125i-Ldl, 125i-Oxidized-Ldl, 125i-Hdl and 125i-Bsa. Pathobiology. 2001;69:225–229. doi: 10.1159/000055947. [DOI] [PubMed] [Google Scholar]
- 39.Chen J, Corbin IR, Li H, Cao W, Glickson JD, Zheng G. Ligand Conjugated Low-Density Lipoprotein Nanoparticles for Enhanced Optical Cancer Imagingin Vivo. J Am Chem Soc. 2007;129:5798–5799. doi: 10.1021/ja069336k. [DOI] [PubMed] [Google Scholar]
- 40.Zheng G, Chen J, Li H, Glickson JD. Rerouting Lipoprotein Nanoparticles to Selected Alternate Receptors for the Targeted Delivery of Cancer Diagnostic and Therapeutic Agents. Proc Natl Acad Sci USA. 2005;102:17757–17762. doi: 10.1073/pnas.0508677102. [DOI] [PMC free article] [PubMed] [Google Scholar]
- 41.Firestone RA, Pisano JM, Falck JR, McPhaul MM, Krieger M. Selective Delivery of Cytotoxic Compounds to Cells by the Ldl Pathway. J Med Chem. 1984;27:1037–1043. doi: 10.1021/jm00374a017. [DOI] [PubMed] [Google Scholar]
- 42.Sun D. Nanotheranostics: Integration of Imaging and Targeted Drug Delivery. Mol Pharmaceutics. 2010;7:1879–1879. doi: 10.1021/mp1003652. [DOI] [PubMed] [Google Scholar]
- 43.Cormode DP, Skajaa T, van Schooneveld MM, Koole R, Jarzyna P, Lobatto ME, Calcagno C, Barazza A, Gordon RE, Zanzonico P, et al. Nanocrystal Core High-Density Lipoproteins: A Multimodal Molecular Imaging Contrast Agent Platform. Nano Lett. 2008;8:3715–3723. doi: 10.1021/nl801958b. [DOI] [PMC free article] [PubMed] [Google Scholar]
- 44.Mieszawska AJ, Gianella A, Cormode DP, Zhao Y, Meijerink A, Langer R, Farokhzad OC, Fayad ZA, Mulder WJM. Engineering of Lipid-Coated PLGA Nanoparticles with a Tunable Payload of Diagnostically Active Nanocrystals for Medical Imaging. Chem Commun. 2012;48:5835–7. doi: 10.1039/c2cc32149a. [DOI] [PMC free article] [PubMed] [Google Scholar]
- 45.Forte TM, Nordhausen RW. Electron Microscopy of Negatively Stained Lipoproteins. Method Enzymol. 1986;128:442–457. doi: 10.1016/0076-6879(86)28086-6. [DOI] [PubMed] [Google Scholar]
- 46.Markwell MK, Haas SM, Bieber LL, Tolbert NE. A Modification of the Lowry Procedure to Simplify Protein Determination in Membrane and Lipoprotein Samples. Anal Biochem. 1978;87:206–210. doi: 10.1016/0003-2697(78)90586-9. [DOI] [PubMed] [Google Scholar]
- 47.Rouser G, Fleischer S, Yamamoto A. Two Dimensional Thin Layer Chromatographic Separation of Polar Lipids and Determination of Phospholipids by Phosphorous Analysis of Spots. Lipids. 1970;5:494–496. doi: 10.1007/BF02531316. [DOI] [PubMed] [Google Scholar]
- 48.Horak D, Babic M, Jendelova P, Herynek V, Trchova M, Pientka Z, Pollert E, Hajek M, Sykova E. D-Mannose-Modified Iron Oxide Nanoparticles for Stem Cell Labeling. Bioconjugate Chem. 2007;18:635–644. doi: 10.1021/bc060186c. [DOI] [PubMed] [Google Scholar]
- 49.Schlomka JP, Roessl E, Dorscheid R, Dill S, Martens G, Istel T, Baumer C, Herrmann C, Steadman R, Zeitler G, et al. Experimental Feasibility of Multi-Energy Photon-Counting K-Edge Imaging in Pre-Clinical Computed Tomography. Phys Med Biol. 2008;53:4031–4047. doi: 10.1088/0031-9155/53/15/002. [DOI] [PubMed] [Google Scholar]
Associated Data
This section collects any data citations, data availability statements, or supplementary materials included in this article.