Abstract
Objective
To evaluate whether kidney and cyst volumes can be accurately estimated based on limited area measurements from MR images of patients with autosomal dominant polycystic kidney disease (ADPKD).
Materials and Methods
MR coronal images of 178 ADPKD participants from the Consortium for Radiologic Imaging Studies of ADPKD (CRISP) were analyzed. For each MR image slice, we measured kidney and renal cyst areas using stereology and region-based thresholding methods, respectively. The kidney and cyst ‘observed’ volumes were calculated by summing up the area measurements of all the slices covering the kidney. To estimate the volume, we selected a coronal mid-slice in each kidney and multiplied its area by the total number of slices (‘PANK2’ for kidney and ‘PANC2’ for cyst). We then compared the kidney and cyst volumes predicted from PANK2 and PANC2, respectively, to the corresponding observed volumes, using a linear regression analysis.
Results
The kidney volume predicted from PANK2 correlated extremely well with the observed kidney volume: R2=0.994 for right and 0.991 for left kidney. The linear regression coefficient multiplier to PANK2 that best fit the kidney volume was 0.637 (95%CI: 0.629–0.644) for right and 0.624 (95%CI: 0.616–0.633) for left kidney. The correlation between the cyst volume predicted from PANC2 and the observed cyst volume was also very high: R2=0.984 for right and 0.967 for left kidney. The least squares linear regression coefficient for PANC2 was 0.637 (95%CI: 0.624–0.649) for right and 0.608 (95%CI: 0.591–0.625) for left kidney.
Conclusion
Kidney and cyst volumes can be closely approximated by multiplying the product of the mid-slice area measurement and the total number of slices in the coronal MR images of ADPKD kidneys by 0.61–0.64. This information will help save processing time needed to estimate total kidney and cyst volumes of ADPKD kidneys.
Keywords: kidney, polycystic kidney disease, kidney volume, renal cysts, magnetic resonance imaging
INTRODUCTION
Autosomal dominant polycystic kidney disease (ADPKD) is a progressive disorder that causes life-altering symptoms and potentially lethal complications. The disease begins with relatively few cystic renal tubules; however, these cysts expand over time. Indeed, the appearance and growth of cysts in the kidney, the hallmarks for the diagnosis of ADPKD, strongly correlate with the progression of the disease (1).
The Consortium for Radiologic Imaging Studies of Polycystic Kidney Disease (CRISP) was established to create a database consisting of magnetic resonance imaging (MRI) data, renal functional parameters and other selected markers of disease progression in individuals with ADPKD who are in the early course of their disease (2). The CRISP study revealed that kidney volume measurements from MRI are more sensitive than renal-function measures in assessing yearly progression of the disease, and that kidney enlargement resulting from the expansion of cysts in ADPKD patients is associated with the decline of renal function (3).
While kidney and renal cyst volumes are important metrics for the assessment of ADPKD progression, the measurement of these volumes is not trivial. A number of techniques are available to measure kidney and renal cyst volumes from CT or MR images. Some of these techniques rely primarily on manual operations (e.g., manual delineation of the kidney boundary on each image slice over a series of slices covering the entire volume of kidneys), while others use more automated operations. Although a fully automated segmentation is feasible for normal kidneys, it is exceedingly challenging for ADPKD kidneys because of the high variability in both the morphology of the affected kidneys and the composition of cyst fluid. As well, measurement of the kidney cyst volume presents an even greater challenge than measurement of the whole kidney volume due to the fact that cysts are often numerous and vary in size and imaging appearance (2, 4).
Total kidney and cyst volumes are typically calculated from a set of contiguous CT or MR images by summing the products of the area measurements and the slice thickness. However, measuring the area of every slice in a series of images is laborious and time-consuming. If the volume of the kidney or renal cysts can be accurately estimated from the area measurement of a limited number of slices, we may be able to expedite the measuring process. Thus, the purpose of the current study is to evaluate whether kidney and cyst volumes can be accurately estimated from limited area measurements on MR images in patients with ADPKD.
MATERIALS AND METHODS
The study protocol for the CRISP (clinical trials registration: NCT01039987, registration date: Dec 23, 2009) has been previously described (2, 3, 5) and was approved by the institutional review board at each participating clinical center. Informed consent was obtained from all subjects who participated in the CRISP study.
Participants and MR Imaging
CRISP was launched in 1999 to acquire prospective, multi-year longitudinal measurements of renal and renal cyst volumes in a large cohort of ADPKD participants. Detailed descriptions of the CRISP study protocol, the clinical characteristics of the cohort, and the baseline characteristics have been published previously (2, 3, 5). The MRI protocol for the CRISP study was standardized and implemented in 1.5T MRI scanners at four clinical centers (Mayo Clinic, Emory University, University of Kansas Medical Center, and University of Alabama at Birmingham). In each participant, a phased-array surface coil was positioned with its center over the inferior costal margin, estimated as the upper margin of the kidney. The field of view was maintained between 30 and 35 cm. The kidneys were imaged first postero-anterior in the coronal plane using a T2-weighted single-shot fast spin-echo sequence with fat saturation at 3 mm fixed-slice thickness during breath-hold(s). After T2-weighted images were obtained, breath-hold coronal, three-dimensional spoiled gradient interpolated T1-weighted images without fat saturation at 3 mm fixed-slice thickness were obtained (2).
MR Image Analysis
MR images from 178 CRISP II participants obtained in years 2007–2008 were analyzed. In the CRISP II protocol, MR images were acquired without use of gadolinium contrast because of the potential association between nephrogenic systemic fibrosis and gadolinium contrast in patients with impaired renal function. The area of the kidney was measured at each slice of the T1-weighted images without use of gadolinium, using a stereology method that is based on counting the number of intersections of a randomly oriented and positioned grid over the object (2, 4). The area of the kidney in each image was calculated by collecting selected points that overlaid the kidney regions and then converting the point count to a pixel count for the area measurements (2, 4, 6). The kidney volume was then calculated from the set of contiguous images by summing the products of the area measurements and the slice thickness
The total volume of cysts in each kidney was measured using a region-based thresholding method (2, 5). Because of their water content, cysts were brighter than the renal parenchyma in T2-weighted images. Therefore, they could be measured by summing voxels with intensity values greater than those of the background renal parenchyma. On each renal MR image slice, an analyst selected a threshold to visually distinguish the cyst from renal parenchymal regions and generate a binary signal-intensity map. In the binary map, cysts that were brighter than renal parenchyma were represented as white regions, whereas the background renal parenchyma was designated as black regions. By summing the pixels of white regions, the cystic area was measured in each slice. Just as with kidney volume, the total cyst volume was calculated from each set of contiguous images by summing the products of the areas measured and the slice thickness.
Data Analysis for Kidney and Cyst Volumes with Mid-slice Area Measurements
From a series of coronal MR images of the right or left kidney in each subject, we selected the mid-slice by reviewing and scrolling the image set. We defined the mid-slice as the slice whose image number corresponded to a half of the sum of the first slice and last slice image numbers in the image set (if the sum was odd, the mid-slice corresponded to the neighboring slice, rounding up from the mean). The product of the mid-slice kidney area and the number of slices covering the kidney (‘PANK2’) was then computed for each kidney. Likewise, the product of the mid-slice cyst area and the number of slices covering the whole kidney (‘PANC2’) was also computed for each kidney. A linear regression model without a constant was applied to PANK2 or PANC2 as the independent variable, while the corresponding observed kidney or cyst volume served as the dependent variable. A multiplier that best fits the linear regression model was computed in each comparison.
Data Analysis for Kidney and Cyst Volumes with Three-slice Area Measurements
In addition to the mid-slice (i.e., the 2nd quartile) image, we also selected two additional slices from each kidney image series: the mid-slice of the anterior half (the 1st quartile) and the mid-slice of the posterior half (the 3rd quartile) of the series. We retrieved the kidney and cyst area measurement from these slices and then multiplied the area by the number of slices covering the kidney, resulting in additional slice area measurements: PANK1 from the 1st quartile kidney area; PANK3 from the 3rd quartile kidney area; PANC1from the 1st quartile cyst area; and PANC3 from the 3rd quartile cyst area.
For the linear regression analysis, we used two different approaches to combine the three-slice area measurements (PANK1, PANK2, PANK3) or (PANC1, PANC2, PANC3). For the first approach, we considered these three products as three independent variables and calculated the least squares regression coefficients for predicting the corresponding observed volume in a linear regression model. As an alternative approach, we combined the three products by applying a pre-determined fixed weight to each product to generate a sum as an independent variable: [(8/27)PANK1+(2/9)PANK2+(8/27)PANK3]. The weight values were determined based on the ellipsoidal geometry (see Appendix). This combined variable was compared against the observed kidney or cyst volume as the dependent variable in a linear regression analysis. Model fit was judged by the R2 value, i.e., the proportion of variability in volume explained by the regression model (or the linear combination with predetermined coefficients).
Data Analysis for Kidney Volume for Small- and Moderate-size Kidneys
To evaluate whether the same coefficients and level of prediction applied to predicting kidney volume for small- and moderate-size kidneys, the analyses were rerun for kidneys less than the median volume (i.e., 576.2 mL for the right kidney and less than 616.0 mL for the left kidney).
Assessment of Variability in Correlation Coefficients
Bootstrap confidence intervals were calculated to quantify the degree of variability in the R2 values. More specifically, 1,000 bootstrap samples were created by sampling with replacement, and then the R2 value was calculated for each of those 1,000 data sets. The 95% confidence intervals were then defined as the R2 values representing the 2.5 and 97.5 percentiles of the bootstrap distribution. This approach provides a non-parametric estimate that does not depend on any distributional assumptions for the R2 values. All regression models and associated plots were fit with Stata (version 12) and bootstrap analyses and associated confidence intervals were calculated with R (version 9.2).
RESULTS
Kidney and Cyst Volume Estimation from the Mid-slice Area Measurements
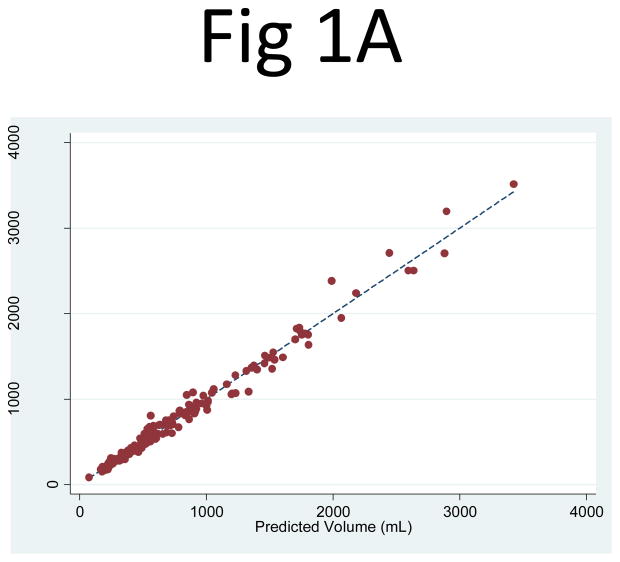
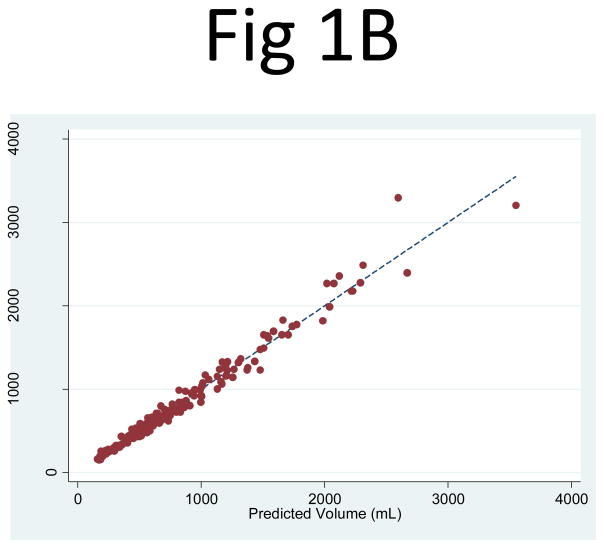
The kidney volume predicted from PANK2 (the product of the mid-slice area and the number of slices) correlated extremely well with the observed kidney volume measurements: R2 = 0.994 (95% CI: 0.991, 0.996) for the right kidney and 0.991 (95% CI: 0.986, 0.995) for the left kidney. The linear regression least squares coefficient for PANK2 (to predict kidney volume) was 0.637 (95% CI: 0.629, 0.644) for the right kidney and 0.624 (95% CI: 0.616, 0.633) for the left kidney (Fig. 1). The regression of PANK2 seemed highly predictive of the kidney volume measurements across the entire range of kidney sizes, with only a few points having visibly higher residuals at higher volumes.
Fig 1. Comparison of the observed kidney volume measurements and the product of the mid-slice area and the number of slices for (A) the right and (B) left kidneys.
The correlation between the observed kidney volume measurement and the product of the mid-slice area and the number of slices (PANK2) was R2 = 0.994 for the right and 0.991 for the left kidney. The linear regression coefficient multiplier to the area product that best fit the kidney volume was 0.637 (95% CI: 0.629, 0.644) for the right kidney and 0.624 (95% CI: 0.616, 0.633) for the left kidney.
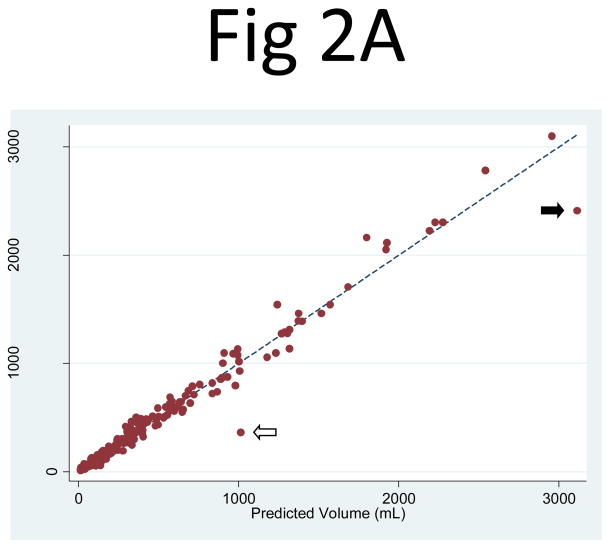
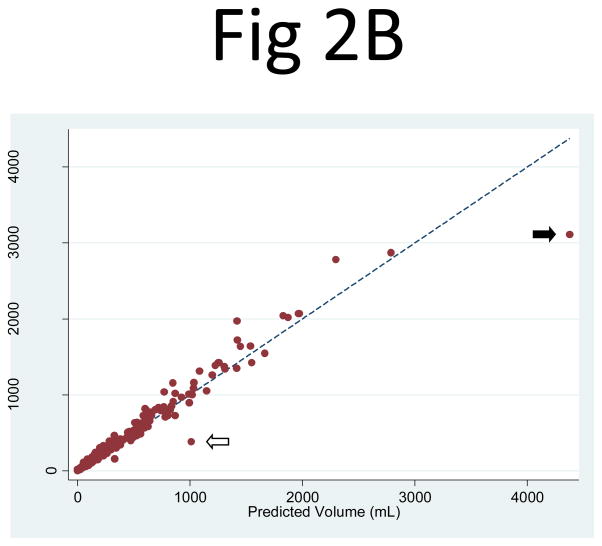
Similarly, the cyst volume predicted from PANC2 correlated extremely well with the observed cyst volume measurements: R2 = 0.984 (95% CI: 0.973, 0.994) for the right kidney and 0.967 (95% CI: 0.950, 0.990) for the left kidney. The least-squares coefficient for PANC2 (to predict cyst volume) was 0.637 (95% CI: 0.624, 0.649) for the right kidney and 0.608 (95% CI: 0.591, 0.625) for the left kidney (Fig. 2). Two notable outliers in the regression corresponded to one participant with prominent clustered and exophytic cysts in the mid-slice of relatively small kidneys (Fig. 3) and the other participant with numerous cysts clustered more centrally in the mid-slices of large right and left kidneys. Because of an overly large contribution from these mid-slice cysts, the volume estimation from the mid-slice cyst area measurement greatly exceeded the observed cyst volumes in these kidneys.
Fig 2. Comparison of the observed cyst volume measurements and the product of the mid-slice area and the number of slices for (A) the right and (B) left kidneys.
The correlation between the observed cyst volume measurement and the product of the mid-slice area and the number of slices (PANC2) was R2 = 0.984 for the right and 0.967 for the left kidney. The linear regression coefficient multiplier to the area product that best fit the cyst volume was 0.637 (95% CI: 0.624, 0.649) for the right kidney and 0.608 (95% CI: 0.591, 0.625) for the left kidney. Two apparent outliers are indicated by the arrows. The mid-slice images from one of the outliers (white arrow) are shown in Fig. 3.
Fig 3. The mid-slice images of (A) the right and (B) left kidney from the outlier indicated in Figure 2 by the white arrow.
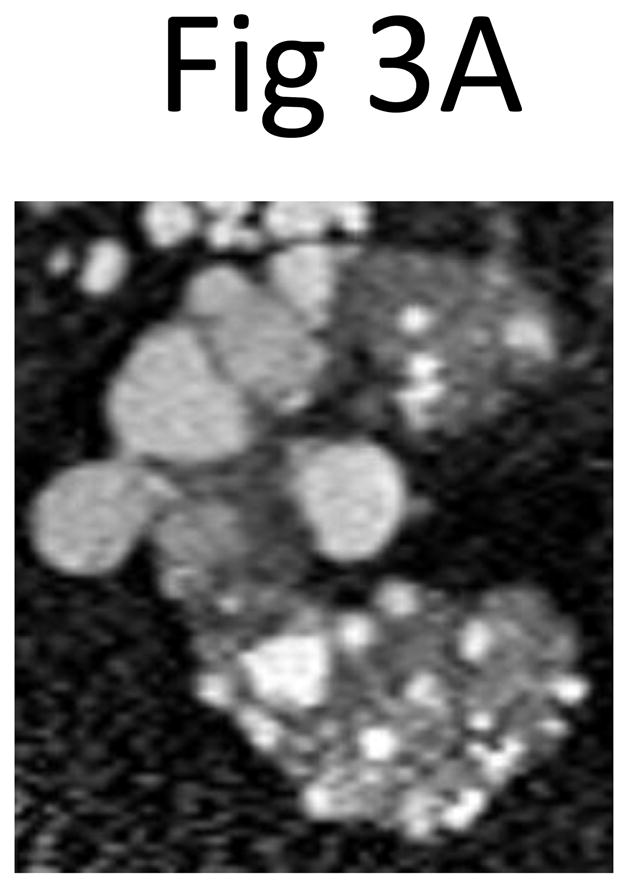
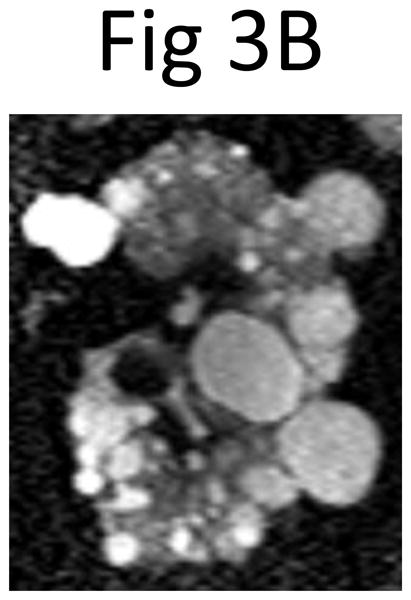
Because of an overly large contribution from large clustered and exophytic cysts in the mid-slices, the cyst volumes (right 1028.0 mL, left 1067.3 mL) predicted from the product of the mid-slice cyst area measurement (right 36.0 cm2, left 45.0 cm2) and the number of slices (right 44, left 37) greatly exceeded the observed cyst volumes (right 362.0 mL, left 378.6 mL) that were measured by summing all the slices covering the whole kidney. The multiplier to the cyst area product used to predict the volume was 0.637 for the right and 0.608 for the left kidney.
Kidney and Cyst Volume Estimation from the Three-slice Area Measurements
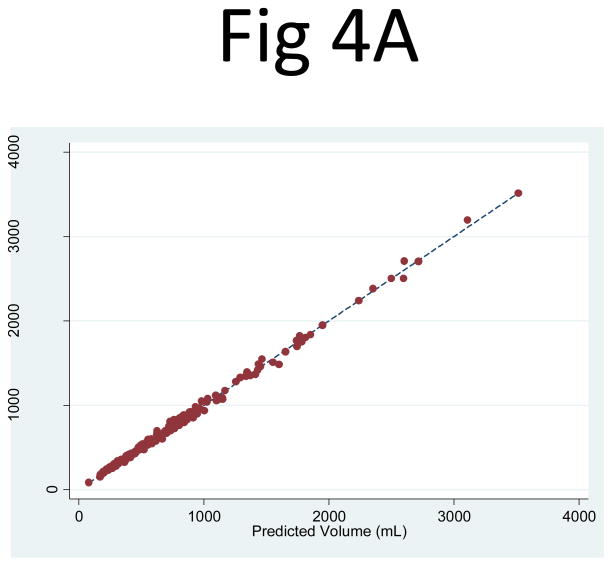
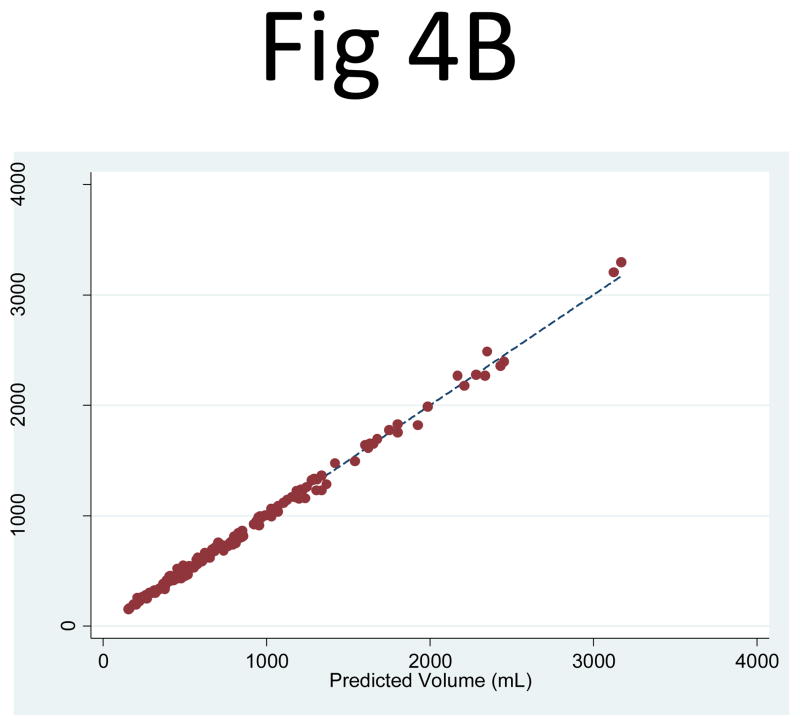
When the three-slice kidney area measurements (PANK1, PANK2, PANK3) were used as independent variables in a linear regression to predict the observed kidney volume, the correlation was higher than that of PANK2 alone: R2 = 0.999 for both the right (95% CI: 0.9986, 0.9993) and left (95% CI: 0.9985, 0.9992) kidneys (Fig. 4). The corresponding linear regression coefficients for PANK1, PANK2, and PANK3 were 0.319 (95% CI: 0.297, 0.340), 0.171 (95% CI: 0.137, 0.205), 0.306 (95% CI: 0.274, 0.339), respectively for the right kidney and 0.315 (95% CI: 0.296, 0.334), 0.185 (95% CI: 0.154, 0.217), 0.288 (95% CI: 0.254, 0.323), respectively for the left kidney. Using the geometrically predetermined coefficients for PANK1, PANK2, and PANK3 led to slightly better correlations with observed volumes than the mid-slice, with R2 values of 0.996 (95% CI: 0.994, 0.997) for the right and 0.995 (95% CI: 0.993, 0.996) for the left kidney.
Fig 4. Comparison of the observed kidney volume measurements and the product of the three-slice area and the number of slices for (A) the right and (B) left kidney.
The correlation between the observed kidney volume measurement and (PANK1, PANK2, PANK3) as three independent variables in a linear combination was extremely strong: R2 = 0.999 for both the right (95% CI: 0.9986, 0.9993) and left (95% CI: 0.9985, 0.9992) kidneys.
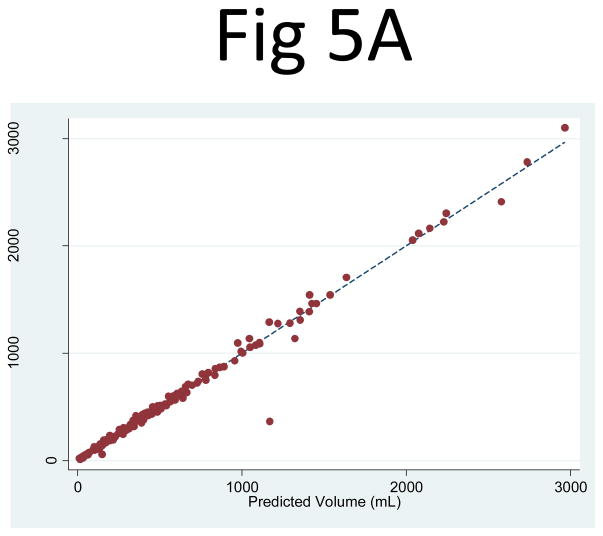
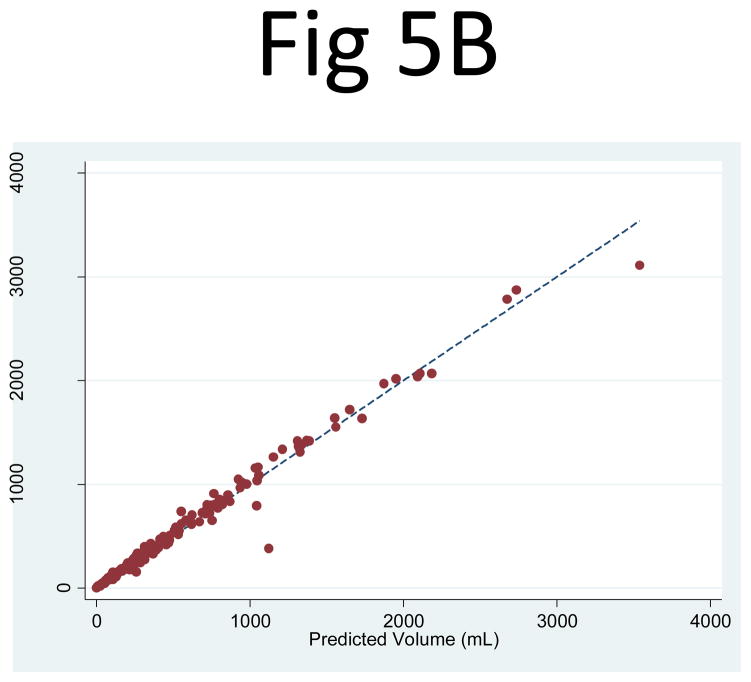
The three-slice cyst area measurements (PANC1, PANC2, PANC3) were then entered as independent variables in a linear regression, which yielded an R2 = 0.992 (95% CI: 0.979, 0.999) for the right and 0.989 (95% CI: 0.979, 0.998) for the left kidney (Fig. 5). The corresponding linear regression least squares coefficients for PANC1, PANC2, and PANC3 were 0.270 (95% CI: 0.226, 0.314), 0.246 (95% CI: 0.185, 0.307), 0.246 (95% CI: 0.185, 0.308), respectively for the right kidney and 0.304 (95% CI: 0.252, 0.355), 0.043 (95% CI: −0.17, 0.102), and 0.470 (95% CI: 0.409, 0.531), respectively for the left kidney. Using the three-slice area measurements (PANC1, PANC2, PANC3) with the geometrically predetermined coefficients led to similar correlations with the observed cyst volumes, with R2 = 0.983 (95% CI: 0.946, 0.997) for the right and 0.963 (95% CI: 0.920, 0.994) for the left kidney.
Fig 5. Comparison of the observed cyst volume measurements and the product of the three-slice area and the number of slices for (A) the right and (B) left kidney.
The correlation between the observed cyst volume measurement and (PANC1, PANC2, PANC3) as three independent variables in a linear combination was extremely strong: R2 = 0.992 (95% CI: 0.979, 0.999) for the right and 0.989 (95% CI: 0.979, 0.998) for the left kidney.
Kidney Volume Estimation for Small- and Moderate-size Kidneys
R2 values for small- and moderate-size kidneys were highly comparable to those for larger kidneys for prediction based on the mid-slice and all three slices (with differences of 0.3% or less), with larger but still very minor differences in the ellipsoid R2 values (of 1.8 – 3.1%). The linear regression coefficients for the mid-slice of small- and moderate-size kidneys were also very similar to those of larger kidneys (with a multiplier of 0.61 as compared to 0.62 – 0.64). The coefficients using a regression of three slices yielded moderate differences in the multipliers (with differences of 0.052 – 0.119); however, this was not unexpected since the three products (of the area times the number of slices) were nearly collinear (with pairwise correlations between 0.88 – 0.97), and thus likely to be unstable in terms of individual coefficients.
DISCUSSION
The CRISP study demonstrated that we could reliably measure total kidney and cyst volumes from MR imaging, supporting the use of these indices for monitoring disease progression and targeted therapeutic trials in patients with ADPKD (2, 3). For instance, in a recent clinical trial (7), annual MRI measurements were used to quantify kidney volume. This trial demonstrated that the rate of increase in total kidney volume was slowed with use of tolvaptan.
There are a number of imaging techniques and measurement methods to quantify total kidney volume and kidney cyst volume (2, 4, 8, 9). In ultrasonography (US) imaging, kidney volume is commonly estimated from the maximum length (L), width (W), and depth (D) of the kidney, using the formula for an ellipsoid (πLWD/6) (8). Length and width are measured from longitudinal images acquired in planes ranging from sagittal to coronal, whereas depth is obtained from transverse images of the mid-kidney acquired in the plane perpendicular to the longitudinal plane. This US method, based on 3 linear axial measurements, is limited for accurately estimating kidney volume, particularly in ADPKD kidneys that are irregularly shaped and frequently too large to accurately measure the three axial dimensions. Of the three axial measurements of the kidney, the depth (i.e., distance from the later edge to the central hilum on the coronal plane) is often more difficult to determine than the other two. Even with MR measurements of kidney volume and area, we must carefully exclude hilar structures (vessel, collecting systems) in the mid-slice. Furthermore, some exophytic cysts may deform the renal contour, resulting in inaccurate axial measurements. Although renal volume based on the ellipsoid formula is simple to use, it was shown to be less accurate and precise than that of MR-based measurement in ADPKD (8). Compared to kidney volume, cyst volume is even more challenging to measure from US imaging because of the limited imaging resolution and the difficulty in identifying the numerous cysts within the kidney.
In CT and MR imaging, kidney and cyst volumes are typically computed by measuring the area of each slice of contiguous images covering the entire volume and then summing the products of the area measurements and the slice thickness. Measuring the volume by summing the area of every slice in a series of images (typically 20–40 slices per each ADPKD kidney at 3-mm slice thickness) is laborious and time-consuming. By limiting the number of area measurements (e.g., only one mid-slice) from a set, we can greatly improve the efficiency of measuring kidney or kidney cyst volumes.
Our study revealed extremely strong correlations between the observed volume and the product of the mid-slice area and the number of slices for both the renal and cyst volumes of the right and left kidneys. The correlations for the kidney volume (R2 = 0.994 for the right and 0.991 for the left kidney) were greater than those for the cyst volume (R2 = 0.984 for the right and 0.967 for the left kidney). The correlations for the right kidney were minimally greater than that for the left kidney. The correlations for the kidney volume for small- and moderate-size kidneys were very similar to those of larger kidneys. These extraordinary high correlations and regression analysis results indicated that we can accurately predict the kidney and cyst volumes from limited area measurements on MR images in patients with ADPKD. Since the coefficients and R2 values were determined using the same data, findings may be more optimistic than would be achieved in another data set; results should therefore be validated in future studies.
The linear regression coefficients multiplied by the product of the mid-slice area and the number of slices to best fit the observed volume were 0.637 and 0.624 for the kidney volumes (the right and left kidney, respectively) and 0.637 and 0.608 for the cyst volume (the right and left kidney, respectively). The significance of these numbers reflects the geometry of kidney. Assuming that the kidney has an ellipsoid shape, the volume corresponds to πABC/6, where A, B, and C represent the diameters in three axes. The mid cross-section of the ellipsoid along axis C is an ellipse with its area corresponding to πAB/4. Since the number of slices corresponds to C, the mid-slice area times the number of slices equals πABC/4. Thus, a multiplier to this product that would result in the ellipsoid volume of πABC/6 is 2/3 or 0.67. This value is close to the linear regression coefficients, 0.61–0.64, which we empirically estimated. This theoretical and empirical consistency supports the possibility that we may be able to approximate kidney or cyst volume from the mid-slice area measurement and number of slices by applying our empirically-derived multipliers.
When we used the three-slice area measurements as three independent variables for predicting the corresponding observed volumes, the correlations were even higher than those with the mid-slice alone. However, given the already extremely high correlations with the mid-slice area measurement, this incremental improvement with two additional area measurements may not be significantly contributory in practice. In addition, the empirical linear regression coefficients for the three-slice area measurements were variable. Thus, we cannot predetermine a multiplier for each of the three-slice area measurements to provide the best volume estimate.
When three-slice area measurements were combined by multiplying predetermined linear coefficients based on the ellipsoidal geometry, the correlations for predicting the observed kidney volumes were higher than those for the mid-slice only, but slightly lower than those for the three-slice independent variable fitting. Although the three methods were statistically different (with non-overlapping CI), the R2 values were within about 1% of each other across all three methods for predicting observed kidney volume. On the other hand, for the cyst volume prediction, the correlations for the three-slice area measurements with predetermined linear coefficients were slightly lower than those for the other two methods (mid-slice only or three-slice independent variable fitting). Nevertheless, all three methods for predicting observed cyst volume produced overlapping confidence intervals, thus reflecting a lack of statistical differences.
Our method for estimating kidney volume from the mid-slice area measurement and the number of slice may be applicable directly to CT and possibly to US imaging. The transaxial CT images can be reformatted in the coronal plane to measure the mid-slice area. The kidney or cyst volume can be estimated from the mid-slice area measurement on CT and the number of slices. For US imaging, the cross-sectional area of the kidney can be measured from the mid-slice image in the coronal plane. The width (the antero-posterior dimension) of the kidney, corresponding to the number of slices in MR imaging, can be measured perpendicular to the coronal mid-slice. The kidney volume can then be predicted using the mid-slice area and width measurements. The proposed volume measurement method for CT or US imaging may require validation in future studies.
Our study demonstrated that kidney and cyst volumes can be approximated from the mid-slice area measurement and the number of slices. This approach is far more efficient than measuring area in every slice of a MR imaging set to derive kidney or cyst volume. However, when a precise volumetric measurement is needed, e.g., to determine subtle changes in a volumetric follow-up, measurement and analysis of every slice may still be required. In some cases, regional morphological variations in ADPKD may cause a large error in the estimation of volumes with the use of a limited set of images (e.g., outliers in Fig. 2). The estimation of renal cyst volume is likely more challenging than that of kidney volume because of higher local variations (Fig. 3). The mid-slice images from the two outliers in our study cases presented with far larger and exophytic than other cysts distributed in the remaining kidney. When using this technique, analysts should take into consideration the possibility that this pattern of cystic dominance toward the mid-slice may lead to an over-estimation of the cystic volume. In practice, the trade-off in the volume measurement between the mid-slice approximation and measurement from every-slice should be determined by balancing the required degree of precision versus measurement efficiency in each application.
In conclusion, kidney and cyst volumes can be closely approximated by multiplying 0.61–0.64 with the product of the mid-slice area measurement and the total number of slices in the coronal MR images of ADPKD kidneys. A further expansion of the volume prediction by including area measurements from two additional slices was not particularly contributory. Application of the proposed mid-slice technique will decrease the amount of processing time needed to estimate the total kidney and cyst volumes of patients with ADPKD. We believe that our proposed method is sufficiently precise and therefore useful for clinical research that relies on kidney or cyst volume measurement as an imaging biomarker, unless a study requires a highly precise volumetric measurement to determine subtle volumetric changes in a short follow-up period. Nevertheless, a precision threshold determining the mid-slice approximation versus every-slice volume measurement should be investigated in a future study.
Acknowledgments
The CRISP study is supported by cooperative agreements from the National Institute of Diabetes and Digestive and Kidney Diseases of the National Institutes of Health (DK056943, DK056956, DK056957, DK056961), by the National Center for Research Resources General Clinical Research Centers at each institution (RR000039, Emory University; RR00585, Mayo College of Medicine; RR23940, Kansas University Medical Center; RR000032, University of Alabama at Birmingham), and the National Center for Research Resources Clinical and Translational Science Awards at each institution (RR025008, Emory; RR024150, Mayo College of Medicine; RR033179, Kansas University Medical Center; RR025777 and UL1TR000165, University of Alabama at Birmingham; RR024153 and UL1TR000005, University of Pittsburgh School of Medicine). The investigators are indebted to the radiologists, radiology technologists, imaging engineers, and study coordinators in CRISP.
Appendix
For an ellipsoid with its three principal axes of length A, B, and C, the volume corresponds to πABC/6. When the ellipsoid is sliced along axis C, the number of slices in the MR imaging set is equivalent to length C. At the mid-point of the axis (i.e., at C/2), the cross-section of the ellipsoid is an ellipse with its area corresponding to πAB/4. At the 1st quartile (C/4) or 3rd quartile (3C/4) along axis C, the cross-section of the ellipsoid is also an ellipse, but with an area smaller than that of C/2, i.e., 75% of the mid-point ellipse: [(3/4) × πAB/4].
We considered the three-slice area measurements in the MR image set of each kidney as corresponding to the ellipsoidal cross-sections at the 1st quartile (at C/4), mid-slice (at C/2), and 3rd quartile (at 3C/4) along axis C. We need to apply an appropriate weighting value to each of the three area measurements to achieve their balanced contributions to estimate the ellipsoid volume. Using the proportionality determined from the aforementioned ellipsoidal cross-sections, the combined contributions from the three area measurements can be expressed as follows: combined area (Areac) = [(4/9) of the 1st quartile area + (1/3) of the mid area + (4/9) of the 3rd quartile area]. This combined area (Areac) equals πAB/4 for an ellipsoid with its three principal axes of length A, B, and C. The kidney volume is estimated by multiplying the number of slices (length C of the ellipsoid) and 2/3: Volume = Areac × C × (2/3) = [(8/27)PANK1+(2/9)PANK2+(8/27)PANK3].
Footnotes
Disclosures
K.T.B., A.B.C. and J.J.G. are consultants to Otsuka Corporation, and V.E.T. received research support from Otsuka Corporation. M.M. is a consultant to Otsuka Corporation and Alexion Pharmaceuticals.
References
- 1.Chapman AB, Bost JE, Torres VE, et al. Kidney volume and functional outcomes in autosomal dominant polycystic kidney disease. Clin J Am Soc Nephrol. 2012;7(3):479–86. doi: 10.2215/CJN.09500911. [DOI] [PMC free article] [PubMed] [Google Scholar]
- 2.Chapman AB, Guay-Woodford LM, Grantham JJ, et al. Renal structure in early autosomal-dominant polycystic kidney disease (ADPKD): The Consortium for Radiologic Imaging Studies of Polycystic Kidney Disease (CRISP) cohort. Kidney Int. 2003;64(3):1035–45. doi: 10.1046/j.1523-1755.2003.00185.x. [DOI] [PubMed] [Google Scholar]
- 3.Grantham JJ, Torres VE, Chapman AB, et al. Volume progression in polycystic kidney disease. N Engl J Med. 2006;354(20):2122–30. doi: 10.1056/NEJMoa054341. [DOI] [PubMed] [Google Scholar]
- 4.Bae KT, Commean PK, Lee J. Volumetric measurement of renal cysts and parenchyma using MRI: phantoms and patients with polycystic kidney disease. J Comput Assist Tomogr. 2000;24(4):614–9. doi: 10.1097/00004728-200007000-00019. [DOI] [PubMed] [Google Scholar]
- 5.Bae KT, Zhu F, Chapman AB, et al. Magnetic resonance imaging evaluation of hepatic cysts in early autosomal-dominant polycystic kidney disease: the Consortium for Radiologic Imaging Studies of Polycystic Kidney Disease cohort. Clin J Am Soc Nephrol. 2006;1(1):64–9. doi: 10.2215/CJN.00080605. [DOI] [PubMed] [Google Scholar]
- 6.Bae KT, Tao C, Zhu F, et al. MRI-based kidney volume measurements in ADPKD: reliability and effect of gadolinium enhancement. Clin J Am Soc Nephrol. 2009;4(4):719–25. doi: 10.2215/CJN.03750708. [DOI] [PMC free article] [PubMed] [Google Scholar]
- 7.Torres VE, Chapman AB, Devuyst O, et al. Tolvaptan in patients with autosomal dominant polycystic kidney disease. N Engl J Med. 2012;367(25):2407–18. doi: 10.1056/NEJMoa1205511. [DOI] [PMC free article] [PubMed] [Google Scholar]
- 8.O’Neill WC, Robbin ML, Bae KT, et al. Sonographic assessment of the severity and progression of autosomal dominant polycystic kidney disease: the Consortium of Renal Imaging Studies in Polycystic Kidney Disease (CRISP) Am J Kidney Dis. 2005;46(6):1058–64. doi: 10.1053/j.ajkd.2005.08.026. [DOI] [PubMed] [Google Scholar]
- 9.Bae KT, Grantham JJ. Imaging for the prognosis of autosomal dominant polycystic kidney disease. Nat Rev Nephrol. 2010;6(2):96–106. doi: 10.1038/nrneph.2009.214. [DOI] [PubMed] [Google Scholar]


