Abstract
The widespread use of mass spectrometry for protein identification has created a demand for computationally efficient methods of matching mass spectrometry data to protein databases. A search using X!Tandem, a popular and representative program, can require hours or days to complete, particularly when missed cleavages and post-translational modifications are considered. Existing techniques for accelerating X!Tandem by employing parallelism are unsatisfactory for a variety of reasons. The paper describes a parallelization of X!Tandem, called X!!Tandem, that shows excellent speedups on commodity hardware and produces the same results as the original program. Furthermore, the parallelization technique used is unusual and potentially useful for parallelizing other complex programs.
Keywords: proteomics, protein identification, parallel database search, X!Tandem, tandem mass spectrometry, parallel X!Tandem, MPI
Introduction
Tandem mass spectrometry is commonly used to identify proteins in a sample, a process that requires search algorithms to compare observed spectra against protein databases and identify potential matches. A number of programs exist for performing this search, including commercial programs such as Sequest1 and Mascot;2 among the most popular is an open-source program, X!Tandem.3,4
X!Tandem's major innovation is to conduct the search in two phases. In the first phase, a rapid survey identifies candidate proteins that are approximate matches to the input spectra. In this phase, perfect cleavage is assumed, and no post-translational modifications are allowed. In the second phase, a new search is conducted against only the candidates identified in the first phase, this time permitting refinements such as missed cleavages and post-translational modifications, which greatly increase the complexity of the search. Performing this refined search against the smaller population of candidates from the first phase significantly reduces search time.
Unfortunately, even using this strategy, X!Tandem search times are a bottleneck in the overall protein identification workflow, motivating the development of parallel versions of X!Tandem. X!Tandem is capable of executing in parallel threads on shared memory multiprocessors (SMPs). Compute servers with 2 or 4 processors connected to shared memory are becoming quite common and relatively inexpensive, but achieving speedups greater than 5- or 10-fold requires the use of large SMPs such as the SGI Altix. Because such machines are expensive and uncommon, a distributed memory parallelization that could run on a cluster or network of commodity CPUs would be of great utility to many users. This is particularly true given rapidly growing processing loads due to improved mass spectrometry throughput, more complex samples, and interest in post-translational modifications, which increase the search space exponentially.
Duncan et al.5 of Vanderbilt University previously created a parallel, distributed memory (rather than shared memory, as above) version of X!Tandem that ran using either PVM6 or MPI7,8 (open-source message-passing libraries). Rather than modify the X!Tandem program, they chose a strategy in which they used multiple instances of unmodified X!Tandem, combined with a number of utility programs, to perform the work in parallel. Summarizing, their method:
Subdivided the spectra file into k fragments using a utility program.
Ran each spectra fragment through X!Tandem as a first pass without refinement or post-translational modifications (PTMs). Each of these independent runs could be done in parallel.
Scanned the resulting k output files with another utility program to determine which proteins were hit.
Created a new, smaller database from those proteins, again with a utility.
Reran each spectra fragment through X!Tandem (again, in parallel) as a second pass, this time with refinement and PTMs.
Combined the output files into a single output file with another utility.
Reran sequential or multithreaded X!Tandem against this output file to compute the correct expectation scores.
This multistep process could be performed manually, or automatically via a provided driver program.
Although their method does result in performance improvement, it has several drawbacks:
It is complicated. Users must create extra parameter files not required by X!Tandem.
It is prone to error and difficult to debug when errors occur. Often, errors are not caught and reported immediately but cause subsequent steps to fail in mysterious ways.
The method is sensitive to changes to the format of X!Tandem input or output files.
Results differ significantly from X!Tandem.
Parallelism is limited by the final sequential step, which is necessary to compute proper expectation scores.
Given the drawbacks of the existing parallel methods, we decided to directly parallelize X!Tandem for distributed memory machines. Although this required modifying the source code, it offered several advantages over the previous method:
Ease of use: the program can be run in almost exactly the same way as the sequential program.
Lower complexity: the program consists of a single executable and does not require a number of auxiliary programs.
Better parallelism: both the unrefined and refinement steps of X!Tandem would be parallelized, eliminating the limit on parallelism imposed by the final sequential step in the Duncan method.
Identical results: ideally, the output should be identical to that for X!Tandem, greatly simplifying the task of verification.
We call our parallel version X!!Tandem, denoting it a direct parallelization of X!Tandem. As described below, the source code changes are extremely modest.
Materials and Methods
A 130 node Dell cluster at the Yale Center for High Performance Computation in Biology and Biomedicine9 was used for all computation. Each node consisted of (2) 3.2 GHz Xeon EM64T processors and 8 GB of RAM. The head node consisted of (4) 3.2 GHz Xeon EM64T processors with 8 GB of RAM. The nodes were interconnected via switched gigabit Ethernet.
The software for the performance testing described in this paper included MPICH version 1.2.6, X!Tandem version 06-09-15-3, Boost version 1.33.1, Gcc version 3.2.3, and RedHat Enterprise Linux AS release 3.
The mass spectral data used in our testing were generated by proteolytically digesting two samples of mouse brain and labeling each with Applied Biosystems iTRAQ reagent. The resulting samples were combined and separated by high-pressure microcapillary liquid chromatography (LC) on a cation-exchange column. Twenty fractions from the cation-exchange column were analyzed via reversed phase LC—MS/MS on an Applied Biosystems QSTAR XL mass spectrometer. Each of the QSTAR XL mass spectrometer spectra files (*.wiff format) was processed with MASCOT Distiller version 2.1, and the resulting peak lists were exported as individual spectra in *.dta format. In total, we had 29 268 individual spectra that totaled 92 298 597 bytes in length. The X!Tandem search parameters included static modifications for Carbamidomethyl (Cys) and iTRAQ reagent (N-terminal, Lys) and variable modifications of phosphorylation (Ser, Thr, Tyr). The database searched was IPI mouse, version 3.23 from Nov 2, 2006. It contained 51 536 sequences, totaling 24 497 860 amino acids, and was obtained as a fasta file from EBI.10,11
The Duncan parallel X!Tandem version and X!!Tandem parallel version were run on varying numbers of compute nodes of the cluster. The multithreaded version of X!Tandem was run on the head node of the cluster, since it was the largest shared-memory processor we had available to us.
Initial experiments with both the multithreaded version of X!Tandem and the Duncan parallel X!Tandem indicated a problem with load balancing on our input set. During both the unrefined and refined search steps, the first thread or process would finish in roughly half the time of the longest. This problem was caused by the method used to subdivide the spectra file. Both methods perform the split by breaking it into equal numbers of spectra; the first process taking the first chunk of spectra, the second the next chunk, etc. This technique does not take into consideration the difference in computational complexity among spectra or their distribution in the input file, and thus can easily lead to load balance problems.
Although a full solution to this problem would require estimating compute times for each spectrum a priori, we were able to address this problem satisfactorily by randomly shuffling the spectra file using a Python script. Using this randomized file, both methods showed much-improved load balancing. All results reported in this paper used the same randomized input file. Performing the random shuffle required only 3 s for our input file.
Contribution
We created an efficient parallelized version of X!Tandem called X!!Tandem that demonstrates excellent speedup. In addition, it is substantially the same as the original code, is run in the same manner, and produces identical output. The improved performance of X!!Tandem should be of benefit to researchers analyzing mass spectrometry data. The source code for X!!Tandem has been made freely available via the same open-source license as the original X!Tandem.12 In addition, Dr. Ronald Beavis has indicated willingness to host the source at the X!Tandem Web site once final integration and testing with the newest release of X!Tandem is completed.13
For code developers, the techniques used to parallelize X!Tandem are applicable for accelerating other complex codes that are not otherwise easily parallelized.
Results and Discussion
One major difficulty with directly parallelizing X!Tandem lies in the complexity of the data structures that are created internally. X!Tandem is written in C++, and during the run it creates a complex, highly interlinked graph of C++ objects that represent spectra, protein sequences, scores, etc. These data structures could be shared easily in the multithreaded version of X!Tandem, but a distributed version normally requires splitting the data structure among the separate processes, a daunting prospect.
To resolve this problem, we turned to a technique that we have often found useful when attempting to parallelize codes with complex data structures.14,15 We call this technique Owner Computes. The basic approach is as follows: We create k instances of the code. Each copy behaves much like the standalone, sequential version, in that it does a complete initialization, creating the entire set of data structures rather than just a fraction of them.
However, when each copy reaches the main computational section of the code (for example the main computational loop), each copy only performs some of the iterations, keeping track of which iterations it actually performed, and skipping the rest. Each iteration is performed by only one copy. Which subset of iterations a particular copy performs can be determined in a number of ways and can be static or dynamic. At the end of the main computational section, each copy has some data that is up-to-date (the parts that it computed) but others that require updating (the parts that other processors computed). To correct for this, a merge phase is performed that updates each copy's data structures to contain all the results. The benefits of the Owner Computes method are that (i) we need to understand only a few data structures well enough to move them around, and (ii) very few changes are needed to the original source code.
In the case of X!Tandem, we had an additional advantage, in that the code already contained a threaded parallelization. This parallelization operated by allowing multiple threads to crawl over the data structures in parallel, computing results for disjoint sets of spectra. Once that was completed, a single thread performed a merge step that combined the results appropriately. This pre-existing merge step contained most of the logic we would need for our Owner Computes merge step.
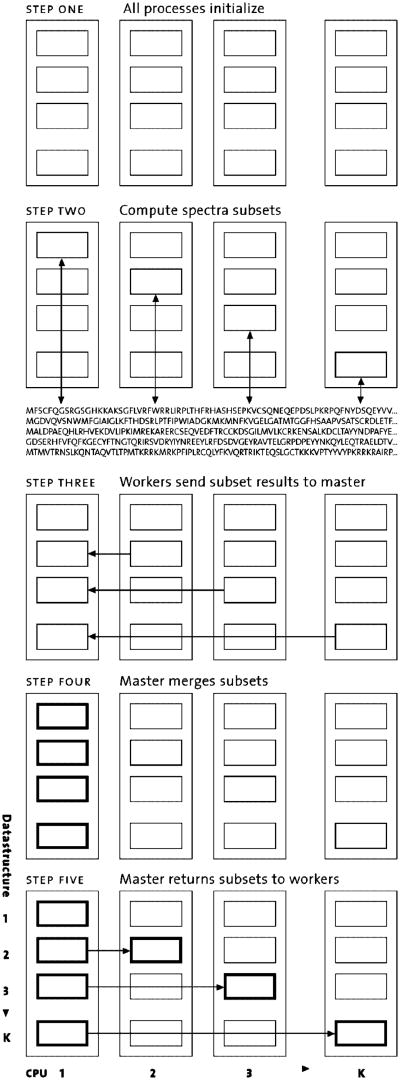
X!!Tandem performs the following steps: We create k copies of the code, each of which is already structured as a k-threaded program. As described above, each copy behaves much as a standalone k-threaded program. However, at the point where it would normally create k threads, instead each ith copy creates only a single thread that does exactly what the ith thread would normally have done. In aggregate, we have k threads, each running inside their own process and CPU. When each thread finishes, we gather up the results it computed and send them to the master (which is just the copy running the first thread), where each set of results are unpacked and placed exactly where they normally would be created by the ith thread.
At this point, the data on the master are exactly what they would have been in a normal, k-threaded version, so the normal merge code can be invoked, combining the results. Next the combined results are gathered up and sent back to the other program copies, where they are unpacked and laid out in their proper location. At this point, all k copies have the same data structures and are ready to continue forward. Since X!Tandem has two computationally intensive sections (the unrefined and refined search steps), the process described above occurs twice, with a merge step at the end of each (see Figure 1).
Figure 1.
Schematic of X!!tandem.
Using the Owner Computes approach, fewer than 30 lines of code were added or changed in the main X!Tandem source file, tandem.cpp. The changes did not alter the overall logic of the program. A few other files required the addition of simple, boilerplate code necessary for moving a few key data structures during the merge step (data serialization). Two additional C++ modules were added; one manages the details of the Owner Computes method, and the other manages data serialization. The most difficult part of the parallelization involved this serialization: the packing, sending, and unpacking of the updated C++ data structures. We used the Boost Serialization package,16 an open-source library, to manage the packing and unpacking. MPI was used to send the packaged data between processors and for coordination.
It is obviously important that the parallel versions of X!Tandem compute correct results. This seemingly simple requirement is, in fact, somewhat complicated with X!Tandem. The SMP version of the program produces textually different results depending on the number of threads used, and simple textual comparison of the results (e.g., using the “diff” file comparison program) proved to be quite difficult. We found that holding the number of threads constant made it possible to compare the output from X!!Tandem and X!Tandem. For example, if we compared X!!Tandem on 4 processors to X!Tandem with 4 threads, the results were identical, with one exception. The exception concerned one field of the output: “nextscore”, which is supposed to represent the second best score for a particular peptide. Very infrequently, this value differed between X!!Tandem and X!Tandem. This turned out to be due to the use of exact floating point equality comparisons in the original X!Tandem code, a practice that is known to make code sensitive to seemingly innocuous reordering of computations, such as changing the order in which numbers are summed. We consider this discrepancy to be minor; the nextscore field is relatively unimportant, and future releases of X!Tandem will correct this nondeterministic behavior.13 Producing identical results in the parallel version greatly simplifies the task of verifying the results; we consider this to be extremely important for creating confidence in the parallel version.
The output from the Duncan parallel X!Tandem method is not the same as that from X!Tandem or X!!Tandem. The results differed substantially, including scores, expectation values, and even which proteins were found in the case of marginal matches. According to the developer, the goal in that project was to find strong matches as quickly as possible, rather than reproducing the X!Tandem output exactly.17
Table 1. compares a small subset of the peptides found by the Duncan method to those found by X!Tandem and X!!Tandem. Since the X!Tandem and X!!Tandem output was identical, it is only presented once in the table. The peptides found agree well, although some differences exist in the expectation values.
Table 1. Comparison of a Small Subset of the Peptides Found by the Duncan Method to Those Found by X!Tandem and X!!Tandem.
| X!Tandem and X!!Tandem | Duncan | sequence | expectratio | ||||||||||
|---|---|---|---|---|---|---|---|---|---|---|---|---|---|
|
|
|
||||||||||||
| spectrum | expect | hyperscore | mh | delta | z | spectrum | expect | hyperscore | mh | delta | z | ||
| 28678.1.1 | 3.90E-08 | 71.9 | 2177.147 | −0.050 | 3 | 14045.1.1 | 3.20E-10 | 71.9 | 2177.147 | −0.050 | 3 | ELLLPNWQGSGSHGLTIAQR | 121.88 |
| 4666.1.1 | 1.00E-05 | 54.4 | 1844.857 | 0.019 | 3 | 4666.1.1 | 7.70E-07 | 54.4 | 1844.857 | 0.019 | 3 | SPEPGQTWTHEVFSSR | 12.99 |
| 28337.1.1 | 2.30E-08 | 49.3 | 1337.718 | 0.010 | 2 | 13704.1.1 | 1.20E-03 | 49.3 | 1337.718 | 0.010 | 2 | RVTAYTVDVTGR | 0.00 |
| 1731.1.1 | 5.20E-03 | 33.5 | 2110.135 | −0.112 | 3 | 1731.1.1 | 1.80E-03 | 33.5 | 2110.135 | −0.112 | 3 | EGVKDIDITSPEFMIK | 2.89 |
| 8854.1.1 | 1.50E-08 | 61.4 | 2028.001 | −0.020 | 3 | 8854.1.1 | 8.00E-10 | 61.4 | 2028.001 | −0.020 | 3 | HEVTEISNTDVETQPGK | 18.75 |
| 7823.1.1 | 5.40E-06 | 55.1 | 1782.911 | 0.008 | 3 | 7823.1.1 | 7.20E-06 | 55.1 | 1782.911 | 0.008 | 3 | AGAISASGPELEGAGHSK | 0.75 |
| 27132.1.1 | 3.30E-04 | 37.5 | 1090.638 | −0.037 | 2 | 12499.1.1 | 5.30E-04 | 37.5 | 1090.638 | −0.037 | 2 | FQVTVPGAK | 0.62 |
| 16847.1.1 | 1.90E-04 | 35.6 | 1074.628 | 0.023 | 2 | 2214.1.1 | 5.30E-03 | 35.6 | 1074.628 | 0.023 | 2 | VGSLDVNVK | 0.04 |
| 8267.1.1 | 1.70E-04 | 43.1 | 2111.232 | −0.016 | 3 | 8267.1.1 | 1.40E-05 | 43.1 | 2111.232 | −0.016 | 3 | LKGPQITGPSLEGDLGLK | 12.14 |
| 13665.1.1 | 1.90E-05 | 49.0 | 2181.077 | 0.028 | 3 | 13665.1.1 | 7.30E-05 | 49.0 | 2181.077 | 0.028 | 3 | MDISAPDVEVHGPEWNLK | 0.26 |
Table 2. compares the top 20 protein hits found by the Duncan method versus X!Tandem/X!!Tandem. The table lists the union of the two sets, ordered by rank for X!Tandem. Here the differences are more pronounced. Although the Duncan method found most of the top 20 found by X!Tandem/X!!Tandem, the scores and ranking differ significantly. We attribute the lack of agreement between the two outputs to the complexity of the input spectra and database; in particular, the database contains numerous cases of analogous proteins that would score identically, and which might be ranked arbitrarily by the two methods. In addition, for this data set, the expectation values found are not particularly high, indicating a weaker signal that is likely to result in less definitive matches and therefore less consistency between the two methods.
Table 2. Top 20 Protein Hits Found by the Duncan Method versus X!Tandem, X!!Tandem.
| protein id | X!Tandem, X!!Tandem | Duncan | ||
|---|---|---|---|---|
|
|
|
|||
| rank | log(e) | rank | log(e) | |
| IPI00678951.1 | 1 | −32.14 | 3 | −37.92 |
| ENSMUSP00000031564 | 2 | −29.84 | 6 | −34.64 |
| IPI00679092.1 | 3 | −26.71 | 124 | −14.59 |
| IPI00378438.6 | 4 | −25.40 | 33 | −23.05 |
| ENSMUSP00000090632 | 5 | −25.23 | 18 | −27.10 |
| IPI00453996.1 | 6 | −25.07 | 5 | −34.85 |
| ENSMUSP00000090895 | 7 | −24.99 | 4 | −37.21 |
| ENSMUSP00000021458 | 8 | −24.34 | 19 | −27.10 |
| ENSMUSP00000087756 | 9 | −24.26 | 25 | −25.44 |
| IPI00759925.1 | 10 | −24.13 | 14 | −28.41 |
| ENSMUSP00000006629 | 11 | −24.13 | 10 | −30.22 |
| ENSMUSP00000026459 | 12 | −23.33 | 39 | −22.38 |
| ENSMUSP00000080974 | 13 | −23.03 | 22 | −25.82 |
| IPI00123181.2 | 14 | −22.44 | 17 | −27.45 |
| ENSMUSP00000015800 | 15 | −21.29 | 46 | −21.80 |
| ENSMUSP00000048678 | 16 | −21.02 | ||
| ENSMUSP00000023934 | 17 | −20.93 | 2 | −39.05 |
| ENSMUSP00000029549 | 18 | −20.93 | ||
| IPI00282403.2 | 19 | −20.76 | 41 | −22.33 |
| ENSMUSP00000053943 | 20 | −20.46 | 58 | −20.14 |
| IPI00655182.1 | 23 | −19.98 | 13 | −28.45 |
| ENSMUSP00000051217 | 27 | −19.77 | 11 | −29.60 |
| ENSMUSP00000057308 | 33 | −18.71 | 15 | −28.14 |
| ENSMUSP00000021993 | 37 | −17.68 | 12 | −29.53 |
| ENSMUSP00000033741 | 38 | −17.68 | 16 | −28.00 |
| ENSMUSP00000033699 | 39 | −17.68 | 20 | −26.50 |
| IPI00309658.1 | 62 | −15.78 | 9 | −30.88 |
| ENSMUSP00000002572 | 69 | −15.42 | 1 | −40.66 |
| ENSMUSP00000027817 | 70 | −15.09 | 8 | −32.76 |
| ENSMUSP00000080538 | 100 | −12.65 | 7 | −33.34 |
Given this, we do not assert that the differences are necessarily significant biologically. The challenge of interpreting these differences, however, illustrates the value of an approach to parallelism that produces results that can be easily compared to the original.
Performance Results
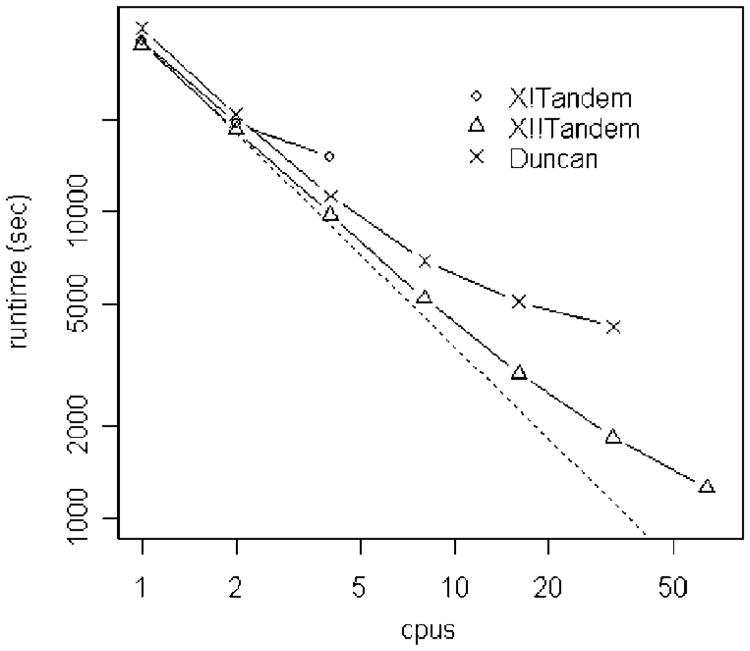
We compared the performance of the three methods using the input files described in the Methods and Materials section. Figure 2 shows the runtime vs the number of CPUs, plotted log–log. X!!Tandem shows significantly better performance than the other two methods as the number of CPUs is increased.
Figure 2.
Total runtime of the X!Tandem, X!!Tandem, and Duncan methods, plotted log–log. Lower is better. The dotted line indicates perfect scaling versus sequential X!Tandem.
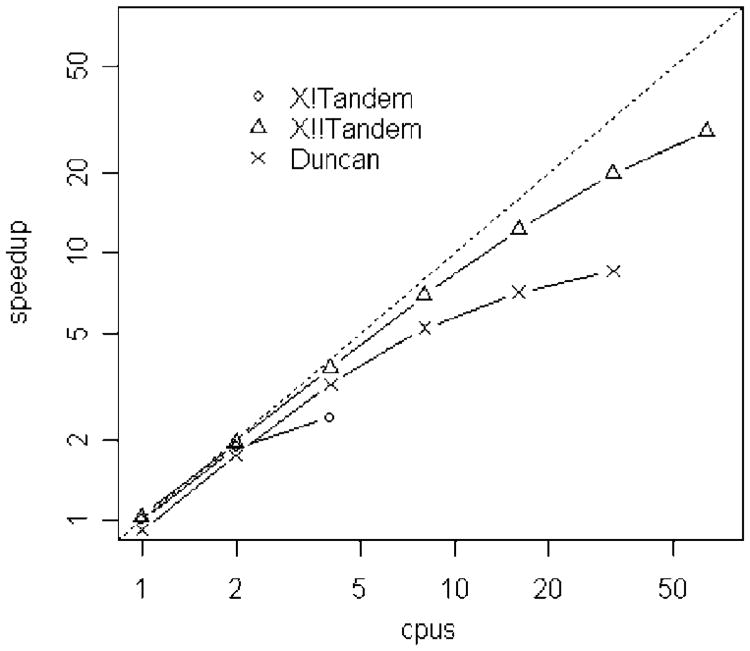
Figure 3 shows the same data as speedup, as compared to the sequential time of the X!Tandem, again plotted log–log. Note that the log–log plot, though allowing all the data to be clearly seen, has the effect of making the speedup curves seem better than they are. For example, although the X!!Tandem speedup curve looks nearly straight, the actual 64 CPU speedup is ∼29 fold.
Figure 3.
Speedup of the X!Tandem, X!!Tandem, and Duncan methods, plotted log–log. Higher is better. The dotted line indicates perfect speedup versus sequential X!Tandem.
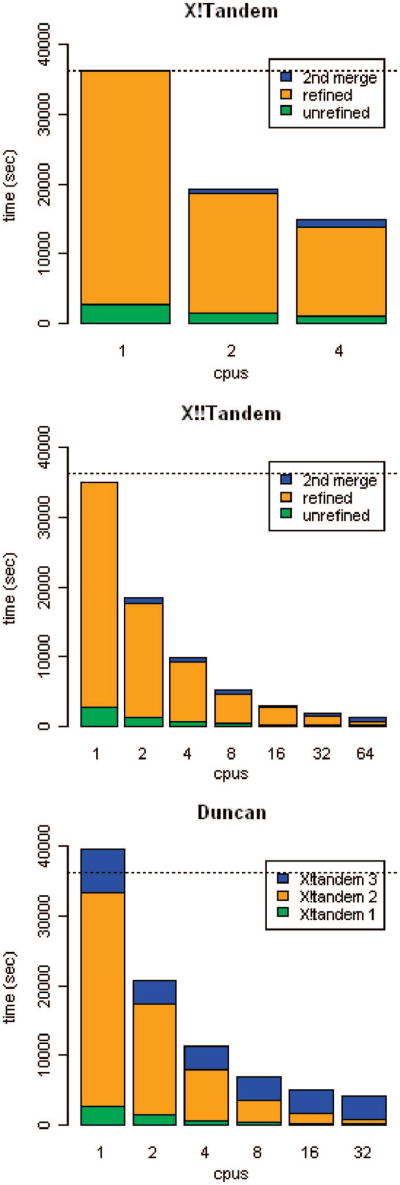
Figure 4 breaks the runtimes into their major components, giving some insight into the relative costs of each. The X!Tandem data shows that the refinement step dominates the computation, with the merge steps representing relatively little time (the first merge step is so small that it is not visible). The reason for the relatively poor performance on 4 CPUs is unclear, although we suspect that the machine was experiencing contention when all CPUs were busy. The X!!Tandem data shows that the unrefined and refined steps scale nicely as the number of CPUs increases, and the second merge time only begins to dominate at 64 processors. Here, too, the first merge is so small as to be invisible. The Duncan data show very clearly that method's problem with scaling to large numbers of CPUs; although the first two (parallel) invocations of X!Tandem scale well, the third invocation, which is run as one instance of X!Tandem (using two threads when the overall run uses more than one CPU) to obtain proper scoring, dominates as the number of CPUs increases. In fairness, it is possible to run the Duncan method omitting this third invocation, which will produce results with incorrect expectation scores but does improve both the absolute runtime and scalability substantially.
Figure 4.
Breakdown of the X!Tandem, X!!Tandem, and Duncan methods, showing the time spent in each step. Steps that are too small to see are omitted. X!Tandem and X!!Tandem methods break down into unrefined and refined search steps, each followed by a communication/merge step. The Duncan method is quite different, consisting of 3 separate steps requiring invocations of X!Tandem, separated by runs of utility programs. The dotted line represents sequential X!Tandem runtime.
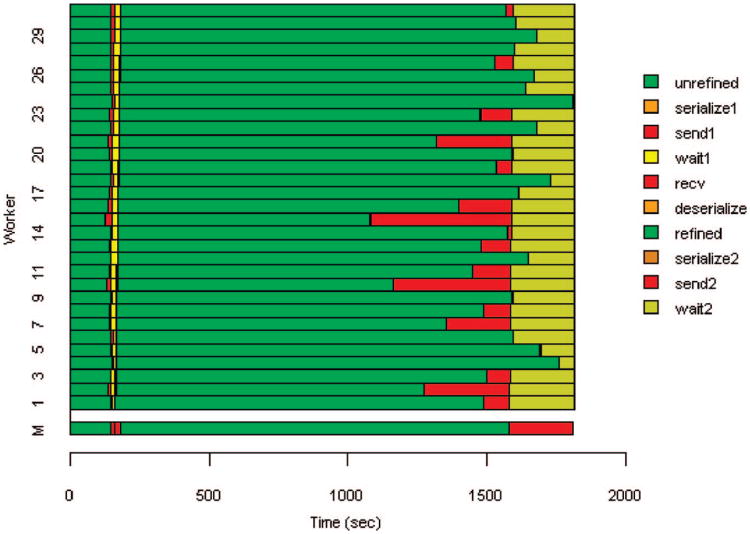
We further investigated the scaling properties of X!!Tandem by performing a 32-CPU run with instrumentation added to determine the time each worker spent performing useful computation, overhead activities (serialization and communication) and waiting due to load imbalance. The results are summarized in Table 3 and Figure 5. Figure 5 highlights the problem of load balance, particularly following the refinement phase. Note that the time spent in the send 2 phase is almost entirely due to load imbalance, since buffering limitations force MPI to delay the worker's send until the master is ready to receive the data. Sends that occur after the master is ready to receive (e.g., worker 20) take almost no time. Table 3 aggregates the time spent on all CPUs. Also note that the aggregate computation time is greater for the parallel run than the uniprocessor run; we attribute this to processing and I/O that is duplicated due to the parallelization strategy employed.
Table 3. Breakdown of Time Spent by X!!Tandem Workers on Various Activitiesa.
| wallclock Times (sec) | |
|---|---|
| uniprocessor | 35105 |
| 32 CPUs | 1814 |
| cumulative times for 32 CPUs (sec) | |
| total | 58054 |
| computation | 48206 |
| overhead | 627 |
| load imbalance | 9221 |
Time spent on send2 is considered load imbalance.
Figure 5.
Execution timeline for 32-CPU run, showing the various processing phases for the workers and master (shown as M). Send/recv and serialize/deserialize are reversed for the master. The serialize/deserialize steps are too short to be visible.
Optimizing load balance is a difficult problem given X!Tandem's decomposition strategy, which was leveraged in X!!Tandem. It requires that the spectra be subdivided into disjoint sets at the beginning of the computation, and that these subsets remain fixed through the entire computation. This prevents dynamic load rebalancing as the cost of computing individual spectra is determined. Unfortunately, spectra vary greatly in the computation they require (for example due to varying loci of PTMs). It is possible that a heuristic could be developed that would estimate the cost of each spectrum a priori. The estimates would be used to create subsets of putatively equal computation.
X!!Tandem was also tested using a custom scoring mechanism, via X!Tandem's plugin scoring feature. We obtained the k-score plugin18 from CPAS19 and used it to score the same spectra/database combination described in the Methods and Materials section. We found that the output files were identical to those generated by X!Tandem. The only modification required by plugin scoring was the addition of a small amount (less than 10 lines) of code to the plugin code, extending the serialization routine for the scoring object, which was subclassed in the plugin.
Conclusion
New mass spectrometers, which are generating greater numbers of high-quality spectra in a shorter period of time, along with intensified interest in post-translational modification of proteins, are imposing significantly greater demands on protein identification software. We have addressed this need by implementing a simple, efficient, distributed-memory parallelized version of X!Tandem. By employing a low-impact Owner Computes technique, we were able to create X!!Tandem, a parallel version of X!Tandem that demonstrated excellent speedup on an example data set, reducing a computation that took 10 h on a single CPU to 21 min on 64 CPUs, a nearly 29-fold speedup. In addition, it is substantially the same as the original code, is run in the same manner, and produces identical output. Because the code is parallelized using a standard message-passing library, MPI, it can be run on comparatively inexpensive networks or clusters of commodity processors. The source code has been made freely available via the same open-source license as X!Tandem.
Beyond this particular program, the authors have found the Owner Computes technique used to parallelize X!Tandem to be extremely useful for complex codes that are not otherwise easily parallelized.
Acknowledgments
This research was supported by the Yale Center for High Performance Computation in Biology and Biomedicine and NIH grant: S10_RR019895, which funded the cluster. This research was also supported in part with Federal funds from NIDA/NIH grant: 1 P30 DA018343. We thank Dexter Duncan for his assistance with Parallel X!Tandem. We gratefully acknowledge Daphne Geismar for figure design.
References
- 1.Eng JK, McCormack AL, Yates JR. An approach to correlate tandem mass spectral data of peptides with amino acid sequences in a protein database. J Am Soc Mass Spectrom. 1994;5(11):976–989. doi: 10.1016/1044-0305(94)80016-2. [DOI] [PubMed] [Google Scholar]
- 2.Perkins DN, Pappin DJ, Creasy DM, Cottrell JS. Probability-based protein identification by searching sequence databases using mass spectrometry data. Electrophoresis. 1999;20(18):3551–3567. doi: 10.1002/(SICI)1522-2683(19991201)20:18<3551::AID-ELPS3551>3.0.CO;2-2. [DOI] [PubMed] [Google Scholar]
- 3.Craig R, Beavis RC. A method for reducing the time required to match protein sequences with tandem mass spectra. Rapid Commun Mass Spectrom. 2003;17(20):2310–2316. doi: 10.1002/rcm.1198. [DOI] [PubMed] [Google Scholar]
- 4.Craig R, Beavis RC. TANDEM: matching proteins with tandem mass spectra. Bioinformatics. 2004;20(9):1466–1467. doi: 10.1093/bioinformatics/bth092. [DOI] [PubMed] [Google Scholar]
- 5.Duncan DT, Craig R, Link AJ. Parallel tandem: a program for parallel processing of tandem mass spectra using PVM or MPI and X!Tandem. J Proteome Res. 2005;4(5):1842–1847. doi: 10.1021/pr050058i. [DOI] [PubMed] [Google Scholar]
- 6.Geist A. PVM: parallel virtual machine: a users' guide and tutorial for networked parallel computing. MIT Press; Cambridge, MA: 1994. [Google Scholar]
- 7.Snir M. MPI–the complete reference. 2nd. MIT Press; Cambridge, MA: 1998. [Google Scholar]
- 8.mpi-forum. www.mpi-forum.org.
- 9.Yale HPC. http://www.med.yale.edu/hpc.
- 10.European Bioinformatics Institute. ftp://ftp.ebi.ac.uk/pub/databases/IPI/current.
- 11.Kersey PJ, Duarte J, Williams A, Karavidopoulou Y, Birney E, Apweiler R. The International Protein Index: an integrated database for proteomics experiments. Proteomics. 2004;4(7):1985–1988. doi: 10.1002/pmic.200300721. [DOI] [PubMed] [Google Scholar]
- 12.X!!Tandem FTP site. ftp://maguro.cs.yale.edu/Projects/Tandem.
- 13.Beavis R. Personal communication. 2007 [Google Scholar]
- 14.Carriero N, Gelernter DH. Some simple and practical strategies for parallelism. In: Heath MT, Schreiber RS, Ranade A, editors. Workshop on Algorithms for Parallel Processing. Springer: Institute for Mathematics and its Applications, University of Minnesota; 1996. pp. 75–88. [Google Scholar]
- 15.Carriero N, Osier MV, Cheung KH, Miller PL, Gerstein M, Zhao H, Wu B, Rifkin S, Chang J, Zhang H, White K, Williams K, Schultz M. A high productivity/low maintenance approach to high-performance computation for biomedicine: four case studies. J Am Med Informatics Assoc. 2005;12(1):90–98. doi: 10.1197/jamia.M1571. [DOI] [PMC free article] [PubMed] [Google Scholar]
- 16.Boost library. www.boost.org.
- 17.Duncan D. Personal communication. 2007 [Google Scholar]
- 18.MacLean B, Eng JK, Beavis RC, McIntosh M. General framework for developing and evaluating database scoring algorithms using the TANDEM search engine. Bioinformatics. 2006;22(22):2830–2832. doi: 10.1093/bioinformatics/btl379. [DOI] [PubMed] [Google Scholar]
- 19.CPAS. https://proteomics.fhcrc.org/CPAS.


