

In recent years, several proteomic methodologies have been developed that now make it possible to identify, characterize, and comparatively quantify the relative level of expression of hundreds of proteins that are coexpressed in a given cell type or tissue, or that are found in biological fluids such as serum. These advances have resulted from the integration of diverse scientific disciplines including molecular and cellular biology, protein/peptide chemistry, bioinformatics, analytical and bioanalytical chemistry, and the use of instrumental and software tools such as multidimensional electrophoretic and chromatographic separations and mass spectrometry. In this unit, some of the common protein profiling technologies are reviewed, along with the accompanying data analysis tools that are available to help interpret the resulting data. A summary of abbreviations used is provided in Table 13.1.1.
Table 13.1.1.
List of Commonly Used Abbreviations
| Abbreviation | Definition |
|---|---|
| dB | Database |
| 2DGE | Two-dimensional gel electrophoresis |
| CF | Chromatofocusing |
| DIGE | Differential (fluorescence) gel electrophoresis |
| ESI | Electrospray ionization |
| FFE | Free-flow electrophoresis |
| FTMS | Fourier transform mass spectrometer |
| HPLC | High-performance liquid chromatography |
| HT | High throughput |
| ICAT | Isotope-coded affinity tag |
| IEF | Isoelectric focusing |
| IMAC | Immobilized metal-affinity chromatography |
| IT | Ion trap |
| iTRAQ | Applied Biosystems trademark name for multiplexed isobaric tagging technology for relative and absolute quantitation |
| LC | Liquid chromatography |
| LIMS | Laboratory Information Management Systems |
| MALDI | Matrix-assisted laser desorption/ionization |
| MS | Mass spectrometry |
| MS/MS | Tandem mass spectrometry |
| MudPIT | Multidimensional protein identification technology |
| NPS | Nonporous silica |
| PhIAT | Phosphoprotein isotope-coded affinity tag |
| PMF | Peptide mass fingerprint |
| PPV | Positive predictive value |
| PTM | Post-translational modifications |
| Q and S | Preparative anion (Q) and (S) cation exchange protein chromatography |
| QTOF | Quadrupole time-of-flight |
| RP | Reversed-phase |
| SBEAMS | Systems Biology Experiment Analysis System |
| SCX | Strong cation-exchange chromatography |
| SDS-PAGE | Sodium dodecyl sulfate polyacrylamide gel electrophoresis |
| SEC | Size-exclusion chromatography |
| SELDI | Surface-enhanced laser desorption ionization |
| SILAC | Stable isotope labeling by amino acids in cell culture |
| SPDBC | Simultaneous Peak Detection and Baseline Correction |
| SPF | Simple peak finding |
| TOF | Time-of-flight |
| YPED | Yale Protein Expression Database |
One of the most fundamental approaches to understanding the functions of individual proteins in complex cellular processes is to correlate protein expression levels with biological changes, e.g., differentiation, growth conditions, cell-cycle stage, disease state, or an external stimulus (Fig. 13.1.1). Although DNA microarray analysis offers a massively parallel approach to genome-wide mRNA expression analysis, there is often no direct relationship between the in vivo concentration of an mRNA and its encoded protein. Differential rates of translation of mRNAs into protein and differential rates of protein degradation in vivo are two examples of factors that may confound the extrapolation of mRNA to protein expression profiles. Gygi et al. (1999a) estimated that the correlation between protein and mRNA abundance for yeast is only 0.4. They found yeast genes with similar mRNA levels that had protein levels that differed by 20-fold. Conversely, they found invariant, steady-state levels of proteins which had mRNA levels that varied by 30-fold, similar to the >10-fold range observed by Futcher et al. (1999). A more recent study found that protein concentrations in yeast can vary by >100-fold for a given mRNA concentration (Greenbaum et al., 2003). Protein expression analysis thus offers a potentially large advantage in that it measures the level of the biological effector protein molecule. Moreover, microarray analysis cannot detect, identify, or quantify post-translational protein modifications, which often play a key role in modulating protein function. Additionally, microarray analysis is not suitable for monitoring the most complex human proteome, the serum/plasma proteome. Because cells release proteins into the blood stream, the serum/plasma proteome provides a unique and readily available resource to monitor changes occurring throughout the human body. However, the 1010 range in plasma protein concentrations (i.e., from 0 to 5 pg/ml for interleukin 6 to 35 to 50 mg/ml for albumin) and the potential occurrence of an estimated 10 million or more immunoglobulin sequences, make elucidation of the plasma proteome a daunting challenge (Anderson and Anderson, 2002).
Figure 13.1.1.
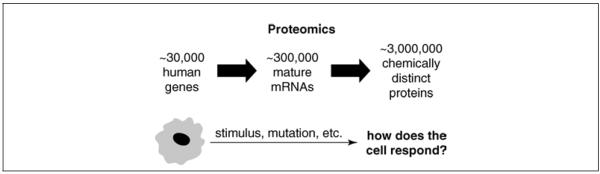
Increasing complexity from the genome to the proteome (adapted from National Heart, Lung, and Blood Institute; courtesy, Susan Old and Tom Kodadek).
Recent advances in technology, instrumentation, molecular biology, and bioinformatics have made it possible to begin to analyze entire units of cellular components, such as the genome, transcriptome, and more recently, the proteome. These advances provide the opportunity to begin to monitor changes in human tissue proteomes that are associated with differentiation, apoptosis, disease, and other important biological modifiers. The ultimate goal of proteomics is to comprehensively identify all proteins, their associated biological activities, post-translational modifications, and protein-protein interactions occurring in a given cell, and determine how this “proteome” is altered in response to a modifier. Two of the factors that contribute to the enormity of the challenge of proteomics and the very modest progress to date are the 100-fold increased level of complexity of the proteome as compared to the genome (Fig. 13.1.1) and the estimated 1010 dynamic range of protein concentrations.
Despite major technological improvements, advances in understanding of the human proteome so far have been modest. As one quantitative example, the annual rate of FDA-approved plasma protein–based clinical diagnostic assays has actually declined over the last 10 years (Fig. 13.1.2). This clearly at odds with popular expectations that advances in “genomics and proteomics are transforming the clinical landscape through diagnostic application of knowledge on large numbers of new proteins” (Anderson and Anderson, 2002). The authors of this unit believe that one of the major reasons for the slow rate of progress in the development of protein diagnostics is that the simple test paradigm often used in current practice—i.e., that the change in concentration of a single protein will be able to serve as a marker for the unambiguous diagnosis of a disease—does not adequately account for biological diversity and the pleiotropic causes and effects of many diseases. In this regard it is worthwhile to recall the successful DNA microarray research carried out on predicting the outcome of breast cancer. When comparing mRNA expression profiles from biopsies of 98 primary breast cancers that either had or had not metastasized within 5 years of diagnosis, Van’t Veer et al. (2002) found that 5,000 of 25,000 genes interrogated were differentially regulated (i.e., with at least a two-fold difference and a p value of less than 0.01 in more than five tumors) between these two groups. Using a supervised classification methodology, they identified a gene expression signature strongly predictive of a short interval to distant metastases. They found that a classification system based on 70 genes outperformed all clinical variables in predicting the likelihood of distant metastases within five years. The odds ratio for metastases among tumors with a gene signature associated with a poor prognosis, as compared with those having a signature associated with a good prognosis, was ~15 using a cross-validation procedure. These results suggest that, while a fundamental biological change like cancer is likely to alter the relative level of expression of thousands of proteins in a given tissue type, only a small subset of these changes will be sufficiently robust to be predictive in large numbers of patients. Furthermore, these data suggest that proteomic technologies capable of analyzing large numbers of samples, like those based on the high throughput of tandem MS instruments such as matrix-assisted laser desorption/ionization time-of-flight/time-of-flight (MALDI-TOF/TOF; Henzel and Stults, 1996), and statistical approaches capable of identifying and classifying samples based on the relative expression of 25 or more biomarkers, are likely to prove the most useful.
Figure 13.1.2.

Declining rate of introduction of new plasma protein analytes in FDA-approved clinical tests (adapted from Anderson and Anderson, 2002, with permission from the American Society for Biochemistry and Molecular Biology).
While present technologies are still far from being able to fully characterize the human proteome in any cell type or biological fluid, current scientific tools have nevertheless progressed to the level where it is now possible to identify, characterize, and comparatively quantify hundreds of proteins within a biological sample. An array of different experimental techniques are now available and are being utilized (e.g., sample handling, prefractionation, separation, mass analysis); some of these commonly used protein-profiling technologies are highlighted in the experimental flow chart in Figure 13.1.3. The available technologies can be separated into three steps. The first step involves the generation, enrichment, analysis, and/or isotopic labeling of the extracted proteins. The next step involves the generation of peptides for mass spectrometric analysis. Additionally, at this level, peptides can be either isotopically labeled for quantitation or subjected to specialized chemistries or preliminary affinity-capture technologies for further enrichment. Finally, MALDI, surface-enhanced laser desorption/ionization (SELDI), and electrospray ionization (ESI)–based MS and MS/MS instrumentation, with additional use of in-line nanoscale chromatography, provide extremely useful platforms to help support all of these approaches. Although there are numerous possible approaches to protein profiling, this unit will briefly overview and then describe in more detail the technologies summarized in Table 13.1.2, which the authors believe to include the most commonly used technologies.
Figure 13.1.3.

Block diagram of commonly used protein profiling workflows in mass spectrometry. The workflow is divided in to three basic categories and generally flows from proteins to peptides, and to LC and MS strategies. Examples of individual techniques within the categories are described in blocks, and possible workflow combinations are connected with arrows. Refer to Table 13.1.1 for a list of abbreviations.
Table 13.1.2.
Overview of Current Proteome Profiling Technologies
| Technology | Labeling required | Detects post-translational modifications? |
Proteins that are optimally quantified |
Approximate dynamic range |
Max. number of proteins or spots quantified |
Analytical issues |
|---|---|---|---|---|---|---|
| SELDI or MALDI-MS disease biomarker discovery |
None | Yes | Naturally occurring forms of <10 kD proteins |
25 | Not applicable | Separate experiment required for protein identification |
| Traditional 2-D gel electrophoresis (2DGE) |
None | Yes | Naturally occurring forms of 10- to 200-kD proteins |
1,000 | 3,000 | Quantitation and replication difficult |
| Amersham differential 2-D fluorescence gel electrophoresis (DIGE) |
In vitro with Cy-2, -3, or -5 fluorophores at primary amines |
Yes | Naturally occurring forms of 10- to 200-kD proteins |
10,000a | ~3,000b | Detects proteins expressed at the upper 104 to 105 of dynamic range, that have long half-livesa,c and are soluble under 2-D running conditions |
| Proteome Lab PF 2-D automated 2-D chromatofocusing/ reversed-phase HPLC |
None | Yes | Naturally occurring forms of >5 kD peptides and proteins |
100d | 2,500d | Limited to UV detection unless coupled to MS |
| Multidimensional LC/MS/MS protein identification (MudPIT) |
Not required, but indiscriminate peptide tagging chemistries can be used |
Yes | Tryptic peptides from digests of protein extracts |
10,000e | 872f | Mixture highly complex, requires fractionation prior to MS |
| Acid-labile isotope coded affinity tag (ICAT) - LC/MS |
In vitro with C12/C13 cleavable ICAT reagent at cysteine |
No | Cysteine-containing tryptic peptides from digests of protein extracts |
10,000 | 496g | Only detects cysteine-containing proteins; cannot generally detect post-translational modifications |
At the protein level, one of the most widely used profiling approaches is two-dimensional gel electrophoresis (2DGE; Harper et al., 1998) followed by in-gel proteolysis of selected protein-containing spots and subsequent peptide mass spectrometric analysis (i.e., peptide mass fingerprinting). Although high resolution, relatively low instrument cost, and the ability to detect many protein post-translational modifications are among the advantages of 2DGE, the approach is limited in its throughput and quantitative reproducibility when compared to other proteomic platforms, and is less amenable to the analysis of more hydrophobic proteins and species that have very basic or acidic isoelectric points. However, the challenge of accurately comparing protein spots from multiple gels has been addressed by recent technical advances that use multiple fluorescent dyes to differentially label protein samples, termed differential (fluorescence) two-dimensional gel electrophoresis (DIGE; Lilley, 2002). This technology provides an elegant solution to the challenge of using 2DGE to accurately quantify and compare protein expression of up to three samples on a single gel, or multiple samples across multiplexed gels linked by a prelabeled, pooled internal standard (Unlu et al., 1997; Patton, 2000, 2002). Combining the isoelectric focusing (IEF) or chromatofocusing (CF) and fast nonporous silica–based reversed-phase chromatography techniques in series, Lubman and his coworkers developed a two-dimensional non-gel-based protein separation method that analyzes proteins in solution in their intact forms. With this approach, more MS analysis choices both at the protein and peptide level are available for identification of proteins and biomarkers (Chong et al., 2001; Zhu et al., 2003a,b; Hamler et al., 2004).
Most mass spectrometric approaches to proteome profiling begin with proteolysis of complex protein extracts. As will be discussed in the following sections, multidimensional protein identification technology (MudPIT; Link et al., 2003; Washburn et al., 2001) has become the method of choice for identifying complex mixtures of proteins directly from their proteolytically cleaved peptides. This “shotgun” approach can also be used to determine the relative abundance of digested proteins from cells or tissues sampled from different biological states. Quantitation is achieved by measuring the intensity differences of the peptides from the different sample pairs. To differentiate the mass measurement, generally, peptides in one sample set are altered with stable isotopes, making them “heavier” than the ones in the other sample set. For example, in both the original solution-based and acid-cleavable solid-phase-based isotope coded affinity tag (ICAT) approaches (Gygi et al., 1999b; Zhou et al., 2002b; Li et al., 2003), cysteine-containing proteins are first modified with isotopically different linkers, then the isolated cysteine-containing digested peptides are analyzed by tandem MS. In other approaches, 13C stable isotope labeling by amino acids in cell culture (SILAC) is used to determine expression ratios between “heavy” and “light” peptides grown in two different cell cultures (Ong et al., 2002). A similar but less effective stable-isotope approach had also been used in yeast by growing the cells with 15N containing reagents in the culture medium (Oda et al., 1999).
The separation methodologies that lend power to the specific ionization and mass spectrometry techniques within the widely used protein profiling approaches will be discussed below in more detail. Before proceeding, it should be mentioned that there is not yet general agreement on statistically valid criteria for either the MS or MS/MS-based protein identifications that underlie much of proteomics. The authors believe the probabilities that are provided by the Profound and the Protein Prophet algorithms, respectively, are an important step in this direction. Also, while it is often possible to obtain statistically valid data regarding the precision of differential protein determinations (i.e., by analyzing identical technical replicates of aliquots of samples submitted to DIGE or by determining the standard deviations of the “heavy” to “light” isotope ratios of multiple tryptic peptides/protein using the ICAT technology), it is more difficult to judge their accuracy, as the “correct” answer generally is not known. Hence, it is strongly recommended that multiple independent approaches be used to verify important differences in protein expression. In addition, the development of statistically sound and efficient methods to identify disease biomarkers from MS data is an extremely active area of research where there is not yet a consensus regarding the best data-analysis strategy. It is likely that the best statistical methods will be both platform- and data-type-dependent. As in any scientific discipline, statistical methods for proteomics research are ever evolving and improving, driven by advances both in statistical research and in proteomics technologies, leading to more efficient use of biological samples in proteomics research.
GEL-BASED APPROACHES
Traditional Two-Dimensional Gel Electrophoresis
Two-dimensional gel electrophoresis (2DGE) has been in place for some 30 years and is the most widely used methodology for proteomic studies, as it offers the highest practical resolution attainable in protein fractionation. It provides the ability to globally view changes in protein expression, separating complex protein mixtures by orthogonally combining the independent parameters of charge (through isoelectric focusing) and size (through SDS polyacrylamide electrophoresis). The recent resurgence of 2DGE is due largely to new developments in mass spectrometry, the availability of genomic DNA sequences, and the development of high-performance gel image-analysis software. Used with a variety of mass spectrometry–friendly dyes such as Coomassie Blue, as well as the Molecular Probes dyes Sypro Ruby for total protein visualization, Pro-Q Diamond for phosphoproteins, and Pro-Q Emerald for glycoprotein, 2DGE gives a spatiotemporal picture of the complex and dynamic patterns of protein expression within a given biological sample and offers a means to directly compare samples subjected to different conditions or treatments. Combined with in-gel trypsin digestion followed by mass spectrometry as the means to identify proteins in spots of interest down to nanogram levels of detection, 2DGE represents a major platform for studying the proteome. While 2DGE offers a very attractive and economical option for protein profiling because of its low capital-equipment cost, a high level of expertise is needed to obtain reproducible gels. Two-dimensional gel electrophoresis also is generally limited to proteins that are between ~10 to 200 kDa in size and that are neither too acidic or basic nor too hydrophobic. Additionally, this approach detects only those proteins expressed at relatively high levels and that have long half-lives (Gygi et al., 1999a, 2000). In one study using 40 μg yeast lysate, the average protein abundance detected was 51,200 copies per cell, with no proteins detected with abundances less than 1,000 copies per cell (Gygi et al., 2000). Given that 1,500 spots were resolved on a 1.0-pH-unit gel (Gygi et al., 2000), several gels covering different pH ranges would be needed to optimally resolve a whole-cell lysate. Robotics are available for automatically picking protein spots (that meet user defined criteria) after image analysis, for carrying out in-gel tryptic digests on these spots, and for spotting the resulting tryptic peptides onto MALDI target plates. Robotics offer some degree of higher throughput depending on the number of robotic units available. Newer tandem MALDI MS instruments (TOF/TOFs) have very high throughput capabilities and also offer MS sequence analysis as well. ESI-based tandem MS systems may not have as high throughput capabilities as MALDI-TOF/TOF, but do provide advantages for characterizations of complex mixtures of proteins when coupled to online nanoscale chromatographic techniques (i.e., MudPIT). The recent availability of high-performance software for image analysis of stained protein spots has considerably improved the effectiveness of the 2DGE analytical approach, as will be discussed below. In this regard, a wide range of software products are currently offered by several manufacturers.
Differential 2-Dimensional Fluorescence Gel Electrophoresis (DIGE)
The DIGE technique utilizes up to three mass- and charge-matched, spectrally resolvable fluorescent dyes (e.g., Cy2, Cy3, and Cy5) to label a control and two different protein samples in vitro prior to 2DGE. The quantitative and qualitative reproducibility disadvantages present with the conventional 2DGE are overcome by running both the control and experimental samples on the same polyacrylamide gel. These samples are then imaged separately, but can be perfectly overlaid without concern for frequently encountered gel distortions and the requirement for “warping” of multiple gel images. The confidence and error margins with which protein changes between the samples can be detected are substantially improved. For example, Tonge et al. (2001) showed that, for large-volume spots, as little as 1.2-fold changes in relative protein expression levels can be detected. Robotics may be implemented, substantially reducing the need for manual spot excision and in-gel digestion. The fluorescence-based detection used with DIGE has a wide dynamic range of 104 to 105. To the extent that the amount of proteins in a given spot is between 0.25 ng to 1 ng, relatively low-copy-number proteins can be detected (Tonge et al., 2001). This detection limit compares very favorably with classical silver staining (Tonge et al., 2001; Gharbi et al., 2002). As a result of the favorable detection limits and wide dynamic range, a minimal amount of proteins can be labeled and loaded on to analytical-scale gels. For example, when minimal-type Cy dyes are used, as little as 50 μg of total protein can be loaded with ~5% of the proteins being labeled on a single lysine site via a covalent amide linkage. Furthermore, this amount can be reduced to ~5 μg when all the proteins in the sample are labeled with the recently introduced saturation Cy dyes, which label all available cysteines on each protein with a covalent thioether linkage. As the sensitivity of the Cy dye–labeled proteins is comparable to that obtained with silver or Sypro Ruby stains, it should in theory be possible to identify by MS even the faintest spots (~1 ng/spot or ~20 fmol of a 50-kDa protein). However, the practical limitations of quantitatively picking the entire spot, as well as inefficiencies of the digestion/extraction procedure and subsequent recovery, make this limit unrealistic. Loading additional unlabeled sample would proportionally increase the probability of extracting sufficient amounts of protein to identify lower-intensity spots by MS. Data from Zhou et al. (2002a) suggest that the identification success rate can be increased by increasing the loading amount and directing the gel spot picking with additional Sypro staining of the proteins. In this study, the relative level of expression of ~1,050 protein spots was compared in 250,000 laser-dissected normal versus esophageal carcinoma cells. When a 200-μg amount of lysate was used, this analysis identified 58 spots that were up-regulated by more than 3-fold and 107 that were down-regulated by more than 3-fold in cancer cells. It is of note that Cy dye labeling is a mass-action process and that the dynamic range of ~104 to 105 afforded by the dyes would not be sufficient to detect low-abundance proteins in samples like human serum that have a dynamic range of protein concentrations estimated to be ~1010 to 1012. Thus, to detect lower-abundance proteins in serum, it would be necessary to either prefractionate the serum or deplete the sample of high-abundance proteins (i.e., albumin) before labeling.
One-Dimensional Gel Electrophoresis
The use of one-dimensional sodium dodecyl sulfate polyacrylamide gel electrophoresis (1-D SDS-PAGE) combined with both MS and/or tandem MS protein identification is a good middle ground between the 2-D gel approaches and non-gel-based multidimensional chromatographic approaches (to be covered in subsequent sections of this unit). For example, proteins that cannot be separated in conventional 2-D gels due to their very high or low isoelectric points can be prefractionated by 1-D gels to increase the likelihood of identification. Using complimentary protein-identification techniques, Edmondson et al. (2002, 2004) demonstrated that one can substantially simplify the overall protein-profiling process while increasing the numbers of identified proteins. Ong et al. (2003) have shown that under optimal conditions, 1-D SDS-PAGE can be used for quantitating proteins to within 5% relative standard deviation with isotopically enriched cell cultures. Some approaches have also simplified the biological samples by isolating a particular cellular fraction or organelle. For example, Taylor et al. (2003a) were able to catalog 615 distinct mitochondrial proteins by looking extensively at highly purified mitochondria from human heart. In another example, Beausoleil et al. (2004) have used ten regions of the preparative 1-D SDS-PAGE gel from a nuclear HeLa cell prep to identify 967 proteins with 2002 phosphorylation sites, employing a subsequent 2-D tandem MS approach. In general, most 1-D gel approaches are similar to those of 2-D gel approaches where similar in-gel digestion protocols are used. Although both MALDI-TOF MS or tandem LC-MS techniques would be sufficient to identify proteins in individual spots from 2-D gels, tandem MS in conjunction with at least one-dimensional reversed-phase (RP) LC would be necessary to identify the highest possible number of proteins from 1-D gel slices obtained from the separation of complex cell fractions or organelle extracts.
NON-GEL BASED APPROACHES
Multi-Dimensional Chromatography-Based Profiling of Intact Proteins
Multidimensional liquid-phase separations of intact proteins have emerged as in-line solution-based alternatives to two-dimensional gel electrophoresis for separation and quantitation of proteins prior to mass spectrometric identification of proteins. A recent review (Wang and Hanash, 2004) outlines these different approaches, with two (Bushey and Jorgenson, 1990; Opiteck and Jorgenson, 1997; Opiteck et al., 1998) and even three-dimensional (Wall et al., 2002) in-line separations being carried out prior to mass spectrometric analysis. One of the most promising approaches has been chromatofocusing followed by nonporous reversed-phase HPLC (Chong et al., 2001), which has been used to compare breast (Chong et al., 2001), ovarian (Wang et al., 2002), prostate, and colon cancer samples (Yan et al., 2003a,b). With recently available commercial systems (Beckman Coulter Proteome Lab PF2d System), two-dimensional liquid chromatographic (2DLC) approaches to protein profiling are more amenable to automation than 2DGE. In the first dimension, chromatofocusing allows proteins to be focused into distinct fractions based on each protein’s isoelectric point (pI). Subsequently, each pI-focused fraction is further separated using nonporous silica (NPS)-RP-HPLC, which separates proteins based on their surface hydrophobicity. The NPS, as opposed to conventional porous chromatographic stationary phase silica media, allows much faster separation and detection of proteins when coupled to fast “scanning” ESI TOF-based mass spectrometers (Banks and Gulcicek, 1997).
A significant advantage of using RP-HPLC is that the mobile phase is volatile, which facilitates using MS to obtain accurate intact-protein molecular-weight information, which can be used to detect post-translational modifications often missed in traditional peptide mass mapping techniques. Additionally, “top-down” MS/MS-based approaches, especially using ESI FTMS (Kelleher, 2004) and even MALDI TOF/TOF tandem MS (Suckau and Resemann, 2003) provide very informative platforms for identifying proteins and their post-translational modifications. With the latter approach, for example, the authors have shown that it is possible to use N- and C-terminal sequencing on a MALDI TOF/TOF platform, termed T3 sequencing, to achieve much higher identification rates of intact proteins. The technique generates N- and C-terminal fragments of the protein by in-source decay in the MALDI source. The fragments, in turn, are selected and sequenced by a TOF/TOF tandem MS process to be searched against protein databases for identification.
Multidimensional Protein Identification Technology (MudPIT)
One of the most common protein-profiling techniques that identifies/sequences peptides directly from complex proteolytic digests is termed multidimensional protein identification technology (MudPIT). The technique utilizes tandemly coupled liquid chromatography columns. Generally, strong cation exchange prefractionation is followed by reversed-phase HPLC separation, and MS/MS analysis (Wolters et al., 2001). MudPIT technology analyzes the entire complex mixture of tryptically digested proteins. A subset of peptides is eluted or fractioned from the cation-exchange column using a step or a continuous gradient of increasing salt concentration. For every salt step or fractioned gradient, the peptides are loaded on to a reversed-phase HPLC column for second-dimension separation and salt removal, and then enter the mass spectrometer for tandem MS/MS analysis. After the first RP gradient is completed, the process may be repeated as many times as needed to match the capacity of the sample amount and complexity. For example, in their studies of the yeast proteome, Washburn et al. (2001) ran three separate fractions (soluble, lightly, and heavily washed insoluble fractions) of about 0.4 to 0.5 mg of proteins each in 15 in-line salt steps and RP-HPLC MS/MS cycles. They identified 5,540 peptides from 1,484 proteins and demonstrated a dynamic range of detection of 10,000. In a comparative study, using 1 mg of yeast proteins, Gygi and his colleagues collected 80 fractions in a single SCX offline gradient chromatography run (Peng et al., 2003). The subsequent reversed-phase chromatography runs with MS/MS resulted in the analysis of 7,537 peptides and 1,504 proteins, slightly more than the original study by Washburn et al. (2001). An interesting observation from these two studies is that they only shared 858 proteins in common, less than half of all the proteins identified. In a more recent effort to extend this method of comparative protein profiling, S. cerevisiae was grown in both 14N and 15N minimal media with 2,167 peptides being identified from 870 proteins. Also, accurate 14N/15N quantitation was determined for each peptide with an average standard deviation of 30% (Washburn et al., 2002, 2003).
Stable Isotope Labeling and Quantitative Protein Profiling
Tandem mass spectral identification and quantitation of peptides by stable isotope coding was first demonstrated by Gygi et al. (1999b) with their isotope-coded affinity tag (ICAT) technique. In contrast to the MudPIT technique, ICAT analyzes a subset of cyteine-containing peptides in a proteolyzed sample using similar 2-D chromatographic techniques with tandem MS. Since its introduction, there has been widespread use of a variety of different isotope coding techniques utilizing unique reactivity features of select amino acid groups in proteins. An extensive examination of these tagging chemistries and other isotope-labeling approaches like SILAC (Ong et al., 2002, 2003) and 18O labeling of peptides with enzymatic cleavage (Yao et al., 2001) to quantitative protein profiling can be found in the review articles of Julka and Regnier (2004) and Zhang et al. (2004). The discussion below concentrates on the use of ICAT as one of the most commonly used quantitative techniques in proteomics.
Isotope-Coded Affinity Tag (ICAT) Quantitative Analysis of Protein Expression
ICAT technology is based on the notion that the comparative level of expression of a protein can be determined mass spectrometrically from the relative concentrations of one or more of its individual tryptic peptides from two different samples. The key element in ICAT technology is a novel chemical reagent that allows affinity selection of the limited number of cysteine- containing peptides in a protein for further two-dimensional chromatographic separation and tandem MS analysis. The chemical reagent consists of a thio-reactive group (for selective labeling of cysteinyl residues), an isotope-containing linker region (which in the first reported ICAT reagent contained either eight 1H or eight 2H for differentiation between control and experimental samples), and a biotin moiety (for affinity-based purification of only cysteine-containing tryptic peptides; Gygi et al., 1999b). Following derivatization of the control protein extract with light ICAT reagent and the experimental extract with heavy ICAT reagent, the pooled samples are subjected to trypsin digestion followed by both cation exchange and avidin chromatography. RP-HPLC and tandem mass spectrometry (LC/MS/MS) is then used to identify ICAT peptide pairs. Quantification of the relative heavy/light ratios is achieved in MS mode.
A nice feature of this approach is that the in vitro incorporation of a stable isotope into one of the two samples being compared obviates the need to separately analyze the control and experimental samples by MS. Although a tryptic digest of a whole-cell human protein extract might produce more than 500,000 peptides, less than 100,000 of these might be expected to contain cysteine. Based on a search of the SwissProt database, less than 5% of human proteins in this database lack cysteine and would therefore be missed (that is, more than 95% of proteins contain at least one predicted cysteine-containing tryptic peptide). ICAT results are analogous to those obtained by the use of two different fluorescent dyes in DNA microarray analysis of mRNA levels or DIGE analysis of protein expression. Using this approach with a single sample, 496 proteins were profiled in microsomal fractions of naive and in vitro–differentiated human myeloid leukemia cells (Han et al., 2001).
Recent efforts have modified the original ICAT linker reagent to use nine 12C/13C atoms (Applied Biosystems, Inc.) for the purpose of reducing the chromatographic retention time-shift effect seen with the original H/D isotopic reagent. Since the light (1H) and heavy (2D) tagged peptides do not coelute on RP-HPLC, this makes it more challenging to accurately integrate each peak over the multiple chromatographic/MS scans that will contain each parent peptide. In contrast, the 12C- and 13CICAT labeled tryptic peptides coelute on RPHPLC. Another recent innovation is covalently linking the reagent to a solid-phase resin. This allows for more stringent washing conditions to more effectively reduce the background of nonspecifically bound peptides that do not contain cysteine and/or have not reacted with the reagent (Qiu et al., 2002; Zhou et al., 2002b; Shi et al., 2003).
It is important to note that stable isotope labeling approaches only provide the relative expression ratios of individual proteins under two conditions; they do not provide absolute protein concentrations, nor do they provide the ratio of the concentration of one protein relative to another in the same or different sample. Finally, it should be noted that ICAT-based profiling technologies are likely to miss the largest differences in protein expression. Hence, if the ratio of expression of a protein in the control versus experimental sample exceeds the dynamic range of a single MS spectrum, which is likely to be in the range of 100- to 1,000, the less abundant species will not be integrated. Unless the spectra for all “singlet” ICAT ions are manually reviewed in a separate experiment, which is not practical, differences in protein expression that exceed 10-fold are likely to be missed with this technology.
The authors of this unit believe that MALDI TOF/TOF tandem MS would provide an excellent platform to bring ICAT-based analysis of protein expression within reach of a far larger number of users. Indeed, conversations with users of ICAT technology confirm that an increasing fraction of analyses are being performed at a higher throughput with the TOF/TOF platform (R. Aebersold, pers. comm.).
Post-Translational Modifications: Phosphoprotein and Glycoprotein Profiling
Phosphoproteome profiling
Reversible protein phosphorylation is probably the most important mechanism used for intracellular signal transduction (Hubbard and Cohen, 1993) and is involved in regulating cell-cycle progression, differentiation, transformation, development, peptide hormone response, and adaptation (Cohen, 1982, 1992; Pawson and Scott, 1997). Since as many as one-third of mammalian proteins may be phosphorylated (Pawson and Scott, 1997), this post-translational modification is among the most important and widespread. Based on the authors’ experience identifying sites of phosphorylation by RP-HPLC, off-line Cerenkov counting of the [32P]-labeled tryptic peptide fractions, MS, and conventional and radioactive Edman sequencing of [32P]labeled proteins submitted to the W.M. Keck Foundation Biotechnology Resource Laboratory, the majority of modifications occur at very low stoichiometry, such that only a very small percentage of the protein substrate is phosphorylated. Because of the low stoichiometry, it is important that studies directed at identifying phosphoproteins and carrying out comparative phosphoproteome profiling incorporate either a phosphoprotein or a phosphopeptide enrichment step.
Enrichment techniques for phosphoproteins are somewhat limited. Although traditional nickel-affinity techniques can be used with suboptimal results due to unspecific binding of other acidic proteins, phosphospecific antibody–based immunoprecipitation techniques (Gronborg et al., 2002; Steen et al., 2002) and recently introduced commercial phosphoprotein affinity kits (Qiagen, http://www1.qiagen.com/literature/handbooks/PDF/Protein/Purification/QXP_PhosphoProtein/1023373HB_QXP_Phos_122002WW.pdf) can be used to enrich for all or for specific classes of phosphoproteins. Phosphopeptides have to be further enriched from a pool of digested peptides, especially because of their lower ionization efficiencies. Some approaches taken for phosphopeptide enrichment utilize chemical derivatization techniques such as the β-elimination/biotin affinity tag approach described by Goshe et al. (2002) and Oda et al. (2001) and recently improved by McLachlin and Chait (2003) and Qian et al. (2003), or the reversible covalent linkage approach described by Zhou et al. (2001). Unfortunately, these enrichment approaches are limited to Ser- and Thr-containing phosphopeptides. The immobilized metal-affinity chromatography (IMAC)-based phosphopep-tide enrichment approach, on the other hand, is capable of enriching for serine-, threonine-, and tyrosine-containing phosphopeptides, and has the capacity to profile large numbers of phosphopeptides. Posewitz and Tempst (1999) compared the performance of the IMAC-based approach with different metal chelates, and this overall approach was significantly improved by methyl esterification as described by Ficarro et al. (2002). The improvement by the esterification process comes mainly from minimizing the unspecific binding of peptides that contain carboxylic amino acid residues.
Recently, several non-IMAC-based techniques have been published that show great promise for enrichment of phosphopeptides. One is based on the use of strong cation exchange chromatography to enrich and fractionate for early-eluting phosphopeptides containing a 1+ solution charge state (Beausoleil et al., 2004). With this approach, the authors identified 967 proteins with 2,002 phosphorylation sites from a nuclear fraction of HeLa cell lysate. Another “IMAC-like” approach demonstrated that TiO2-affinity precolumns can easily be incorporated in front of reversed-phase columns and used as an enrichment medium for phosphopeptides (Pinkse et al., 2004). Recently, Rush et al. (2004) from Cell Signaling Technology in Beverly, Mass. have shown that phosphotyrosine-containing peptides can be selectively enriched from digested cellular extracts with phosphotyrosinespecific antibodies. Although technically not an enrichment process, Knight et al. (2003) have shown that by selectively converting the phosphoserine and phosphothreonine groups to “lysine-like” analogs that can then be cleaved by trypsin, ionization and therefore the MS detection efficiencies of otherwise low-signal-producing phosphopeptides can be improved.
Some of the proposed approaches to phosphopeptide enrichment and identification of their parent proteins also allow for relative quantitation to be done within the same experiment. For example, the phosphoprotein isotope-coded affinity tag (PhIAT) approach differentially labels phosphoserine and phosphothreonine residues by carrying out β-elimination of the phosphate before labeling with a 1,2-ethanedithiol containing either four alkyl hydrogens (EDT-H0) or four alkyl deuteriums (EDT-D4), followed by biotinylation of the EDT-D0/D4 moiety to allow affinity purification (Goshe et al., 2001, 2002). As first suggested by Ficarro et al. (2002), the methyl esterification process can also be used to quantitate identified phosphoproteins by using isotopically labeled methanol as the esterification reagent (He et al., 2004). Another simple approach is to use trypsin digestion in heavy/light water with IMAC enrichment followed by tandem MS analysis (Bonenfant et al., 2003).
Glycoproteome profiling
Protein glycosylation has been shown to play critical roles in cell recognition, regulation, cancer, protein folding, Alzheimer’s disease, muscular dystrophies, and immune responses (Seberger and Chaney, 1999; Helenius and Aebi, 2001; Lowe, 2001; Ahmed et al., 2002; Endo and Toda, 2003). The traditional and most widely used analytical glycobiology treatments involving glycans and lectin affinity chromatography are thoroughly reviewed in Mechref and Novotny (2002). Due to both glycan heterogeneity and complexity, many of the isolation and MS approaches are slow, and are usually limited to purified proteins. 2DGE approaches have been found to be useful for glycoprotein detection in complex samples. By extending their investigations to the glycopeptide level, Kuster et al. (2001) were able to map glycan structures to specific sites. Enrichment methods like hydrophilic interaction liquid chromatography (HILIC) have also enabled the isolation and identification of larger numbers of N-linked glycosylated proteins (Hagglund et al., 2004).
In efforts to incorporate both quantitation and characterization, a new isotope labeling technique has emerged. To label N-linked carbohydrate-containing glycoproteins, sodium periodate is used to convert carbohydrates to aldehydes (Bobbitt, 1956). The converted carbohydrate group is then coupled to a hydrazide resin, while the nonglycosylated proteins are washed away. Next, the glycoproteins are proteolytically digested on the solid resin support and the nonglycosylated peptides are removed by elution. The glycopeptides on the resin, in turn, are isotopically labeled by either light (d0) or heavy (d4) forms of succinic anhydride after the amino groups of lysine are converted to homoarginine. The labeled N-linked glycopeptides are released via peptide N-glycosidase (PNGase F). Subsequent tandem mass spectrometric analysis enables both quantitation and identification of the released peptides to be performed simultaneously (Zhang et al., 2003).
Other Approaches
There are other protein-profiling approaches that are worth noting and that may have broader applications in the near future. Protein enrichment can be achieved using solution-phase isoelectric focusing. Commercial systems are available to enrich proteins in five to eight different fractions based on their isoelectric points in solution (Proteome Systems, http://www.proteomesystems.com; and Invitrogen, http://www.invitrogen.com). Using this technique and 1-D SDS-PAGE, followed by in-gel digestion of multiple gel slices with RPLC-MS/MS analysis, Edmondson et al. (2004) showed that 2,402 proteins, twice as many as were identified by MudPIT using off-line LC, can be identified from mouse liver. Another solution-based isoelectric focusing approach, free-flow electrophoresis (FFE), fractionates large amounts of proteins in a continuous fashion (Moritz et al., 2004). A commercial FFE system (Tecan) is capable of enriching proteins in up to 96 fractions in as narrow as 0.1 pI unit intervals or less.
Other stable isotope peptide chemistries are being developed to simplify and automate “downstream” processes. For example, a very promising multiplexed isobaric peptide tagging reagent called iTRAQ (Applied Biosystems) is now available, which is based on amine-modifying chemistry. This methodology works by quantifying in the MS/MS mode based on the mass differences of the fragment ions from labeled isobaric peptide parent ions. It is possible with this approach to quantitatively compare up to four sample sets in the same MS run (Daniels et al., 2004; Huang et al., 2004). Significant noise reduction in the MS/MS spectra can increase the dynamic range measurement between the isotopically different peptide fragments.
In addition, new experimental designs have emerged that enable proteins of interest to be profiled based on pre-existing knowledge of their sequences. These methods either utilize hypothesis-driven MS approaches (Kalkum et al., 2003; Forbes et al., 2004), targeted proteomics (Pasa-Tolic et al., 2002), or protein browsing (Aebersold 2003a,b), and carry out MS/MS analysis on selected individual peptide ions, based on previously known sequence information of a limited or potentially larger number of proteins.
SELDI/MALDI-MS-BASED DISEASE BIOMARKERS
SELDI/MALDI-MS-based disease biomarker discovery is unique in that it is the only protein-profiling technology currently in use that is directed completely at identifying the relative expression levels of a small number (e.g., 25 to 75) of peptides/proteins that can be used to best differentiate control from experimental/disease samples. SELDI/MALDI MS also has sufficiently high throughput to reasonably analyze the more than 100 samples that are likely to be needed to differentiate biological diversity. Additionally, disease biomarker discovery is unique in that it generally has been used without prior high-resolution separation of the serum, plasma, or other biological fluid or tissue extract analyzed. Most recent studies that relied on the SELDI-TOF-MS (Adam et al., 2002; Issaq et al., 2002) approach use chips with eight or sixteen 2-mm spots that are modified with chromatographic surfaces (e.g., anionic, cationic, hydrophobic, etc) to allow selective adsorption of peptides/proteins directly from the sample of interest. After spotting a few microliters of serum, contaminants and salts are removed by washing with water or volatile buffer. The target is dried after adding a MALDI matrix solution like α-cyano-4-hydroxy-cinnamic acid, dissolved in a volatile solvent (e.g., 50% acetonitrile). Several papers, such as that by Petricoin et al. (2002) on ovarian cancer, have spurred interest in uncovering peptide/protein disease biomarkers that might, for instance, play an important role in early detection. In the Petricoin et al. (2002) study, SELDI-MS analysis of serum from 50 control and 50 case samples from patients with ovarian cancer identified five peptide biomarkers that ranged in size from 534 to 2,465 Da. The pattern formed by these markers was then used to correctly classify all 50 ovarian cancer samples in a masked set of serum samples from 116 patients who included 50 ovarian cancer patients and 66 unaffected women or women with nonmalignant disorders. Of the latter samples, 63 were correctly recognized as not being from cancer patients—thus providing 100% sensitivity (50/50) for detecting cancer, 95% specificity (63/66) for detecting controls, and a positive predictive value of 94% (50/53) for this group of 116 patients. That is, if the five-peptide “ovarian cancer” biomarker pattern was identified in the sample, there was a 94% probability that the patient indeed had ovarian cancer. This approach has been applied to study different types of cancer (ovarian, prostate, breast, bladder, renal, head, and neck cancer; Wadworth et al., 2004), and other diseases (e.g., alcoholism, Nomura et al., 2004; sleeping sickness, Papadopoulos et al., 2004).
Even with the promising results that have been reported in other reasonably large-scale studies of serum samples from breast and prostate cancer patients (Adam et al., 2002; Li et al; 2002), there are at least two major concerns with the Petricoin et al. (2002) study. The first is an issue raised by Rockhill (2002) and others regarding the fact that the very high positive predictive value (PPV) of 94% reported by Petricoin et al. (2002) applies only to their artificial population of 116 patients, of whom 50 had ovarian cancer. When their estimates of sensitivity (100%) and specificity (95%) are applied to an average population of post-menopausal women with an incidence of ovarian cancer of 50 per 100,000, the PPV is reduced to a clinically insignificant value of only 1% (Rockhill, 2002). This correction emphasizes the need for careful scrutiny by statisticians well versed in dealing with experimental profiling data and the resulting conclusions. The second caution is that examination of their raw mass spectral data (Yu et al., 2005) by the authors of this unit suggests that their five biomarkers most likely arise from case-versus-control differences in baselines and noise, rather than from the ionization of serum peptides. These concerns underscore the importance of developing biostatistical as well as visual tools to aid peptide/protein disease biomarker discovery. Despite these caveats, there is considerable value in pursuing and extending the very interesting SELDI-MS approach to protein profiling. In this regard, a more recent study by Wu et al. (2003) extends the SELDI-MS disease biomarker discovery technology to a conventional, higher-performance MALDI-MS platform and utilizes a customized random forest–based algorithmic approach to analyze large datasets. This machine-learning classification method, which combines bagging and random feature selection, will be mentioned again under Sample Classification, below.
It is generally believed that further improvement of biomarker technology will require reliable and reproducible sample fractionation prior to MS analysis, which should help to extend the dynamic range of this technology and the predictive value of the resulting biomarkers. Tempst and his coworkers (Villanueva et al., 2004) recently devised one approach to address this issue. Using liquid-handling robots for magnetic particle–based reversed-phase sample fractionation and a high-resolution MALDI MS platform, they correctly predicted 96.4% of the sera samples as being diseased or normal based on 274 peptide masses. In all, up to 2,000 unique peptides were analyzed without intensity normalization by a commercial microarray clustering data analysis software. Further potential use of chromatographic approaches, as well as higher-performance MS platforms like Fourier Transform (FT) MS (Bergen et al., 2003) with unrivaled mass accuracy and resolution likely will play a key role in the discovery of protein and peptide disease markers (see review by Bischoff and Luider, 2004).
PROTEIN MICROARRAYS
DNA microarray technology has radically changed the way many investigators approach experimental questions in the biological sciences by allowing the simultaneous and economical assay of tens of thousands of genomic features in a single experiment. In contrast, most protein-profiling studies are limited to the analysis of less than 1,000 proteins in a single experiment and the high capital equipment costs, expertise, computational and database-searching requirements, and expense (i.e., see http://keck.med.yale.edu/price.htm#icat) of carrying out even a single ICAT study on a complex cell extract limit these technologies to a relatively few laboratories carrying out a comparatively few studies of whole-cell proteomes. Development of analogous protein microarray methods will be an important complementary approach to the MS-based and other methods discussed above. However, protein microarray technology is in its relative infancy and has many distinct challenges compared to those faced during DNA microarray development. Proteome-wide procedures for microarray manufacture, automated detection, and data analysis are being developed less rapidly. The nature of proteins allows for a diversity of structural motifs that may be shared among many proteins and yet combined in a manner creating a molecule functionally distinct from any other protein, yet bearing cross-reactivity to other proteins. Proteins are also chemically heterogeneous, can be unstable and subject to denaturation, and cannot be amplified. Thus, many new experimental approaches have been and will be necessary to advance this field.
Although the cost of research for fabricating many of these arrays is prohibitive for individual research groups, there are a number of commercial groups, e.g., Protometrix (now Invitrogen, http://www.protometrix.com/) pushing forward into protein microarrays. There have been a number of different research approaches used in the preparation of protein microarrays and in the detection methods employed (MacBeath and Schreiber, 2000; Haab et al., 2001; Madoz-Gúrpide et al., 2001; Zhu et al., 2001; Stears et al., 2003). One attractive technique is the production of antibody microarrays. Typically, a selection of capture antibodies are immobilized onto a glass plate, then the plate is incubated with a cell or tissue extract. BD Biosciences, for example, offers antibody arrays that allow for the analysis of 500 human proteins (http://www.bdbiosciences.com/clontech/archive/APR03UPD/Ab_microarray.shtml). The covalently attached antibodies bind specific antigens in the sample, and these can then be detected by a variety of methods. For example, through the use of differential labeling of protein samples with fluorescent dyes (e.g., Cy3 and Cy5 as used in gene microarray methods), two protein samples can be mixed and comparative levels of specific antigens can be measured. This sort of multiplex analysis has been used to study the relative expression of receptor tyrosine kinases in human tumor cell lines (Nielsen et al., 2003). Bead immunoarray technologies are also available and are being developed to undertake multiplex analysis of cytokines. Using low microliter amounts of fluids, these bead-based methods potentially can analyze 100 cytokines in a single sample. Currently, commercial instruments (e.g., Luminex or BioPlex) can analyze upwards of 15 human cytokines in 10- to 15-μl samples with sensitivities comparable to ELISAs (de Jager et al., 2003).
ANALYSIS OF PROTEIN PROFILING DATA
The complexity of protein analysis can vary greatly depending on the sample-simplification steps chosen prior to MS analysis. In some cases, it may be a simple protein identification step from relatively purified protein mixtures obtained from gels or chromatographic fractions. In other cases, it may be that the proteins are well known recombinant or purified proteins, but they contain post-translationally modified isoforms that need to be characterized and quantified. In situations involving more complex experiments, large-scale profiling and perhaps quantitation of proteins from biological samples in different cellular states may be required. In more recent applications that do not involve the identification of proteins, examination of mass-spectral peptide patterns from biological fluids has been used to uncover biomarkers of potential disease states. Regardless of the complexity of the samples, as a first step, any small- or large-scale MS-based proteomics effort will require a basic set of mass-spectral raw data analysis tools. In addition, when used with MS, gel electrophoresis–based approaches will require the use of quantitative image analysis software to discern distinct protein patterns from the gel background as well as across many gels. Many of the gel-imaging software programs will also have to incorporate some level of two dimensional “triangulation” component to aid in the precise excision of gel spots for further mass spectrometric analysis.
Any routinely used MS instrumentation for peptide and protein analysis generally requires very efficient peak picking, charge-state recognition, and “deisotoping” (selecting the monoisotopic peak) algorithms just to direct data-dependent tandem mass spectral ac quisitions in real time (Fig. 13.1.4). Similar algorithms are also required to compile high-quality parent and fragment mass spectral ion peak lists to be used by many of the public and commercial protein database search algorithms (Table 13.1.3). The high quality of the preliminary spectral analysis algorithms is important to ensure consistent and confident protein identification by the search algorithms. In fact, Venable and Yates (2004) demonstrated that commercial algorithms produce vastly different standard deviations of the confidence scores as a function of normal variations in 1,000 repeated tandem mass spectra. They also confirmed that the quality of the generated data is paramount to obtain consistent and confident protein ID scores. Proper preprocessing and a high quality of generated data are also very important if the data are to be used for disease biomarker discovery (see below). In this case, it is not the search algorithms that have to assign scores to identified peptides and proteins based on the matching of observed versuspredicted mass spectra to an in silico protein database, but, rather, the refined mass spectral data obtained are directly used to generate classified profiles to correctly differentiate “diseased” from “normal” subjects.
Figure 13.1.4.

Block diagram of commonly used proteomics bioinformatic workflows in mass spectrometry. The blocks highlight the algorithmic steps taken to process mass spectral data, to obtain protein sequence, identification, or quantitation, or to evaluate disease markers, and to manage and store data, experimental information, and results. Refer to Table 13.1.1 for a list of abbreviations.
Table 13.1.3.
Publicly and Privately Available Protein Identification and Quantitation Algorithms and Tools Used for Mass Spectrometry Data
From intact proteins: “top-down” approach.
Combines de novo approaches against database searching.
Figure 13.1.4 summarizes the basic bioinformatics workflows that are associated with either MS- or tandem MS–based protein profiling technologies. Although most prominent protein search algorithms like Mascot and Sequest are commercially available as stand-alone applications, no commercial or public system covers the open integration of all aspects of proteomics analysis workflows. For example, a platform would need to tie any experimental raw data with protein ID searches and quantitation results together with protein annotation, data archival, Laboratory Information Management Systems (LIMS), and results query- and report-generation tools under a unified relational database. Most integrated proteomics systems, as shown in Table 13.1.3, are tied to particular manufacturers’ instrumentation software. In general, these systems are very specific to the suite of instruments with which they operate and are not sufficient to provide a broader proteomics search, data-depository, or query tools. As a result, most users both in industry and academia develop customized LIMS to share and evaluate data between different proteomics projects utilizing different instruments. For example, publicly available integrated systems like SBEAMS (Systems Biology Experiment Analysis System; http://db.systemsbiology.org/projects/sbeams/) and systems that are in the process of being developed by the GPM (Global Proteome Machine) Organization (http://www.thegpm.org/) or the Yale Protein Expression Database (YPED, http://info.med.yale.edu/proteome/) provide a common data depository and a stage for querying, testing, and validating MS based proteomics results.
GEL-BASED DATA ANALYSIS
Software for Analysis of 2-D Gel Images
A number of companies provide software packages to analyze stained images of protein spots on 2-D electrophoresis gels, including Nonlinear Dynamics, Bio-Rad, GE Healthcare (Amersham Biosciences), Compugen, Alpha Innotech, Applied Maths, Inc., DECODON, Definiens, and Genomic Solutions. Although many products feature automatic protein spot detection, manual refinement of the analysis is typically still required. Nonlinear Dynamics provides some five products ranging from an entry-level version to an advanced-level version (Progenesis Discovery) that supports statistically driven analysis. The main focus of current available image-analysis software is spot detection and quantitation. All present software packages will detect the protein spots for the user using varying degrees of automated features. Some require the user to set various parameters for doing so, while others use default parameters that users can change if they so desire. Since all companies use proprietary algorithms for detecting spots, their software methodologies vary somewhat. The more advanced software packages are also able to detect some forms of noise on gels as well as determine a threshold for the background on the gels, and all software packages typically have the ability to match a spot on one gel to the corresponding spot on another gel. They also have some form of spot quantitation (pixel number) available so the user can know the relative amount of protein in each spot and is able to assign the molecular weight and pI of each given spot (assuming the range of the pI strip is known and human molecular weight markers were added to the gel). These software packages also allow the user to manually correct the automatically detected spots, as well as to manually correct any spots that the software did not match properly.
Available software applications vary in their ability to warp gels, the amount of spot information collected, the ability to create groups of gels, and the ability to view each protein spot topographically (pseudo-three-dimensionally). Some image analysis software applications are able to warp one gel image to one or more other gels to better facilitate the matching process. This is a useful tool because there may be small spot-location and shape differences between gels. Warping one gel to another can circumvent these variations. In essence, if one gel is warped to another, then the warped gel will overlay on top of the original gel and align in all directions. Comparative analysis and matching of multiple gels are also automatically performed by many of the software packages. Some of the available options match simply by the location of the spot on the gel, while the more advanced software options take into account the size, shape, and intensity of the spot as well. Matching based solely on the x,y coordinates of a spot can be incorrect if no form of warping has been done. Software packages also allow the user to manually edit the matched spots and make changes as required based on visual review. The user can delete a spot or region, split spots into one or more separate spots, join two spots together, or draw a spot if warranted.
Once the spots have been detected and matched, it is often useful to filter out extraneous gel spots or markings in the analysis. Filtering may be employed to eliminate spots that are of too low an intensity for MS analysis, spots that are extremely noisy, or spots left from the stain itself. Software products vary as to features available for filtering. A worthwhile feature of some of the packages is the ability to project spot images on the gel in a pseudo-3-D view. This feature is especially useful for comparative gel analysis as well as for determining the relative amount of protein present in a given spot when compared with all other spot intensities. Some pseudo-3-D applications are much easier to navigate than others. Table 13.1.4 lists the major software packages that are currently available and their associated Web sites. Some of these software applications are sold by multiple vendors.
Table 13.1.4.
2-D Gel Electrophoresis Image-Analysis Software Vendors
| Software product | Vendor | Web site |
|---|---|---|
| Progenesis Discovery | Nonlinear Dynamicsa | http://www.nonlinear.com |
| Image Master 2D | Amersham Biosciences | http://www1.amershambiosciences.com |
| PDQuest | Bio-Rad | http://www.biorad.com |
| Proteomweaver | Definiens | http://www.definiens.com |
| Z3 | Compugen | http://www.2dgels.com |
| Bionumerics2D | Applied Maths, Inc. | http://www.applied-maths.com |
| Delta2D | DECODON GmbH | http://decodon.com |
Sells multiple products including Phoretix, and supplies custom products to other vendors, e.g., Alpha Innotech.
One example of a 2-D electrophoresis gel image–analysis software is Progenesis Discovery, sold by Nonlinear Dynamics. Progenesis Discovery is one of the more comprehensive and high-end software packages available. It has the ability to automatically detect spots from a rather large group of gels. While automatically detecting the protein spots, it is also capable of determining background levels for a given gel. One can create many groups of gels in one analysis, termed averages, and then compare averages to each other. Spots on these average gels are constructed from the average values of each spot on each individual gel that the average is based on. The software has the ability to warp each gel to one master gel, as well as to match each gel to the master gel and to an average gel. The user can manually edit spots using many available options. One can also perform mass deletions of spots in areas not of interest. Filtering can be performed based on any of the multiple parameters available. Progenesis also has a useful montage feature that allows the user to view a selected area of gel from multiple gels simultaneously. This is an extremely useful feature when comparing a given spot in multiplexed gels. Multiple gel spot intensities also can be normalized. Nonlinear Dynamics also offers several other 2DGE image analysis software packages including the Phoretix 2D packages, and also supplies custom products to other vendors, e.g., Alpha Innotech. Table 13.1.5 (not inclusive) compares the software features of seven currently available packages.
Table 13.1.5.
Comparison of Software Features of Products for 2D Electrophoresis Gel Image Analysisa
| Progenesis Discovery |
Image Master |
PD Quest |
Proteome Weaver |
Z3 | BioNumerics2D | Delta2D | |
|---|---|---|---|---|---|---|---|
| Automatic spot detection | Y | Y | Y | Y | Y | Y | Y |
| Create user defined new spots | Y | Y | |||||
| Create program defined new spots | Y | Y | Y | Y | Y | Y | |
| Delete spots | Y | Y | Y | Y | Y | Y | Y |
| Join two spots | Y | Y | Y | Y | Y | Y | Y |
| Split two spots | Y | Y | Y | Y | Y | Y | |
| Warping | Y | Y | Y | Y | Y | Y | |
| Average gels | Y | Y | Y | Y | Y | Y | |
| Grouped gels | Y | Y | Y | Y | Y | Y | |
| Automatic matching | Y | Y | Y | Y | Y | Y | Y |
| Manual matching | Y | Y | Y | Y | Y | ||
| View multiple gels at once | Y | Y | Y | Y | Y | Y | |
| Background subtraction | Y | Y | Y | Y | |||
| Filtering | Y | Y | Y | Y | Y | ||
| Normalization | Y | Y | Y | Y | Y | ||
| 3-D view | Y | Y | Y | Y | Y | Y | Y |
| Noise correction | Y | Y | |||||
| Select region of interest | Y | Y | Y | Y | |||
| Calibration | Y | Y | Y | Y | Y | Y | |
| Create virtual gel from different gels | Y |
See Table 13.1.4 for software vendors and product URLs.
Software for Analysis of DIGE Images
The software application most directly tailored to the DIGE technology is the DeCyder Differential Analysis Software, commercially offered by GE Healthcare. This software performs the detection, quantitation, matching, and automatic analysis of all overlaid images from single as well as multiple 2-D differentially labeled gels, exploiting the advantage afforded by using an internal standard. The automatic analysis is done with several modules. The Differential In-Gel Analysis (DIA) module performs background subtraction, normalization, quantitation, and matching of spots from two or three samples that are within the same gel. The Biological Variation Analysis (BVA) module is employed when multiple gels are used for extended sample set analysis linked by a pooled internal standard. This module can analyze the average ratio between two experimental groups or two populations of groups, as well as provide appropriate statistical analysis such as t test and one-way and two-way ANOVA. The Batch Processor module can be used to prepare a multigel experiment for use in the BVA module or to tie both the DIA and BVA modules to automatically search, detect, and quantitate the protein spots for all multidye imaged protein spots and for all linked gels. Finally, the software has an exporting XML toolbox for further downstream analysis and reporting of data.
MS-BASED PROTEIN PROFILING SOFTWARE ANALYSIS
Figure 13.1.4 illustrates the computational work flows that cover most of the MS and MS/MS based experimental analyses in protein profiling. At the core of the process is the search engine, which essentially matches the mass spectrometric data to in silico data parsed from protein databases to provide a confidence score. MS-based protein identification generally follows trypsin digestion, and is determined from the accurate masses of the resulting peptide peaks or from the MS/MS fragmentation spectrum derived from one or more of these peptides. In the peptide mass fingerprinting (PMF) approach, the experimentally determined peptide masses are compared to theoretical peptide masses calculated from an in silico protein database, which results in a ranked listing of potential proteins (Henzel et al., 1993, 2003; Mann et al., 1993; Pappin et al., 1993). This approach requires that the masses of a reasonable fraction (typically 15% to 75%) of the candidate database protein’s sequence be matched accurately (i.e., to within less than 50 parts per million) to observed tryptic peptide masses, and is applicable only to relatively highly purified proteins (e.g., isolated by 2DGE). Although mixtures of two or three proteins often can be identified via this approach, they are usually not amenable to statistically significant identification.
To effectively profile complex samples, such as the 10,000 or more proteins that might be present in a tissue, one would employ fragment-ion matching methodology. To use this approach, each peptide from a protein digest is induced in the mass spectrometer to dissociate into fragment ions. Following the mass-spectral measurement of the fragment ions, the resulting precursor peptide mass and its fragment ion masses are searched against all of the peptides that would be predicted to result from use of the protease employed in the database with the same mass, and against their in silico fragmentation patterns, to produce a matching score (Eng et al., 1994; Perkins et al., 1999). This approach can be successful in identifying proteins in complex mixtures. If a peptide sequence is unique, it is possible to identify its protein origin based only on its mass and MS/MS fragmentation spectrum. One of the primary reasons why MS/MS is preferred to MS-based protein identification is the much higher success rate observed with the former approach. In the authors’ experience from analyzing >3,200 “unknown” proteins submitted by hundreds of investigators, a 43% success rate at identifying one or more proteins/sample from peptide mass fingerprint database searching has been observed, as opposed to a 72% success rate with MS/MS-based protein identification.
A third protein database searching method, introduced by Mann and Wilm (1994), is called the “sequence tag” approach. In this mostly manual approach, the tandem MS data are interpreted to produce short amino acid “sequence tags” to be searched against peptides in the protein database, which contain the same enzymatically cleaved peptide mass and sequence. Recent algorithms like GutenTag (Tabb et al., 2003) have improved the use of this technique in a fully automated mode, allowing the searching of large MS/MS data sets without the need to specify post-translationally modified forms of the protein.
If no prior information exists about the proteins in a database, the sequence information has to be inferred de novo from the interpretation of the observed tandem MS data. The interpretation of the mass spectral data is similar to the above sequence tag approach; however, all known behavior about the mass spectral observations from known amino acid residues have to be utilized to arrive at a full sequence with high confidence. The computational algorithms like Sherenga (Dančık et al., 1999), SeqMS (Fernandez de Cossio et al., 2000), Lutefisk (Taylor and Johnson, 2001), and PEAKS (Ma et al., 2003; Bioinformatics Solutions, Inc.) help automate this de novo approach (Table 13.1.3).
As the MS complexity of samples increases, the need for faster and more sophisticated computational tools becomes essential to produce accurate and quantitative protein analysis results. For example, software for protein sequencing using a “top-down” approach and identification directly from intact proteins (ProSight PTM) has been published and made publicly available (https://prosightptm.scs.uiuc.edu/) by Kelleher’s group (Taylor et al., 2003b). Efforts to make protein database search algorithms more efficient and reliable based on the “bottom-up” approach are progressing at a fast pace. Recently, Gygi and his colleagues reported a 50% to 96% reduction in peptide identification error by implementing a machine-learned, intensity-based protein-identification software application (http://llama.med.harvard.edu/Software.html) called SILVER (Elias et al., 2004; Gibbons et al., 2004).
MS/MS-Based Protein Identification
A typical two-dimensional LC MS/MS experiment, e.g., an ICAT-based protein profiling study, produces datasets of 10,000 to greater than 100,000 MS/MS spectra, which require an automated high-throughput data processing work flow. Table 13.1.3 lists several automated tandem mass matching algorithms that reduce the barrier for completing large-scale protein identification studies. As mentioned above, most tandem MS search engines like the Sequest algorithm use existing protein databases to correlate a predicted fragmentation pattern with observed MS/MS fragment ions. Although the pattern-matching algorithm enables researchers to rapidly identify proteins, some manual review of the data and manual MS/MS sequence interpretation (which is very time-consuming) is generally required to avoid making incorrect identifications. This becomes much less of an issue if only a single gel band/spot is being analyzed or where a simple requirement such as the observation of at least two MS/MS “hits” to the same database entry is sufficient to ensure a very low error rate. The latter requirement is difficult to meet when digests of very complex tissue extracts are being analyzed. Under these conditions, especially, there is a need to statistically judge the significance of each “match.” In this regard, the MASCOT MS/MS search program uses a probability-based scoring algorithm that assigns scores to each identification, which in turn allows the researcher to judge the significance of each protein identification based on probability, which ultimately helps to reduce false positives (Perkins et al., 1999). To better determine the accuracy of a protein identification and to eliminate the need for manual reviewing of MS/MS data, the Institute for Systems Biology recently released two programs called PeptideProphet (Keller et al., 2002) and ProteinProphet (Nesvizhskii et al., 2003). The PeptideProphet program provides a statistical validation of peptide identifications made from uninterpreted MS/MS spectra from SEQUEST or Mascot. Input data used by PeptideProphet include the database score, the number of missed cleavage sites, and the number of tryptic cuts. This program helps to distinguish correct versus incorrect peptide identifications and gives a probability score of the identification being correct. ProteinProphet can be used to take the list of identified peptides and determine if the parent proteins are indeed present in the sample. Peptide identifications to the same proteins are grouped together and used to estimate a probability that the corresponding protein is present in the sample. This program also addresses the issue of peptide commonality where the same peptide is present in several different proteins.
Mass Spectrometry–Based Protein Quantitation
Although searches using sophisticated protein database search engines are the core operations for many protein-profiling experiments, they are not quantitation tools. There are very few software packages that can handle the full identification and quantitation needs for the user. Currently, there are no stringent, agreed-upon standards for MS/MS raw data file formats and data processing. Rather, it is up to each end user to interpret the instrument manufacturer’s software tools to “distill” the data into its final searchable format to submit for protein identification. Quantitative data also have to be extracted separately from the raw data. However, this information may not be relevant before the protein database search engines have verified that the relevant peaks belong to identified peptides and proteins.
The XPRESS software (Han et al., 2001) was developed in conjunction with the ICAT reagent as a method to automate protein expression calculations by quantifying the relative abundance of both the heavy and light ICAT-labeled peptides from their ESI LC-MS spectra elution profiles. This software takes into account the possible LC retention-time shifts of the hydrogen-based stable isotopes. More recently, an improved software application called ASAPRatio (http://www.proteomecenter.org/software.php) was developed for “hands-off” quantitative analysis of labeled peptides (Li et al., 2003). Although the software has capabilities allowing the user to intervene manually, it can automatically process the acquired data in four carefully constructed steps. Step one involves the multistep quantitative processing of the raw data for all identified peptides with all relevant charge states. Step two evaluates the peptide abundance ratios and their errors individually. Step three combines all peptides and their ratio errors to evaluate the corresponding protein ratios. Finally, step four evaluates the significance of each protein ratio based on the probability of the ratios of all of the other proteins found in the same experiment.
The above quantitation tools are based on the elution profiles of the parent peptide ions. Since recently developed peptide labeling reagents like iTRAQ (Applied Biosystems; Daniels et al., 2004) use fragment ions to quantify the level of expression of the parent protein, both the identification and quantitation are now made from the same set of data, thus reducing complexity and analysis times. In fact, since it is the MS/MS data that are searched, the search engine companies may be encouraged to incorporate the quantitation of the identified proteins from the same spectra, adding another level of integration onto the overall protein-profiling process.
DISEASE BIOMARKER ANALYSIS
In most biomarker studies, the biological fluids analyzed may include serum, urine, cerebrospinal fluid, nipple aspirate fluid, and others. Two types of MS data have been reported in the literature: (1) discriminating peaks of unknown identity that are different in amplitude (increased or decreased) between normal individuals and patients with disease; and (2) data in which at least some of the peptides and proteins associated with these peaks have been positively identified. Various statistical methods have been used to analyze MS data to identify a pattern consisting of several tens to thousands of peaks, which is sufficiently different between the two groups of subjects to allow accurate classification. By closely examining the SELDI-TOF MS biomarker data of Petricoin et al. (2002) for early onset detection of ovarian cancer, Baggerly et al. (2004) demonstrated how interpretive variations of the same mass spectral raw data can lead to different biological conclusions. Therefore, in this section, important issues are reviewed covering the primary analysis of MS data using a MALDI source and TOF mass analyzer as a proteomics platform.
Data resulting from MALDI TOF and other types of MS instruments have a file format consisting mostly of paired m/z versus intensity data points. The objective is finding potential peptide/protein biomarkers to distinguish cases from controls and to enable classification of future samples. While sample size is usually in the magnitude of hundreds, the total number of measured data points is in the hundreds of thousands and can increase even further with mass analyzers that have higher resolving power (e.g., Fourier transform ion cyclotron resonance mass analyzer; Marshall et al., 1998), posing a substantial challenge for statistical analysis. Statistical issues in the analysis of MS data can be broadly classified into three categories: preprocessing, sample classification, and data visualization.
MS Data Preprocessing
Data transformation
In a TOF mass spectrum, the distance between consecutive m/z data points is not constant. Instead, the m/z values are related to the square of the equally spaced data points collected in terms of ion-arrival times to the detector. Then, a transformation of arrival-time values to m/z values is performed based on a previously known or updated calibration curve of the instrument, so that the m/z scales on all the acquired spectra are comparable across the range of all m/z values. In addition, it is also necessary to log-transform the intensity levels of each of the data points. In summary, transformations are needed for both the m/z values and intensities as the first step in MS data analysis.
Baseline correction
In almost all MALDI-based MS detection, localized matrix-related chemical noise in the low m/z range and periodic and random electronic noise from the digitization processes throughout the mass spectra produce background fluctuations. As a first step, it is important to remove both of these noise components before further analysis. Local smoothing methods can be and have been utilized for baseline subtraction to remove both the chemical and high-frequency noise. Wu et al. (2003) used local linear regression to estimate the background intensities, and then subtracted the fitted values from the local linear regression. Baggerly et al. (2003) proposed a semimonotonic baseline correction method in their analysis of MALDI data. Liu et al. (2003) computed the convex hull of the spectrum and subtracted the convex hull from the original spectrum to get the baseline corrected spectrum.
Peak identification
Peak identification is arguably the most important step in raw MS data processing, as only the corresponding peptide peaks are biologically meaningful. The inclusion of non-peaks in the analysis will undoubtedly reduce the ability to identify true biomarkers. Most published algorithms on peak identification use local intensity data to define peaks, i.e., peaks are mostly defined with respect to their nearby points. For example, Yasui et al. (2003a,b) define a peak as the m/z value that has the highest intensity value within its neighbors, where the neighbors are the points within a certain range from the point of interest. In addition, a peak must have an intensity value that is higher than an average intensity level of its broad neighborhood. Coombes et al. (2003) consider two peak-identification procedures. For simple peak finding (SPF), local minima and maxima are first identified, then local maxima that are likely to result from noise are filtered out and nearby maxima that likely represent the same peptides are merged. There is a further step to remove unlikely peak points. In the Simultaneous Peak Detection and Baseline Correction (SPDBC), SPF is first used to obtain a preliminary list of peaks and their bases, and then a baseline is calculated by excluding candidate peaks. The two steps are iterated and some peaks are further filtered if the signal-to-noise ratio is smaller than a threshold. Similarly, Liu et al. (2003) declare a point in the spectrum to be a peak if the intensity is a local maximum, its absolute value is larger than a threshold, and the intensity is larger than a threshold times the average intensity in the window surrounding this point. Because all these methods are based on similar intuition and heuristics, it would be expected that similar sets of peaks would be identified. However, several common parameters like the number of neighboring points need to be specified in these algorithms. Finally, to evaluate and attain a standard analysis platform, MS data with known peak values need to be collected and tested on different algorithms.
Peak alignment
Due to ambient temperature changes and minute geometric differences of the spots on the sample plate, it is common for the m/z axis to drift during the course of an experiment. Although internal or external calibration standards can be added to minimize the mass shifts across different spectra from sample to sample, identified peaks need to be aligned so that the same peptide will have the same peak value. Coombes et al. (2003) pooled the list of detected peaks that differed in location by three clock ticks or by 0.05% of the mass. Yasui et al. (2003a) label all the points within ± 0.2% of the mass/charge value of each point as a peak. In another study, Yasui et al. (2003b) first calculate the number of peaks in all samples, allowing certain shifts, and select the m/z value with the largest number of peaks. This set of peaks is removed from all spectra and the procedure is iterated until all peaks are exhausted from all the samples. In a similar approach, Tibshirani et al. (2004) propose to use complete linkage hierarchical clustering in one dimension to cluster peaks, and the resulting dendrogram is cut off at a given height. All the peaks in the same cluster are considered the same peak in further analysis. Although all these methods are ad hoc, the relatively small number of peaks (compared to the number of collected points) and the relatively small shifts from spectrum to spectrum ensure that these heuristic peak alignments should work reasonably well in practice.
Data normalization
Normalization of the overall intensities of individual spectra can be used to help ensure that all samples contribute as equally as possible to the search for biomarkers. Data normalization has been fully addressed in the context of microarray research. In practice, various methods have been used to normalize data for MS-based proteomics analyses. For example, Wu et al. (2003) multiply all the intensities in a given spectrum by a constant, so that all the resulting spectra have the same median value. Baggerly et al. (2004) normalize within each spectrum so that the maximum intensity level is always 1 and the minimum intensity level is always 0. Coombes et al. (2003), Zhu et al. (2003a,b), and others use the total ion current to normalize across all the spectra. However, the validity of such approaches needs to be rigorously investigated, and it needs to be decided whether the comparison should be taken across all the m/z ranges or only on a subset of m/z values, e.g., all putative peaks or a given number of the highest peaks.
Sample Classification
Traditional statistical methods for classification may not be optimal or even appropriate for biomarker identification using MS data because the data are very high-dimensional, with the number of features being much larger than the number of samples. As described above, peak identification and other preprocessing procedures can help to reduce the high feature-to-sample ratio that is characteristic of biomarker MS data. The next goal is to find a subset of these features for sample classification. The high-dimensional problem is similarly encountered in microarray data analysis, and essentially all existing classification methods plus many novel ones have been applied/developed to study microarray data. In theory, these same classification methods can be directly applied to analyze MS data, and this is indeed the case in practice. A nonexhaustive list of the methods that have been applied to MS data includes: genetic algorithm (Petricoin et al., 2002; Coombes et al., 2003), artificial neural networks (Mian et al., 2003), decision-tree analysis (Vlahou et al., 2003), boosted decision-tree analysis (Qu et al., 2002), random forest method (Wu et al., 2003), logical analysis (Alexe et al., 2004), probabilistic disease classification (Lilien et al., 2003), kernel matching pursuit (Liu et al., 2003), nearest shrunken centroids (Tibshirani et al., 2004), and nearest neighbor method (Zhu et al., 2003a, b). Because of uncertainty in the sample classification, e.g., the so-called normal samples may actually correspond to undetected tumor samples, partially supervised learning methods have been proposed and applied to analysis of MS data (Yasui et al., 2004). In a comparison study of some of the commonly used classification methods, Wu et al. (2003) note that the Random Forest method and the support vector machine method performed best in their analysis of a set of ovarian cancer and normal samples. Two things need to be noted here. First, the appropriate assessment of classification accuracy is important. To date, classification error is examined by considering a training set and a testing set. Classification rules are built on the training data, and then applied to sample predication on the testing set. The training and testing sets may correspond to separate sets collected in clinical studies, or can be artificially created by splitting the overall sample into two sets, one serving as the training set and the other as the testing set. However, some studies used all the samples to select “important” features, and then only considered these features in cross-validation tests. This will lead to an overly optimistic confidence in the classification results. Second, if there are true biological differences between the two samples and such differences are reflected through many biomarkers, different algorithms may lead to different sets of biomarkers; thus, some quantification of the importance of each marker is relevant and important. Although the applications of various classification methods have been more or less successful, even a “perfect” classifier may not be biologically meaningful, as discussed below.
Data Visualization
An informative plot can reveal critical underlying features of the dataset that might otherwise be missed, and can also serve as a visual control for a complex statistical analysis. For example, a heat map on several MS data sets clearly demonstrates some intrinsic problems in an original data set (Baggerly et al., 2004). In comparisons between cases and controls, median plots can illustrate differences between the two groups. In addition, individual MS plots may also help identify outlying MS data, e.g., spectra having too few or too many peaks. Although statistical tests can be designed to capture the abnormalities that are reflected in these plots, numerical tests may miss certain aspects of data that can be easily picked up by the human eye. The utilization of color in visualizing data can further increase our ability to interpret the MS data.
Cautionary note
When significant results are found by applying appropriate statistical methods to analyze MS data, these findings may not be totally due to biologically interesting differences between the samples. Possible confounders include: sample collection, processing and storage, patient selection, and machine instability. For example, Baggerly et al. (2004) found systematic differences among different data sets consistent with the biologically implausible markers identified from the same set of data (Sorace and Zhan, 2003). In addition, unless different tumor types are systematically studied, the biomarkers identified may not be specific to certain tumor types, limiting the application of these biomarkers. For example, the observed differences in proteomic patterns in serum between normal individuals and cancer patients may result from the detection of high-abundance molecules that are not produced by the tumor cells, but rather represent epiphenomena of tumor presence (Diamandis, 2004). Furthermore, some researchers, e.g., Diamandis (2004), suggest that SELDI-TOF, and other proteomic technologies based on mass spectrometry, may not be sensitive enough to detect the low-abundance “signature” molecules that are released by a few tumor cells or their microenvironment into the circulation, although informative molecules originating from tumor cells or their microenvironment may indeed be present in biological fluids, and that their identification may lead to the discovery of potential new biomarkers.
CONCLUSIONS
According to the relatively broad proteomics experience of the authors and the proteomics reports of others, clearly, the development of proteomic technologies is multifaceted. Indeed, multiple complimentary approaches need to be taken with any protein-profiling technology to increase the overall number of identified and quantified proteins. The validity of the quantitation of expressed proteins in different samples could also increase with more than one approach. A multiple-approach strategy would also increase the understanding of the quantitation differences arising from biological effects versus the experimental approaches taken.
Although the reported number of identified proteins per study may range from a few hundred to a few thousand, the amount of time and material it takes to profile that many proteins is not trivial. For example, identifying 1,000 proteins by any profiling technique or using an LC-MS/MS approach may well require several weeks of effort. It is not at all unusual to spend hundreds of hours of instrument time alone producing hundreds of thousands of spectra per sample to be analyzed by search algorithms. The analysis time alone for these studies can take several weeks, not counting the subsequent validation and reporting time. Therefore, it is imperative that automated platforms be used for analysis of proteomic data.
The use and types of mass spectrometry hardware are diverse and are constantly evolving, as are the problems and the research questions being asked. As a result, the associated bioinformatics needs are constantly evolving as well. There are a number of commercial solutions that meet some of this growing demand, but, as evidenced from the large number of publications showing the use of a variety of different mass spectrometer types and proteomics approaches, there is still ample room for faster and better algorithms and user-friendly interfaces integrating all aspects of the proteomics field into a single platform. Initially, a platform where any raw data file format from any instrument can be deposited and converted into a common file format for preliminary spectral analysis would be extremely valuable. Furthermore, a platform that supports a multitude of spectral analyses, quantitation methods, and protein database search engines that can easily interact with the data would also be very useful. Finally, it would be ideal if the platform could allow for all the protein information and experimental input parameters to be deposited into a relational database, and then be subjected to queries and different statistical validation tools with easy-to-configure reporting schemes.
ACKNOWLEDGEMENTS
The authors would like to acknowledge Tukiet Lam for his help in reviewing the manuscript. This project has been funded in part with Federal funds from NHLBI/NIH contracts N01-HV-28186 and NO1-HV-28184, NIDA/NIH grant 1 P30 DA018343-01, and 1R24 CA88317.
Footnotes
Internet Resources http://www1.qiagen.com/literature/handbooks/PDF/Protein/Purification/QXP_Phospho-Protein/1023373HB_QXP_Phos_122002WW.pdf
Information on Qiagen commercial phosphoprotein affinity kits
http://www.proteomesystems.com
Web sites for companies selling liquid-based isoelectric focusing fractionation apparatus
http://db.systemsbiology.org/projects/sbeams/
Institute for Systems Biology Web site specifically for proteomics project analysis and management
A Global Proteome Machine (GPM) Organization Web site for proteomics project analysis and management
http://info.med.yale.edu/proteome/
Yale Protein Expression Database (YPED), a Yale University Web site for proteomics project analysis, management, and archiving (in development)
http://llama.med.harvard.edu/Software.html
Site for downloading a machine-learned intensity-based protein identification software application called SILVER
http://www.proteomecenter.org/software.php
Institute for Systems Biology Web site showcasing all of their Proteomics analysis tools
http://www.bdbiosciences.com/clontech/archive/JUL04UPD/antibody_microarray.shtml
BD Biosciences Clontech company Web site for protein antibody microarray products
Web site forProtometrix, which developsg and sells protein microarrays (now part of Invitrogen)
LITERATURE CITED
- Adam BL, Qu Y, Davis JW, Ward MD, Clements MA, Cazares LH, Semmes OJ, Schellhammer PF, Yasui Y, Feng Z, and Wright GL., Jr. Serum protein finger-printing coupled with a pattern-matching algorithm distinguishes prostate cancer from benign prostate hyperplasia and healthy men. Cancer Res. 2002;62:3609–3614. [PubMed] [Google Scholar]
- Aebersold R. Constellations in a cellular universe. Nature. 2003a;422:115–116. doi: 10.1038/422115a. [DOI] [PubMed] [Google Scholar]
- Aebersold R. A mass spectrometric journey into protein and proteome research. J. Am. Soc. Mass. Spectrom. 2003b;14:685–695. doi: 10.1016/S1044-0305(03)00289-7. [DOI] [PubMed] [Google Scholar]
- Ahmed N, Argirov OK, Minhas HS, Cordeiro CA, Thornalley PJ. Assay of advanced glycation endproducts (AGEs): Surveying AGEs by chromatographic assay with derivatization by 6-aminoqunolyl-N-hydroxysuccinimidyl-carbamate and application to N epsilon-carboxymethyl-lysine- and N epsilon-(1-carboxyethyl)lysine-modified albumin. Biochem. J. 2002;364:1–14. doi: 10.1042/bj3640001. [DOI] [PMC free article] [PubMed] [Google Scholar]
- Alexe G, Alexe S, Liotta LA, Petricoin E, Reiss M, Hammer PL. Ovarian cancer detection by logical analysis of proteomic data. Proteomics. 2004;4:766–783. doi: 10.1002/pmic.200300574. [DOI] [PubMed] [Google Scholar]
- Anderson NL, Anderson NG. The human plasma proteome: History, character, and diagnostic prospects. Mol. Cell. Proteomics. 2002;1:845–867. doi: 10.1074/mcp.r200007-mcp200. [DOI] [PubMed] [Google Scholar]; 2003;2:50. Erratum. [Google Scholar]
- Baggerly KA, Morris JS, Wang J, Gold D, Xiao LC, Coombes KR. A comprehensive approach to the analysis of matrix-assisted laser desorption/ionization-time of flight proteomics spectra from serum samples. Proteomics. 2003;3:1667–1672. doi: 10.1002/pmic.200300522. [DOI] [PubMed] [Google Scholar]
- Baggerly KA, Morris JS, Coombes KR. Reproducibility of SELDI-TOF protein patterns in serum: Comparing datasets from different experiments. Bioinformatics. 2004;20:777–785. doi: 10.1093/bioinformatics/btg484. [DOI] [PubMed] [Google Scholar]
- Banks JF, Gulcicek EE. Rapid peptide mapping by reversed-phase liquid chromatography on nonporous silica with on-line electrospray time-of-flight mass spectrometry. Anal. Chem. 1997;69:3973–3978. doi: 10.1021/ac970226t. [DOI] [PubMed] [Google Scholar]
- Beausoleil SA, Jedrychowski M, Schwartz D, Elias JE, Villen J, Li J, Cohn MA, Cantley LC, Gygi SP. Large-scale characterization of HeLa cell nuclear phosphoproteins. Proc. Natl. Acad. Sci. U.S.A. 2004;101:12130–12135. doi: 10.1073/pnas.0404720101. [DOI] [PMC free article] [PubMed] [Google Scholar]
- Bergen HR, 3rd, Vasmatzis G, Cliby WA, Johnson KL, Oberg AL, Muddiman DC. Discovery of ovarian cancer biomarkers in serum using NanoLC electrospray ionization TOF and FT-ICR mass spectrometry. Dis. Markers. 2003;19:239–249. doi: 10.1155/2004/797204. [DOI] [PMC free article] [PubMed] [Google Scholar]
- Betgovargez E, Simonian MH. Beckman Coulter Application Information Bulletin A-1964A. BD Biosciences; San Jose, Calif.: 2003. Reproducibility and Dynamic Range Characteristics of the Proteome PF 2D System. [Google Scholar]
- Bischoff R, Luider TM. Methodological advances in the discovery of protein and peptide disease markers. J. Chromatogr. B Analyt. Technol. Biomed. Life Sci. 2004;803:27–40. doi: 10.1016/j.jchromb.2003.09.004. [DOI] [PubMed] [Google Scholar]
- Bobbitt JM. Periodate oxidation of carbohydrates. Adv. Carbohyr. Chem. Biochem. 1956;11:1–41. doi: 10.1016/s0096-5332(08)60115-0. [DOI] [PubMed] [Google Scholar]
- Bonenfant D, Schmelzle T, Jacinto E, Crespo JL, Mini T, Hall MN, Jenoe P. Quantitation of changes in protein phosphorylation: A simple method based on stable isotope labeling and mass spectrometry. Proc. Natl. Acad. Sci. U.S.A. 2003;100:880–885. doi: 10.1073/pnas.232735599. [DOI] [PMC free article] [PubMed] [Google Scholar]
- Bushey MM, Jorgenson JW. Automated instrumentation for comprehensive two-dimensional high-performance liquid chromatography of proteins. Anal. Chem. 1990;62:161–167. doi: 10.1021/ac00201a015. [DOI] [PubMed] [Google Scholar]
- Chong BE, Yan F, Lubman DM, Miller FR. Chromatofocusing non-porous reversed-phase high-performance liquid chromatography/electrospray ionization time-of-flight mass spectrometry of proteins from human breast cancer whole cell lysates: A novel two-dimensional liquid chromatography/mass spectrometry method. Rapid Commun. Mass Spectrom. 2001;15:291–296. doi: 10.1002/rcm.227. [DOI] [PubMed] [Google Scholar]
- Cohen P. The role of protein phosphorylation in neural and hormonal control of cellular activity. Nature. 1982;296:613–620. doi: 10.1038/296613a0. [DOI] [PubMed] [Google Scholar]
- Cohen P. Signal integration at the level of protein kinases, protein phosphatases and their substrates. Trends Biochem. Sci. 1992;17:408–413. doi: 10.1016/0968-0004(92)90010-7. [DOI] [PubMed] [Google Scholar]
- Coombes KR, Fritsche HA, Clarke C, Chen JN, Baggerly KA, Morris JS, Xiao LC, Hung MC, Kuerer HM. Quality control and peak finding for proteomics data collected from nipple aspirate fluid by surface-enhanced laser desorption and ionization. Clin. Chem. 2003;49:1615–1623. doi: 10.1373/49.10.1615. [DOI] [PubMed] [Google Scholar]
- Dančık V, Addona TA, Clauser KR, Vath JE, Pevzner PA. De novo peptide sequencing via tandem mass spectrometry. J. Comput. Biol. 1999;6:327–342. doi: 10.1089/106652799318300. [DOI] [PubMed] [Google Scholar]
- Daniels S, Pappin D, Stanick W, Ross P, Huang Y, Williamson B, Purkayastha B. Optimization of a protocol for labeling peptides and protein digests with tags for relative and absolute quantification. Proceedings of the 52nd ASMS Conference on Mass Spectrometry and Allied Topics; Nashville, Tennessee. May 23–27; Santa Fe, N.M.: American Society for Mass Spectrometry; 2004. [Google Scholar]
- de Jager W, te Velthuis H, Prakken BJ, Kuis W, Rijkers GT. Simultaneous detection of 15 human cytokines in a single sample of stimulated peripheral blood mononuclear cells. Clin. Diagn. Lab. Immun. 2003;10:133–139. doi: 10.1128/CDLI.10.1.133-139.2003. [DOI] [PMC free article] [PubMed] [Google Scholar]
- Diamandis EP. Mass spectrometry as a diagnostic and a cancer biomarker discovery tool opportunities and potential limitations. Mol. Cell. Proteomics. 2004;3:367–378. doi: 10.1074/mcp.R400007-MCP200. [DOI] [PubMed] [Google Scholar]
- Edmondson RD, Vondriska TM, Biederman KJ, Zhang J, Jones RC, Zheng Y, Allen DL, Xiu JX, Cardwell EM, Pisano MR, Ping P. Protein kinase C epsilon signaling complexes include metabolism- and transcription/translation-related proteins: complimentary separation techniques with LC/MS/MS. Mol. Cell. Proteomics. 2002;1:421–433. doi: 10.1074/mcp.m100036-mcp200. [DOI] [PubMed] [Google Scholar]
- Edmondson RD, Jones RC, Dragan YP. Strategy to map the liver proteome. Proceedings of the 52nd ASMS Conference on Mass Spectrometry and Allied Topics; Nashville, Tennessee. May 23-27; Santa Fe, N.M.: American Society for Mass Spectrometry; 2004. [Google Scholar]
- Elias JE, Gibbons FD, King OD, Roth FP, Gygi SP. Intensity-based protein identification by machine learning from a library of tandem mass spectra. Nat. Biotechnol. 2004;22:214–219. doi: 10.1038/nbt930. [DOI] [PubMed] [Google Scholar]
- Endo T, Toda T. Glycosylation in congenital muscular dystrophies. Biol. Pharm. Bull. 2003;26:1641–1647. doi: 10.1248/bpb.26.1641. [DOI] [PubMed] [Google Scholar]
- Eng J, McCormack AL, Yates JR., 3rd An approach to correlate tandem mass spectral data of peptides with amino acid sequences in a protein database. J. Am. Soc. Mass. Spectrom. 1994;5:976–989. doi: 10.1016/1044-0305(94)80016-2. [DOI] [PubMed] [Google Scholar]
- Fernandez de Cossio J, Gonzalez J, Satomi Y, Shima T, Okumura N, Besada V, Betancourt L, Padron G, Shimonishi Y, Takao T. Automated interpretation of low-energy collision-induced dissociation spectra by SeqMS, a software aid for de novo sequencing by tandem mass spectrometry. Electrophoresis. 2000;21:1694–1699. doi: 10.1002/(SICI)1522-2683(20000501)21:9<1694::AID-ELPS1694>3.0.CO;2-W. [DOI] [PubMed] [Google Scholar]
- Ficarro SB, McCleland ML, Stukenberg PT, Burke DJ, Ross MM, Shabanowitz J, Hunt DF, White FM. Phosphoproteome analysis by mass spectrometry and its application to Saccharomyces cerevisiae. Nat. Biotechnol. 2002;20:301–305. doi: 10.1038/nbt0302-301. [DOI] [PubMed] [Google Scholar]
- Forbes AJ, Patrie SM, Taylor GK, Kim YB, Jiang L, Kelleher NL. Targeted analysis and discovery of posttranslational modifications in proteins from methanogenic archaea by top-down MS. Proc. Natl. Acad. Sci. U.S.A. 2004;101:2678–2683. doi: 10.1073/pnas.0306575101. [DOI] [PMC free article] [PubMed] [Google Scholar]
- Futcher B, Latter GI, Monardo P, McLaughlin CS, Garrels JI. A sampling of the yeast proteome. Mol. Cell. Biol. 1999;19:7357–7368. doi: 10.1128/mcb.19.11.7357. [DOI] [PMC free article] [PubMed] [Google Scholar]
- Gharbi S, Gaffney P, Yang A, Zvelebil MJ, Cramer R, Waterfield MD, Timms JF. Evaluation of two-dimensional differential gel electrophoresis for proteomic expression analysis of a model breast cancer cell system. Mol. Cell. Proteomics. 2002;1:91–98. doi: 10.1074/mcp.t100007-mcp200. [DOI] [PubMed] [Google Scholar]
- Gibbons FD, Elias JE, Gygi SP, Roth FP. SILVER helps assign peptides to tandem mass spectra using intensity-based scoring. J. Am. Soc. Mass Spectrom. 2004;15:910–912. doi: 10.1016/j.jasms.2004.02.011. [DOI] [PubMed] [Google Scholar]
- Goshe MB, Conrads TP, Panisko EA, Angell NH, Veenstra TD, Smith RD. Phosphoprotein isotope-coded affinity tag approach for isolating and quantitating phosphopeptides in proteome-wide analyses. Anal. Chem. 2001;73:2578–2586. doi: 10.1021/ac010081x. [DOI] [PubMed] [Google Scholar]
- Goshe MB, Veenstra TD, Panisko EA, Conrads TP, Angell NH, Smith RD. Phosphoprotein isotope-coded affinity tags: Application to the enrichment and identification of low-abundance phosphoproteins. Anal. Chem. 2002;74:607–616. doi: 10.1021/ac015528g. [DOI] [PubMed] [Google Scholar]
- Greenbaum D, Colangelo C, Williams K, Gerstein M. Comparing protein abundance and mRNA expression levels on a genomic scale. Genome Biol. 2003;4:117. doi: 10.1186/gb-2003-4-9-117. [DOI] [PMC free article] [PubMed] [Google Scholar]
- Gronborg M, Kristiansen TZ, Stensballe A, Andersen JS, Ohara O, Mann M, Jensen ON, Pandey A. A mass spectrometry–based proteomic approach for identification of serine/threonine-phosphorylated proteins by enrichment with phospho-specific antibodies: Identification of a novel protein, Frigg, as a protein kinase A substrate. Mol. Cell. Proteomics. 2002;7:517–527. doi: 10.1074/mcp.m200010-mcp200. [DOI] [PubMed] [Google Scholar]
- Gygi SP, Rochon Y, Franza BR, Aeber-sold R. Correlation between protein and mRNA abundance in yeast. Mol. Cell. Biol. 1999a;19:1720–1730. doi: 10.1128/mcb.19.3.1720. [DOI] [PMC free article] [PubMed] [Google Scholar]
- Gygi SP, Rist B, Gerber SA, Turecek F, Gelb MH, Aebersold R. Quantitative analysis of complex protein mixtures using isotope-coded affinity tags. Nat. Biotechnol. 1999b;17:994–999. doi: 10.1038/13690. [DOI] [PubMed] [Google Scholar]
- Gygi SP, Corthals GL, Zhang Y, Rochon Y, Aebersold R. Evaluation of two-dimensional gel electrophoresis-based proteome analysis technology. Proc. Natl. Acad. Sci. U.S.A. 2000;97:9390–9395. doi: 10.1073/pnas.160270797. [DOI] [PMC free article] [PubMed] [Google Scholar]
- Haab BB, Dunham MJ, Brown PO. Protein microarrays for highly parallel detection and quantitation of specific proteins and antibodies in complex solutions. Genome Biol. 2001;2:1–13. doi: 10.1186/gb-2001-2-2-research0004. [DOI] [PMC free article] [PubMed] [Google Scholar]
- Hagglund P, Bunkenborg J, Elortza F, Jensen ON, Roepstorff P. A new strategy for identification of N-glycosylated proteins and unambiguous assignment of their glycosylation sites using HILIC enrichment and partial deglycosylation. J. Proteome Res. 2004;3:556–566. doi: 10.1021/pr034112b. [DOI] [PubMed] [Google Scholar]
- Hamler RL, Zhu K, Buchanan NS, Kreunin P, Kachman MT, Miller FR, Lubman DM. A two-dimensional liquid-phase separation method coupled with mass spectrometry for proteomic studies of breast cancer and biomarker identification. Proteomics. 2004;4:562–577. doi: 10.1002/pmic.200300606. [DOI] [PubMed] [Google Scholar]
- Han DK, Eng J, Zhou H, Aebersold R. Quantitative profiling of differentiation-induced microsomal proteins using isotope-coded affinity tags and mass spectrometry. Nat. Biotechnol. 2001;19:946–951. doi: 10.1038/nbt1001-946. [DOI] [PMC free article] [PubMed] [Google Scholar]
- Harper S, Mozdzanowski J, Speicher D. Two-dimensional gel electrophoresis. In: Coligan JE, Dunn BM, Speicher DW, Wing-field PT, editors. Current Protocols in Protein Science. John Wiley & Sons; Hoboken, N.J.: 1998. pp. 10.4.1–10.4.36. [DOI] [PubMed] [Google Scholar]
- He T, Alving K, Feild B, Norton J, Joseloff EG, Patterson SD, Domon B. Quantitation of phosphopeptides using affinity chromatography and stable isotope labeling. J. Am. Soc. Mass Spectrom. 2004;15:363–373. doi: 10.1016/j.jasms.2003.11.004. [DOI] [PubMed] [Google Scholar]
- Helenius A, Aebi M. Intracellular functions of N-linked glycans. Science. 2001;291:2364–2369. doi: 10.1126/science.291.5512.2364. [DOI] [PubMed] [Google Scholar]
- Henzel WJ, Stults JT. Matrix-assisted laser desorption/ionization time-of-flight mass analysis of peptides. In: Coligan JE, Dunn BM, Speicher DW, Wingfield PT, editors. Current Protocols in Protein Science. John Wiley & Sons; Hoboken, N.J.: 1996. pp. 16.2.1–16.2.11. [Google Scholar]
- Henzel WJ, Billeci TM, Stults JT, Wong SC, Grimley C, Watanabe C. Identifying proteins from two-dimensional gels by molecular mass searching of peptide fragments in protein sequence databases. Proc. Natl. Acad. Sci. U.S.A. 1993;90:5011–5015. doi: 10.1073/pnas.90.11.5011. [DOI] [PMC free article] [PubMed] [Google Scholar]
- Henzel WJ, Watanabe C, Stults JT. Protein identification: The origins of peptide mass fingerprinting. J. Am. Soc. Mass Spectrom. 2003;14:931–942. doi: 10.1016/S1044-0305(03)00214-9. [DOI] [PubMed] [Google Scholar]
- Hoving S, Voshol H, van Oostrum J. Towards high performance two-dimensional gel electrophoresis using ultrazoom gels. Electrophoresis. 2000;21:2617–2621. doi: 10.1002/1522-2683(20000701)21:13<2617::AID-ELPS2617>3.0.CO;2-C. [DOI] [PubMed] [Google Scholar]
- Huang Y, Ross PL, Pillai S, Purkayastha B, Martin S, Pappin D. Protein expression measurements using multiplexed isobaric tagging technology. Proceedings of the 52nd ASMS Conference on Mass Spectrometry and Allied Topics; Nashville, Tennessee. May 23– 27; Santa Fe, N.M.: American Society for Mass Spectrometry; 2004. [Google Scholar]
- Hubbard MJ, Cohen P. On target with a new mechanism for the regulation of protein phosphorylation. Trends Biochem. Sci. 1993;18:172–177. doi: 10.1016/0968-0004(93)90109-z. [DOI] [PubMed] [Google Scholar]
- Issaq HJ, Veenstra TD, Conrads TP, Felschow D. The SELDI-TOF MS approach to proteomics: Protein profiling and biomarker identification. Biochem. Biophys. Res. Commun. 2002;292:587–592. doi: 10.1006/bbrc.2002.6678. [DOI] [PubMed] [Google Scholar]
- Julka S, Regnier F. Quantification in proteomics through stable isotope coding: A review. J. Proteome Res. 2004;3:350–363. doi: 10.1021/pr0340734. [DOI] [PubMed] [Google Scholar]
- Kalkum M, Lyon GJ, Chait BT. Detection of secreted peptides by using hypothesis-driven multistage mass spectrometry. Proc. Natl. Acad. Sci. U.S.A. 2003;100:2795–2800. doi: 10.1073/pnas.0436605100. [DOI] [PMC free article] [PubMed] [Google Scholar]
- Kelleher NL. Top-down proteomics. Anal. Chem. 2004;76:197A–203A. [PubMed] [Google Scholar]
- Keller A, Nesvizhskii AI, Kolker E, Aebersold R. Empirical statistical model to estimate the accuracy of peptide identifications made by MS/MS and database search. Anal. Chem. 2002;74:5383–5392. doi: 10.1021/ac025747h. [DOI] [PubMed] [Google Scholar]
- Knight ZA, Schilling B, Row RH, Kenski DM, Gibson BW, Shokat KM. Phosphospecific proteolysis for mapping sites of protein phosphorylation. Nat. Biotechnol. 2003;21:1047–1054. doi: 10.1038/nbt863. [DOI] [PubMed] [Google Scholar]; Nat. Biotechnol. 21:1396. [Published erratum appears in. [Google Scholar]
- Kuster B, Krogh TN, Mortz E, Harvey DJ. Glycosylation analysis of gel-separated proteins. Proteomics. 2001;1:350–361. doi: 10.1002/1615-9861(200102)1:2<350::AID-PROT350>3.0.CO;2-7. [DOI] [PubMed] [Google Scholar]
- Li J, Zhang Z, Rosenzweig J, Wang YY, Chan DW. Proteomics and bioinformatics approaches for identification of serum biomarkers to detect breast cancer. Clin. Chem. 2002;48:1296–1304. [PubMed] [Google Scholar]
- Li J, Steen H, Gygi SP. Protein profiling with cleavable isotope coded affinity tag (cICAT) reagents: The yeast salinity stress response. Mol. Cell. Proteomics. 2003;2:1198–1204. doi: 10.1074/mcp.M300070-MCP200. [DOI] [PubMed] [Google Scholar]
- Lilien RH, Farid H, Donald BR. Probabilistic disease classification of expression-dependent proteomic data from mass spectrometry of human serum. J. Comp. Biol. 2003;10:925–946. doi: 10.1089/106652703322756159. [DOI] [PubMed] [Google Scholar]
- Lilley KS. Protein profiling using two-dimensional difference gel electrophoresis (2-D DIGE) In: Coligan JE, Dunn BM, Speicher DW, Wingfield PT, editors. Current Protocols in Protein Science. John Wiley & Sons; Hoboken, N.J.: 2002. pp. 22.2.1–22.2.14. [Google Scholar]
- Link AJ, Jennings JL, Washburn MP. Analysis of protein composition using multidimensional chromatography and mass spectrometry. In: Coligan JE, Dunn BM, Speicher DW, Wingfield PT, editors. Current Protocols in Protein Science. John Wiley & Sons; Hoboken, N.J.: 2003. pp. 23.1.1–23.1.25. [DOI] [PubMed] [Google Scholar]
- Liu Q, Krishnapuram B, Pratapa P, Liao X, Hartemink A, Carin L. Identification of differentially expressed proteins using MALDI-TOF mass spectra. Proceedings of Asilomar Conference: Biological Aspects of Signal Processing; Santa Fe, N.M.: American Society for Mass Spectrometry; Nov, 2003. 2003. [Google Scholar]
- Lowe JB. Glycosylation, immunity, and autoimmunity. Cell. 2001;104:809–812. doi: 10.1016/s0092-8674(01)00277-x. [DOI] [PubMed] [Google Scholar]
- Ma B, Zhang K, Hendrie C, Liang C, Li M, Doherty-Kirby A, Lajoie G. PEAKS: Powerful software for peptide de novo sequencing by tandem mass spectrometry. Rapid Commun. Mass Spectrom. 2003;17:2337–2342. doi: 10.1002/rcm.1196. [DOI] [PubMed] [Google Scholar]
- MacBeath G, Schreiber SL. Printing proteins as microarrays for high-throughput function determination. Science. 2000;289:1760–1763. doi: 10.1126/science.289.5485.1760. [DOI] [PubMed] [Google Scholar]
- Madoz-Gúrpide J, Wang H, Misek DE, Brichory F, Hanash SM. Protein based microarrays: A tool for probing the proteome of cancer cells and tissues. Proteomics. 2001;1:1279–1287. doi: 10.1002/1615-9861(200110)1:10<1279::AID-PROT1279>3.0.CO;2-W. [DOI] [PubMed] [Google Scholar]
- Mann M, Wilm M. Error-tolerant identification of peptides in sequence databases by peptide sequence tags. Anal. Chem. 1994;66:4390–4399. doi: 10.1021/ac00096a002. [DOI] [PubMed] [Google Scholar]
- Mann M, Hojrup P, Roepstorff P. Use of mass spectrometric molecular weight information to identify proteins in sequence databases. Biol. Mass Spectrom. 1993;22:338–345. doi: 10.1002/bms.1200220605. [DOI] [PubMed] [Google Scholar]
- Marshall AG, Hendrickson CL, Jackson GS. Fourier transform ion cyclotron resonance mass spectrometry: A primer. Mass Spectrom. Rev. 1998;17:1–35. doi: 10.1002/(SICI)1098-2787(1998)17:1<1::AID-MAS1>3.0.CO;2-K. [DOI] [PubMed] [Google Scholar]
- McLachlin DT, Chait BT. Improved beta-elimination-based affinity purification strategy for enrichment of phosphopeptides. Anal. Chem. 2003;75:6826–6836. doi: 10.1021/ac034989u. [DOI] [PubMed] [Google Scholar]
- Mechref Y, Novotny MV. Structural investigations of glycoconjugates at high sensitivity. Chem. Rev. 2002;102:321–369. doi: 10.1021/cr0103017. [DOI] [PubMed] [Google Scholar]
- Mian S, Ball G, Hornbuckle J, Holding F, Carmichael J, Ellis I, Ali S, Li G, McArdle S, Creaser C, Rees R. A prototype methodology combining surface-enhanced laser desorption/ionization protein chip technology and artificial neural network algorithms to predict the chemoresponsiveness of breast cancer cell lines exposed to Paclitaxel and Doxorubicin under in vitro conditions. Proteomics. 2003;3:1725–1737. doi: 10.1002/pmic.200300526. [DOI] [PubMed] [Google Scholar]
- Moritz RL, Ji H, Schutz F, Connolly LM, Kapp EA, Speed TP, Simpson RJ. A proteome strategy for fractionating proteins and peptides using continuous free-flow electrophoresis coupled off-line to reversed-phase high-performance liquid chromatography. Anal. Chem. 2004;76:4811–4824. doi: 10.1021/ac049717l. [DOI] [PubMed] [Google Scholar]
- Nesvizhskii AI, Keller A, Kolker E, Aebersold R. A statistical model for identifying proteins by tandem mass spectrometry. Anal. Chem. 2003;75:4646–4658. doi: 10.1021/ac0341261. [DOI] [PubMed] [Google Scholar]
- Nielsen UB, Cardone MH, Sinskey AJ, MacBeath G, Sorger PK. Profiling receptor tyrosine kinase activation by using Ab microarrays. Proc. Natl. Acad. Sci. U.S.A. 2003;100:9330–9335. doi: 10.1073/pnas.1633513100. [DOI] [PMC free article] [PubMed] [Google Scholar]
- Nomura F, Tomonaga T, Sogawa K, Ohashi T, Nezu M, Sunaga M, Kondo N, Iyo M, Shimada H, Ochiai T. Identification of novel and downregulated biomarkers for alcoholism by surface enhanced laser desorption/ionization-mass spectrometry. Proteomics. 2004;4:1187–1194. doi: 10.1002/pmic.200300674. [DOI] [PubMed] [Google Scholar]
- Oda Y, Huang K, Cross FR, Cowburn D, Chait BT. Accurate quantitation of protein expression and site-specific phosphorylation. Proc. Natl. Acad. Sci. U.S.A. 1999;96:6591–6596. doi: 10.1073/pnas.96.12.6591. [DOI] [PMC free article] [PubMed] [Google Scholar]
- Oda Y, Nagasu T, Chait BT. Enrichment analysis of phosphorylated proteins as a tool for probing the phosphoproteome. Nat. Biotechnol. 2001;19:379–382. doi: 10.1038/86783. [DOI] [PubMed] [Google Scholar]
- Ong SE, Blagoev B, Kratchmarova I, Kristensen DB, Steen H, Pandey A, Mann M. Stable isotope labeling by amino acids in cell culture, SILAC, as a simple and accurate approach to expression proteomics. Mol. Cell. Proteomics. 2002;1:376–386. doi: 10.1074/mcp.m200025-mcp200. [DOI] [PubMed] [Google Scholar]
- Ong SE, Kratchmarova I, Mann M. Properties of 13C-substituted arginine in stable isotope labeling by amino acids in cell culture (SILAC) J. Proteome Res. 2003;2:173–181. doi: 10.1021/pr0255708. [DOI] [PubMed] [Google Scholar]
- Opiteck GJ, Jorgenson JW. Two-dimensional SEC/RPLC coupled to mass spectrometry for the analysis of peptides. Anal. Chem. 1997;69:2283–2291. doi: 10.1021/ac961156d. [DOI] [PubMed] [Google Scholar]
- Opiteck GJ, Ramirez SM, Jorgenson JW, Moseley MA., 3rd Comprehensive two-dimensional high-performance liquid chromatography for the isolation of overexpressed proteins and proteome mapping. Anal. Biochem. 1998;258:349–361. doi: 10.1006/abio.1998.2588. [DOI] [PubMed] [Google Scholar]
- Papadopoulos MC, Abel PM, Agranoff D, Stich A, Tarelli E, Bell BA, Planche T, Loosemore A, Saadoun S, Wilkins P, Krishna S. A novel and accurate diagnostic test for human African trypanosomiasis. Lancet. 2004;363:1358–1363. doi: 10.1016/S0140-6736(04)16046-7. [DOI] [PubMed] [Google Scholar]
- Pappin DJC, Hojrup P, Bleasby A. Rapid identification of proteins by peptide-mass fingerprinting. J. Curr. Biol. 1993;3:327–332. doi: 10.1016/0960-9822(93)90195-t. [DOI] [PubMed] [Google Scholar]
- Pasa-Tolic L, Lipton MS, Masselon CD, Anderson GA, Shen Y, Tolic N, Smith RD. Gene expression profiling using advanced mass spectrometric approaches. J. Mass. Spectrom. 2002;37:1185–1198. doi: 10.1002/jms.423. [DOI] [PubMed] [Google Scholar]
- Patton WF. A thousand points of light: The application of fluorescence detection technologies to two-dimensional gel electrophoresis and proteomics. Electrophoresis. 2000;6:1123–1144. doi: 10.1002/(SICI)1522-2683(20000401)21:6<1123::AID-ELPS1123>3.0.CO;2-E. [DOI] [PubMed] [Google Scholar]
- Patton WF. Detection technologies in proteome analysis. J. Chromatogr. B Analyt. Technol. Biomed. Life Sci. 2002;771:3–31. doi: 10.1016/s1570-0232(02)00043-0. [DOI] [PubMed] [Google Scholar]
- Pawson T, Scott JD. Signaling through scaffold, anchoring, and adaptor proteins. Science. 1997;278:2075–2080. doi: 10.1126/science.278.5346.2075. [DOI] [PubMed] [Google Scholar]
- Peng J, Elias JE, Thoreen CC, Licklider LJ, Gygi SP. Evaluation of multidimensional chromatography coupled with tandem mass spectrometry (LC/LC-MS/MS) for large-scale protein analysis: The yeast proteome. J. Proteome Res. 2003;2:43–50. doi: 10.1021/pr025556v. [DOI] [PubMed] [Google Scholar]
- Perkins DN, Pappin JC, Creasy DM, Cottrell JS. Probability-based protein identification by searching sequence databases using mass spectrometry data. Electrophoresis. 1999;20:3551–3567. doi: 10.1002/(SICI)1522-2683(19991201)20:18<3551::AID-ELPS3551>3.0.CO;2-2. [DOI] [PubMed] [Google Scholar]
- Petricoin EF, Ardekani AM, Hitt BA, Levine PJ, Fusaro VA, Steinberg SM, Mills GB, Simone C, Fishman DA, Kohn EC, Liotta LA. Use of proteomic patterns in serum to identify ovarian cancer. Lancet. 2002;359:572–577. doi: 10.1016/S0140-6736(02)07746-2. [DOI] [PubMed] [Google Scholar]
- Pinkse MW, Uitto PM, Hilhorst MJ, Ooms B, Heck AJ. Selective isolation at the femtomole level of phosphopeptides from proteolytic digests using 2D-NanoLC-ESI-MS/MS and titanium oxide precolumns. Anal. Chem. 2004;76:3935–3943. doi: 10.1021/ac0498617. [DOI] [PubMed] [Google Scholar]
- Posewitz MC, Tempst P. Immobilized gallium(III) affinity chromatography of phosphopeptides. Anal. Chem. 1999;71:2883–2892. doi: 10.1021/ac981409y. [DOI] [PubMed] [Google Scholar]
- Qian WJ, Goshe MB, Camp DG, 2nd, Yu LR, Tang K, Smith RD. Phosphoprotein isotope-coded solid-phase tag approach for enrichment and quantitative analysis of phosphopeptides from complex mixtures. Anal. Chem. 2003;75:5441–5450. doi: 10.1021/ac0342774. [DOI] [PubMed] [Google Scholar]
- Qiu Y, Sousa EA, Hewick RM, Wang JH. Acid-labile isotope-coded extractants: A class of reagents for quantitative mass spectro-metric analysis of complex protein mixtures. Anal. Chem. 2002;74:4969–4979. doi: 10.1021/ac0256437. [DOI] [PubMed] [Google Scholar]
- Qu YS, Adam BL, Yasui T, Ward MD, Cazares LH, Schellhammer PF, Feng ZD, Semmes OJ, Wright GL. Boosted decision tree analysis of surface-enhanced laser desorption/ionization mass spectral serum profiles discriminates prostate cancer from non-cancer patients. Clin. Chem. 2002;48:1835–1843. [PubMed] [Google Scholar]
- Rockhill B. Proteomic patterns in serum and identification of ovarian cancer. Lancet. 2002;360:169–171. doi: 10.1016/S0140-6736(02)09387-X. [DOI] [PubMed] [Google Scholar]
- Rush J, Moritz A, Lee KA, Goss VL, Guo A, Zhang H, Polakiewicz RD, Comb MJ. Immunoaffinity profiling of tyrosine phosphorylation. Proceedings of the 52nd ASMS Conference on Mass Spectrometry and Allied Topics; Nashville, Tennessee. May 23–27; Santa Fe, N.M.: American Society for Mass Spec-trometry; 2004. [Google Scholar]
- Seberger PJ, Chaney WG. Control of metastasis by Asn-linked, beta1-6 branched oligosaccharides in mouse mammary cancer cells. Glycobiology. 1999;9:235–241. doi: 10.1093/glycob/9.3.235. [DOI] [PubMed] [Google Scholar]
- Shi Y, Xiang R, Crawford JK, Colangelo CM, Horváth C, Wilkins JA. A simple solid phase mass tagging approach for quantitative proteomics. J. Proteome Res. 2003;3:104–111. doi: 10.1021/pr034081k. [DOI] [PubMed] [Google Scholar]
- Sorace JM, Zhan M. A data review and re-assessment of ovarian cancer serum proteomic profiling. BMC Bioinformatics. 2003;4:24. doi: 10.1186/1471-2105-4-24. [DOI] [PMC free article] [PubMed] [Google Scholar]
- Stears RL, Martinsky T, Schena M. Trends in microarray analysis. Nature Med. 2003;9:140–145. doi: 10.1038/nm0103-140. [DOI] [PubMed] [Google Scholar]
- Steen H, Kuster B, Fernandez M, Pandey A, Mann M. Tyrosine phosphorylation mapping of the epidermal growth factor receptor signaling pathway. J. Biol. Chem. 2002;277:1031–1039. doi: 10.1074/jbc.M109992200. [DOI] [PubMed] [Google Scholar]
- Suckau D, Resemann A. T3-sequencing: Targeted characterization of the N- and C-termini of undigested proteins by mass spec-trometry. Anal. Chem. 2003;75:5817–5824. doi: 10.1021/ac034362b. [DOI] [PubMed] [Google Scholar]
- Tabb DL, Saraf A, Yates JR., 3rd GutenTag: High-throughput sequence tagging via an empirically derived fragmentation model. Anal. Chem. 2003;75:6415–6421. doi: 10.1021/ac0347462. [DOI] [PMC free article] [PubMed] [Google Scholar]
- Taylor JA, Johnson RS. Implementation and uses of automated de novo peptide sequencing by tandem mass spectrometry. Anal. Chem. 2001;73:2594–2604. doi: 10.1021/ac001196o. [DOI] [PubMed] [Google Scholar]
- Taylor SW, Fahy E, Zhang B, Glenn GM, Warnock DE, Wiley S, Murphy AN, Gaucher SP, Capaldi RA, Gibson BW, Ghosh SS. Characterization of the human heart mitochondrial proteome. Nat. Biotechnol. 2003a;21:281–286. doi: 10.1038/nbt793. [DOI] [PubMed] [Google Scholar]
- Taylor GK, Kim Y-B, Forbes AJ, Meng F, McCarthy R, Kelleher NL. Web and database software for identification of intact proteins using “Top Down” mass spectrometry. Anal. Chem. 2003b;75:4081–4086. doi: 10.1021/ac0341721. [DOI] [PubMed] [Google Scholar]
- Tibshirani R, Hastie T, Narasimhan B, Soltys S, Shi G, Koong A, Le QT. Sample classification from protein mass spectrometry, by “peak probability contrasts.”. Bioinformatics. 2004;20:3034–3044. doi: 10.1093/bioinformatics/bth357. [DOI] [PubMed] [Google Scholar]
- Tonge R, Shaw J, Middleton B, Rowlinson R, Rayner S, Young J, Pognan F, Hawkins E, Currie I, Davison M. Validation and development of fluorescence two-dimensional differential gel electrophoresis proteomics technology. Proteomics. 2001;1:377–396. doi: 10.1002/1615-9861(200103)1:3<377::AID-PROT377>3.0.CO;2-6. [DOI] [PubMed] [Google Scholar]
- Unlu M, Morgan ME, Minden JS. Difference gel electrophoresis: A single gel method for detecting changes in protein extracts. Electrophoresis. 1997;18:2071–2077. doi: 10.1002/elps.1150181133. [DOI] [PubMed] [Google Scholar]
- Van’t Veer LJ, Dai H, van de Vijver MJ, He YD, Hart AA, Mao M, Peterse HL, van der Kooy K, Marton MJ, Witteveen AT, Schreiber GJ, Kerkhoven RM, Roberts C, Linsley PS, Bernards R, Friend SH. Gene expression profiling predicts clinical outcome of breast cancer. Nature. 2002;415:530–536. doi: 10.1038/415530a. [DOI] [PubMed] [Google Scholar]
- Venable JD, Yates JR., III Impact of ion trap tandem mass spectra variability on the identification of peptides. Anal. Chem. 2004;76:2928–2937. doi: 10.1021/ac0348219. [DOI] [PubMed] [Google Scholar]
- Villanueva JP, Entenberg JD, Chaparro CA, Tanwar MK, Holland EC, Tempst P. Serum peptide profiling by magnetic particle-assisted, automated sample processing and MALDI-TOF mass spectrometry. Anal. Chem. 2004;76:1560–1570. doi: 10.1021/ac0352171. [DOI] [PubMed] [Google Scholar]
- Vlahou A, Schorge JO, Gregory BW, Coleman RL. Diagnosis of ovarian cancer using decision tree classification of mass spectral data. J. Biomed. Biotechnol. 2003;5:308–314. doi: 10.1155/S1110724303210032. [DOI] [PMC free article] [PubMed] [Google Scholar]
- Wadsworth JT, Somers KD, Cazares LH, Malik G, Adam BL, Stack BC, Wright GL, Semmes OJ. Serum protein profiles to identify head and neck cancer. Clin. Can. Res. 2004;10:1625–1632. doi: 10.1158/1078-0432.ccr-0297-3. [DOI] [PubMed] [Google Scholar]
- Wall DB, Parus SJ, Lubman DM. Three-dimensional protein map according to pI, hydrophobicity and molecular mass. J. Chromatogr. B Analyt. Technol. Biomed. Life Sci. 2002;774:53–58. doi: 10.1016/s1570-0232(02)00189-7. [DOI] [PubMed] [Google Scholar]
- Wang H, Hanash S. Intact-protein based sample preparation strategies for proteome analysis in combination with mass spectrometry. Mass Spectrom. Rev. 2004;24:413–426. doi: 10.1002/mas.20018. [DOI] [PubMed] [Google Scholar]
- Wang H, Kachman MT, Schwartz DR, Cho KR, Lubman DM. A protein molecular weight map of ES2 clear cell ovarian carcinoma cells using a two-dimensional liquid separations/mass mapping technique. Electrophoresis. 2002;23:3168–3181. doi: 10.1002/1522-2683(200209)23:18<3168::AID-ELPS3168>3.0.CO;2-A. [DOI] [PubMed] [Google Scholar]
- Washburn MP, Wolters D, Yates JR. Large-scale analysis of the yeast proteome by multidimensional protein identification technology. Nat. Biotechnol. 2001;19:242–247. doi: 10.1038/85686. [DOI] [PubMed] [Google Scholar]
- Washburn MP, Ulaszek R, Deciu C, Schieltz DM, Yates JR., 3rd Analysis of quantitative proteomic data generated via multidimensional protein identification technology. Anal. Chem. 2002;74:1650–1657. doi: 10.1021/ac015704l. [DOI] [PubMed] [Google Scholar]
- Washburn MP, Koller A, Oshiro G, Ulaszek RR, Plouffe D, Deciu C, Winzeler E, Yates JR., 3rd Protein pathway and complex clustering of correlated mRNA and protein expression analyses in Saccharomyces cerevisiae. Proc. Natl. Acad. Sci. U.S.A. 2003;100:3107–3112. doi: 10.1073/pnas.0634629100. [DOI] [PMC free article] [PubMed] [Google Scholar]
- Wolters DA, Washburn MP, Yates JR., 3rd An automated multidimensional protein identification technology for shotgun proteomics. Anal. Chem. 2001;73:5683–5690. doi: 10.1021/ac010617e. [DOI] [PubMed] [Google Scholar]
- Wu B, Abbott T, Fishman D, McMurray W, Mor G, Stone K, Ward D, Williams K, Zhao H. Comparison of statistical methods for classification of ovarian cancer using mass spectrometry data. Bioinformatics. 2003;19:1636–1643. doi: 10.1093/bioinformatics/btg210. [DOI] [PubMed] [Google Scholar]
- Yan F, Sreekumar A, Laxman B, Chinnaiyan AM, Lubman DM, Barder TJ. Protein microarrays using liquid phase fractionation of cell lysates. Proteomics. 2003a;3:1228–1235. doi: 10.1002/pmic.200300443. [DOI] [PubMed] [Google Scholar]
- Yan F, Subramanian B, Nakeff A, Barder TJ, Parus SJ, Lubman DM. A comparison of drug-treated and untreated HCT-116 human colon adenocarcinoma cells using a 2-D liquid separation mapping method based upon chromatofocusing PI fractionation. Anal. Chem. 2003b;75:2299–2308. doi: 10.1021/ac020678s. [DOI] [PubMed] [Google Scholar]
- Yao X, Freas A, Ramirez J, Demirev PA, Fenselau C. Proteolytic 18O labeling for comparative proteomics: Model studies with two serotypes of adenovirus. Anal. Chem. 2001;73:2836–2842. doi: 10.1021/ac001404c. [DOI] [PubMed] [Google Scholar]
- Yasui Y, Pepe M, Thompson ML, Adam BL, Wright GL, Jr., Qu Y, Potter JD, Winget M, Thornquist M, Feng Z. A data-analytic strategy for protein biomarker discovery: Profiling of high-dimensional proteomic data for cancer detection. Biostatistics. 2003a;4:449–463. doi: 10.1093/biostatistics/4.3.449. [DOI] [PubMed] [Google Scholar]
- Yasui Y, McLerran D, Adam BL, Winget M, Thornquist M, Feng ZD. An automated peak identification/calibration procedure for high-dimensional protein measures from mass spectrometers. J. Biomed. Biotechnol. 2003b;4:242–248. doi: 10.1155/S111072430320927X. [DOI] [PMC free article] [PubMed] [Google Scholar]
- Yasui Y, Pepe M, Hsu L, Adam BL, Feng ZD. Partially supervised learning using an EM-boosting algorithm. Biometrics. 2004;60:199–206. doi: 10.1111/j.0006-341X.2004.00156.x. [DOI] [PubMed] [Google Scholar]
- Yu Y, Wu B, Liu J, Li X, Williams K, Zhao H. MALDI-MS data analysis for disease biomarker discovery. In: Nedelkov D, Nelson R, editors. Methods in Molecular Biology: New and Emerging Proteomics Techniques. Humana Press; Totowa, N.J.: 2005. Submitted for publication. [DOI] [PubMed] [Google Scholar]
- Zhang H, Li XJ, Martin DB, Aebersold R. Identification and quantification of N-linked glycoproteins using hydrazide chemistry, stable isotope labeling and mass spectrometry. Nat. Biotechnol. 2003;21:660–666. doi: 10.1038/nbt827. [DOI] [PubMed] [Google Scholar]
- Zhang H, Yan W, Aebersold R. Chemical probes and tandem mass spectrometry: A strategy for the quantitative analysis of proteomes and subproteomes. Curr. Opin. Chem. Biol. 2004;8:66–75. doi: 10.1016/j.cbpa.2003.12.001. [DOI] [PubMed] [Google Scholar]
- Zhou H, Watts JD, Aebersold R. A systematic approach to the analysis of protein phosphorylation. Nat. Biotechnol. 2001;19:375–378. doi: 10.1038/86777. [DOI] [PubMed] [Google Scholar]
- Zhou G, Li H, DeCamp D, Chen S, Shu H, Gong Y, Flaig M, Gillespie JW, Hu N, Taylor PR, Emmert-Buck MR, Liotta LA, Petricoin EF, 3rd, Zhao Y. 2D differential in-gel electrophoresis for the identification of esophageal scans cell cancer-specific protein markers. Mol. Cell. Proteomics. 2002a;1:117–124. doi: 10.1074/mcp.m100015-mcp200. [DOI] [PubMed] [Google Scholar]
- Zhou H, Ranish JA, Watts JD, Aeber-sold R. Quantitative proteome analysis by solid-phase isotope tagging and mass spec-trometry. Nat. Biotechnol. 2002b;20:512–515. doi: 10.1038/nbt0502-512. [DOI] [PubMed] [Google Scholar]
- Zhu H, Bilgin M, Bangham R, Hall D, Casamayor A, Bertone P, Lan N, Jansen R, Bidlingmaier S, Houfek T, Mitchell T, Miller P, Dean DA, Gerstein M, Snyder M. Global analysis of protein activities using proteome chips. Science. 2001;293:2101–2105. doi: 10.1126/science.1062191. [DOI] [PubMed] [Google Scholar]
- Zhu K, Kim J, Yoo C, Miller FR, Lubman DM. High sequence coverage of proteins isolated from liquid separations of breast cancer cells using capillary electrophoresis-time-offlight MS and MALDI-TOF MS mapping. Anal. Chem. 2003a;75:6209–6217. doi: 10.1021/ac0346454. [DOI] [PubMed] [Google Scholar]
- Zhu W, Wang XN, Ma YM, Rao ML, Glimm J, Kovach JS. Detection of cancer-specific markers amid massive mass spectral data. Proc. Natl. Acad. Sci. U.S.A. 2003b;100:14666–14671. doi: 10.1073/pnas.2532248100. [DOI] [PMC free article] [PubMed] [Google Scholar]