

Abstract
This paper examines morphometry of MRI biomarkers derived from the network of temporal lobe structures including the amygdala, entorhinal cortex and hippocampus in subjects with preclinical Alzheimer's disease (AD). Based on template-centered population analysis, it is demonstrated that the structural markers of the amygdala, hippocampus and entorhinal cortex are statistically significantly different between controls and those with preclinical AD. Entorhinal cortex is the most strongly significant based on the linear effects model (p < .0001) for the high-dimensional vertex- and Laplacian-based markers corresponding to localized atrophy. The hippocampus also shows significant localized high-dimensional change (p < .0025) and the amygdala demonstrates more global change signaled by the strength of the low-dimensional volume markers. The analysis of the three structures also demonstrates that the volume measures are only weakly discriminating between preclinical and control groups, with the average atrophy rates of the volume of the entorhinal cortex higher than amygdala and hippocampus. The entorhinal cortex thickness also exhibits an atrophy rate nearly a factor of two higher in the ApoE4 positive group relative to the ApoE4 negative group providing weak discrimination between the two groups.
Highlights
-
•
We examine MRI measures in controls vs. subjects with ‘preclinical AD’.
-
•
Morphometry shape markers of the entorhinal cortex were most discriminating.
-
•
The mean atrophy rate of the entorhinal cortex exceeded the hippocampus or amygdala.
1. Introduction
Brain imaging and magnetic resonance imaging (MRI) studies have substantially advanced our knowledge of regional brain atrophy in Alzheimer's disease (AD). MRI measures are an indirect reflection of the neuronal injury that occurs in the brain as the AD pathophysiological process evolves. Several MRI measures are known to be altered among individuals with AD dementia or MCI, including volumetric MRI. In the initial stages of AD, atrophy on MRI appears to have a predilection for the brain regions with heavy deposits of neurofibrillary tangles (Braak and Braak, 1991; Arnold et al., 1991; Price and Morris, 1999). Consistent with this pattern of neurofibrillary pathology, the volume of the entorhinal cortex, the hippocampus and other medial temporal lobe structures have been shown to discriminate patients with AD dementia versus controls, MCI subjects from controls, and to be associated with time to progress from MCI to AD dementia (Jack et al., 2010). Longitudinal MRI data in cognitively normal individuals who have progressed to mild impairment is extremely limited, but also suggests that volumetric measures of medial temporal lobe regions may be useful in predicting progression from normal cognition to mild or moderate impairment. Differences in atrophy rate of the entorhinal cortex (Jack et al., 2004), the hippocampus or subvolumes of the hippocampus (Jack et al., 2004; Apostolova et al., 2010) and ventricular volume (Carlson et al., 2008) have been demonstrated during preclinical AD. It has also been demonstrated that baseline measures of the hippocampus and amygdala in controls predict subsequent development of mild cognitive impairment (den Heijer et al., 2006). Differences in the shape of the hippocampus have also been reported among controls who subsequently developed incident cognitive impairment (Rusinek et al., 2003; Chiang et al., 2009; Csernansky et al., 2005; den Heijer et al., 2006; Thambisetty et al., 2010).
To date, many MRI studies of subcortical gray matter nuclei have defined a single measure of structural volume for each subcortical structure studied. In this study we have used diffeomorphometry to define subregional atrophy in subcortical gray matter in the entorhinal cortex, hippocampus and amygdala. Like volumetric measures, statistical shape analysis based on the diffeomorphometry allows us to transfer morphometry changes across coordinate systems to template coordinates across which statistics can be obtained in the dataset. This allows for the detection of changes in brain structures which are not uniformly distributed, and may be locally occurring. We examine these changes at multiple scales, from the highest dimension equivalent to the dimension of the vertex representation of each surface of the substructures to the lowest dimension based on the single volume number. From these we also calculate atrophy rates as both absolute volumes as well as a percentage change relative to initial volume.
Methods of statistical shape analysis based on diffeomorphometry for studying normal age related changes in subcortical nuclei and for studying a number of other diseases have already been enlightening (Qiu et al., 2009a, 2009b, 2010; Csernansky et al., 1998, 2000; Wang et al., 2007; Ashburner et al., 2003; Thompson et al., 2004; Younes et al., in press). This study focuses on differences in atrophy rates and shape in three regions of the temporal lobe, including amygdala, hippocampus, and entorhinal cortex (ERC), based on earlier histopathological findings suggesting that they may be affected during the early phase of AD (Arriagada et al., 1992; Herzog and Kemper, 1980; Scott et al., 1991, 1992; Tsuchiya and Kosaka, 1990).
The diffeomorphometry pipeline for network shape analysis presented here follows a general pattern that is common to several of the referred studies, involving an initial coarse rigid alignment phase followed by a high-dimensional template matching phase. This produces a generally high-dimensional representation of the data in a coordinate system in which each coordinate is directly comparable across shapes. In this approach all shape morphometry is registered to a single template coordinate system, which is centered to the population. The statistical analysis uses standard multivariate and linear effects models, in which significance is assessed while taking multiple comparisons into account. We also examine the ERC modeled as a thin laminar structure, enabling us to compute cortical thickness using the volume to surface area ratio approximation for laminar thickness. Focusing on this entire network of structures offers an opportunity to examine the onset of morphometric changes throughout these temporal lobe structures among those with preclinical AD.
2. Subjects and methods
2.1. Study design
The overall study (known as the BIOCARD study), is a longitudinal characterization of individuals including structural brain magnetic resonance imaging (MRI) funded jointly by the National Institute on Aging (NIA) and the National Institute for Mental Health (NIMH). All subjects were cognitively normal when they were recruited. The mean age of the BIOCARD subjects at baseline was 57.1 years. Scans were acquired during the period 1995–2005. The participants have now been followed for up to 17 years. A total of 805 scans have been collected during the 10 year period. In this paper we report on the examination of the temporal lobe circuitry including amygdala, entorhinal cortex, and hippocampus based on shape analysis using diffeomorphometry.
2.2. Selection of participants
A total of 354 individuals were initially enrolled in the study. Recruitment was conducted by the staff of the Geriatric Psychiatry branch of the Intramural Program of the National Institute of Mental Health, beginning in 1995 and ending in 2005. Subjects were recruited via printed advertisements, articles in local or national media, informational lectures, or word-of-mouth. The study was designed to recruit and follow a cohort of cognitively normal individuals who were primarily in middle age. By design, approximately three quarters of the participants had a first degree relative with dementia of the Alzheimer type. The overarching goal was to identify variables among cognitively normal individuals that could predict the subsequent development of mild to moderate symptoms of AD. Toward that end, subjects were administered a comprehensive neuropsychological battery annually. Magnetic resonance imaging (MRI) scans, cerebrospinal fluid (CSF), and blood specimens were obtained every two years. The study was initiated at the NIH in 1995, and was stopped in 2005. In 2009, a research team at the Johns Hopkins School of Medicine was funded to re-establish the cohort, continue the annual clinical and cognitive assessments, collect blood, and evaluate the previously acquired MRI scans, CSF and blood specimens. To the best of our knowledge, this is the only study in participants who were cognitively normal at entry, with this set of measures, and with such a long duration of follow-up.
At baseline, all participants completed a comprehensive evaluation at the Clinical Center of the National Institutes of Health (NIH). This evaluation consisted of a physical and neurological examination, an electrocardiogram, standard laboratory studies (e.g., complete blood count, vitamin B12, thyroid function, etc), and neuropsychological testing. Individuals were excluded from participation if they were cognitively impaired, as determined by cognitive testing, or had significant medical problems such as severe cerebrovascular disease, epilepsy or alcohol or drug abuse. For those with a family history of AD, autopsy records were obtained (whenever feasible) to confirm the presence of AD dementia in an immediate family member. Five subjects did not meet the entry criteria and were excluded at baseline, leaving a total 349 participants, who were followed over time.
2.3. MRI assessments
MRI scans were obtained on 335 participants at baseline. An additional 470 scans were obtained in subsequent years for a total of 805 scans. The mean interval between scan acquisitions on follow-up was 2.02 years. The MRI scans acquired at the NIH were obtained using a standard multi-modal protocol using GE 1.5T scanner. The scanning protocol included localizer scans, Axial FSE (Fast Spin Echo) sequence (TR = 4250, TE = 108, FOV = 512 × 512, thickness/gap = 5.0/0.0 mm, flip angle = 90, 28 slices), Axial Flair sequence (TR = 9002, TE = 157.5, FOV = 256 × 256, thickness/gap = 5.0/0.0 mm, flip angle = 90, 28 slices), Coronal SPGR (Spoiled Gradient Echo) sequence (TR = 24, TE = 2, FOV = 256 × 256, thickness/gap = 2.0/0.0 mm, flip angle = 20, 124 slices), Sagittal SPGR (Spoiled Gradient Echo) sequence (TR = 24, TE = 3, FOV = 256 × 256, thickness/gap 1.5/0.0 mm, flip angle = 45, 124 slices).
2.4. Clinical and cognitive assessment
The clinical and cognitive assessments of the participants have been described elsewhere (Albert et al., submitted). The cognitive assessment consisted of a neuropsychological battery covering all major cognitive domains (i.e., memory, executive function, language, spatial ability, attention and processing speed). A clinical assessment was also conducted annually. Since the study has been conducted at Johns Hopkins, this has included the following: a physical and neurological examination, record of medication use, behavioral and mood assessments (Cummings et al., 1994; Yesavage et al., 1982), family history of dementia, history of symptom onset, and a Clinical Dementia Rating (CDR), based on a semi-structured interview(Hughes et al., 1982; Morris, 1993). The clinical assessments given at the NIH covered similar domains.
2.5. Consensus diagnoses
Consensus diagnoses were completed annually at the NIH. After the study was re-established at Johns Hopkins, the diagnostic procedures have been identical to those used in the Alzheimer's Disease Research Centers program, funded by the National Institute on Aging. This involves a two-step process by which a decision is first made about whether the subject is normal, mildly impaired or demented (based on the clinical history and the cognitive testing), and then (if the subject is judged not to be normal) the likely cause(s) of the cognitive impairment is determined. This same diagnostic process was applied retrospectively to participants who had become cognitively impaired while the study was being conducted at the NIH, but who (by the time the study had been re-established at Johns Hopkins) were either moderate-to-severely impaired or were no longer living. All of the members of the clinical research team participated in the consensus diagnostic process, including: neurologists, neuropsychologists, research nurses, and research assistants. It should be noted that the estimated age-of-onset of clinical symptoms, which is the primary outcome in these analyses, was established on the basis of clinical information elicited during the clinical interview by the clinician who evaluated the subject (or on the basis of clinical notes in the record), and re-confirmed during the consensus conference.
During the acquisition of the scans at the NIH, 9 subjects were diagnosed with dementia of Alzheimer's type, and 8 subjects were diagnosed with mild cognitive impairment (MCI). During that period there were a total of 302 subjects with MRI scans who continued to be cognitively normal. Over time, an additional number of subjects had developed MCI or AD dementia. The focus of this paper is the subjects who were normal when the scans were taken but subsequently became symptomatic, compared to the subjects who remained cognitively normal.
2.6. MRI scans available for analysis
Of the 335 subjects with MRI scans at baseline, a total of 230 individuals remained cognitively normal and 51 developed incident cognitive impairment and were diagnosed with MCI (of these, 8 subsequently progressed to AD dementia). The subjects who were controls at baseline but became impaired over time are referred to here as having ‘preclinical AD’, consistent with a recent working group report on this topic (Sperling et al., 2011). Of the 230 controls who remained controls on follow-up, 136 had repeat MRI scans (M = 2.98/subject). Of the 51 participants with preclinical AD, 33 had repeat MRI scans (M = 2.94/subject). During the period of MRI acquisition 17 participants received a diagnosis of MCI or AD dementia; these subjects were not included in the analysis. In addition, 26 participants who remained controls during the MRI acquisition phase received a diagnosis of Impaired not MCI on follow-up; these subjects were not included in the analysis. A total of 18 scans had sufficient artifact that they could not be used for the present study, leaving a total of 283 MRI scans at baseline (when all participants were cognitively normal) and 333 MRI scans obtained over time (controls = 269, preclinical AD = 64). Additionally, for the examination of atrophy rates, we only included subjects with 3 or more MRI scans (81 controls and 20 cases of preclinical AD). We also compared the MRI measures on the basis of the participants ApoE4 status; the subjects with 3 or more MRI scans available for these analyses were as follows: ApoE4 positive = 44 and ApoE4 negative = 73.
Table 1 summarizes the subjects in the two groups that were the focus of these analyses, the controls and those with preclinical AD. Table 2 summarizes the subjects in the same groups separated based on their ApoE4 positive and ApoE4 negative genes. The region-of-interest analyses described below have been completed for the amygdala, hippocampus, and entorhinal cortex for all of the subjects listed in the columns.
Table 1.
Participant characteristics at baseline and follow-up features stratified by outcome status.
| Variable | Control group (N = 230) |
Progressed to MCI or AD (N = 51) |
|---|---|---|
| Age at entry, mean number of years (SD) | 55.4 (9.8)⁎ | 62.5 (11.5)⁎⁎ |
| Gender, females (%) | 60.9% | 49.0% |
| Education, mean number of years (SD) | 17.2 (2.3) | 16.9 (2.4) |
| Ethnicity, Caucasians (%) | 98.3% | 94.1% |
| ApoE-4 carriers (%) | 32.6% | 33.3% |
| MMSE at entry, mean score (SD) | 29.7 (0.7) | 29.5 (0.8) |
| Total follow-up time, mean number of years (SD) | 8.5 (3.4) | 10.1 (2.6)⁎⁎ |
| Number of MRI measures, mean per subject (SD) | 2.2 (1.2) | 2.3 (1.2) |
| MRI follow-up time, mean number of years (SD) | 4.1 (2.1) | 4.3 (2.1) |
Abbreviations: ApoE-4, apolipoprotein E-4; MMSE, Mini-Mental State Exam.
p = .05.
p = .001.
Table 2.
Participant characteristics at baseline and follow-up features stratified by apolipoprotein E (ApoeE) status.
| Variable |
ApoE-4 present (N = 39) |
ApoE-4 absent (N = 62) |
|---|---|---|
| Age at entry, mean number of years (SD) | 56.9 (6.4)⁎ | 58.1 (10.0)⁎⁎ |
| Gender, females (%) | 71.8% | 59.7% |
| Education, mean number of years (SD) | 17.2 (2.2) | 16.8 (2.7) |
| Ethnicity, Caucasians (%) | 97.4% | 98.4% |
| MMSE at entry, mean score (SD) | 29.7 (0.8) | 29.6 (0.7) |
| Total follow-up time, mean number of years (SD) | 11.3 (2.5) | 11.0 (2.7) |
| Number of MRI measures, mean per subject (SD) | 3.6 (0.8) | 3.6 (0.7) |
| MRI follow-up time, mean number of years (SD) | 5.3 (1.8) | 5.4 (1.6) |
Abbreviations: ApoE-4, apolipoprotein E-4; MMSE, Mini-Mental State Exam.
p = .05
p = .001.
2.7. Surface based morphometry
We extend the statistical analyses of diffeomorphometry followed in previous papers (Qiu et al., 2009a, 2009b, 2010; Csernansky et al., 1998, 2000; Wang et al., 2007; Ashburner et al., 2003; Thompson et al., 2004; Younes et al., in press) to include the temporal lobe entorhinal cortex structure along with the amygdala and hippocampus. This procedure has three steps: (i) segmentation of the target structures, (ii) generation of a single template coordinate system from the population of baseline scans, and (iii) mapping of the template onto each of the target segmented structures represented via triangulated meshes. The first step is the segmentation of the structures for which we extend the region-of-interest large deformation diffeomorphic metric mapping (ROI-LDDMM) procedure described previously (Csernansky et al., 1998; Munn et al., 2007) to the entorhinal cortex. The landmark definitions in ROI methods are used to ensure consistency of mapping, and have been published for amygdala and hippocampus in the aforementioned. The entorhinal cortex is a structure which admits considerable variation among protocols (Feczko et al., 2009; Honeycutt et al., 1998; Insausti et al., 1998). Our approach for definition follows Feczko et al. (2009) by defining the lateral extent of the entorhinal cortex at the shoulder of the medial bank of the collateral sulcus, including the maximal extent of the entorhinal cortex as can be defined in MRI over the entire length of the hippocampal head. However our approach differs in the caudal extent by defining the caudal boundary as 2 mm posterior to the most rostral slice showing gyrus intralimbicus (moving rostral to caudal in coronal plane) whereas the Feczko et al. approach defines the caudal extent relative to the lateral geniculate nucleus. Landmarks were placed on the sections uniformly along the head–tail principal axis as for the amygdala and hippocampus, with the details of the procedure and boundary definitions described in http://caportal.cis.jhu.edu/protocols. Once landmarking is complete, ROI-LDDMM (landmark matching (Joshi and Miller, 2000) and image matching (Beg et al., 2005)) are used to generate the segmented binary volumes which were converted into triangulated surfaces. In ROI-LDDMM the initial template used for mapping was selected to be a smooth amygdala, hippocampus, and ERC taken from a group of ten hand segmented sets of structures choosing the initial template with average volume for the group of ten. Fig. 1 shows a view of the surface reconstructions embedded in the corresponding MR imagery of one subject.
Fig. 1.
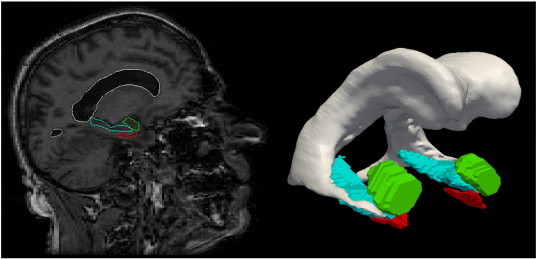
Reconstructions of the amygdala (green), entorhinal cortex (red) and hippocampus (blue) of one subject. (For interpretation of the references to color in this figure legend, the reader is referred to the web version of this article.)
To generate shape biomarkers indexed to a common coordinate system, we follow the procedure published in Younes et al. (in press) in which all surfaces are rigidly aligned via rotation and translation, with right subvolumes flipped before alignment to ensure that all structures could be compared. From rigidly aligned volumes, an average template shape was generated based on a generative probability model over the entire population in which the observed surfaces are modeled as random deformations of the template (Ma et al., 2010). This template generation procedure generates coordinate systems centered to the population by performing surface mapping many times and is much more efficient than volume mapping (Ma et al., 2008). The resulting templates for the amygdala, entorhinal cortex and hippocampus become the coordinate systems which are referenced for our p-value statistics and FWER (Family-wise Error Rate) diagrams. The templates are visualized in Fig. 2. These were computed by running the template generation algorithm on the population of 325 baseline scans and are blind to group labels. For normalization against intracranial volume (TIV), TIV was calculated using coronal SPGR scans in Freesurfer 5.1.0 (Segonne et al., 2004). The large sample size of 325 subjects included in this study should outweigh any concerns about how FreeSurfer calculates TIV (Pengas et al., 2009).
Fig. 2.
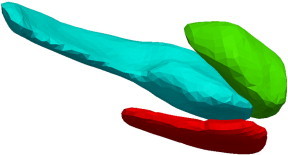
Template for left amygdala (green), entorhinal cortex (red) and hippocampus (blue) template generated from the population of 173 baseline scans. All linear mixed effects model p-values reported in the tables and in the FWER visualization are computed relative to the templates. (For interpretation of the references to color in this figure legend, the reader is referred to the web version of this article.)
Given the template, the high-dimensional shape statistics are generated indexed to each location of the template by computing the diffeomorphic correspondence between the template and each surface using LDDMM surface registration (Vaillant and Glaunes, 2005). The algorithm computes a smooth, invertible mapping of the triangulated surface template Stemp onto the target surfaces Starget minimizing the fidelity criterion measuring the distance between the mapped template and target selecting the mapping minimizing the matching cost and geodesic transformation energy (Vaillant et al., 2007; Qiu and Miller, 2008).
2.8. Entorhinal cortex laminar thickness reconstruction
The entorhinal cortex is modeled as both a subvolume for morphometric shape analysis as well as a thin laminar cortical structure from which a single laminar thickness estimate is generated. First, a closed smooth surface is generated from the segmented gray matter volume. Then the gray/white surface is extracted from the closed surface by curvature-based dynamic programming delineation of the extremal boundaries (Ratnanather et al., 2003) so that the surface closest to the white matter is retained. It was found that from about 100 closed surfaces, the surface area of the corresponding gray/white matter surfaces were on average about 35.7% of that of the closed ones. So as an approximation, the surface area for the entire population was calculated as 0.357 of the corresponding closed surface. In addition, the laminar thickness is calculated as a single parameter based on the ratio of volume/surface-area in units of mm.
2.9. Group based mixed linear effects statistical analysis
We performed statistical analyses comparing the amygdala, entorhinal cortex and hippocampus subvolumes between the two groups (controls vs. preclinical AD), and making separate comparisons of the shape markers corresponding to the degree of atrophy relative to the template between the groups. Differences between groups, based on apolipoprotein E4 genotype (ApoE4) were also examined. We model the shape markers via linear and mixed effects modeling. The linear model previously used in Younes et al. (in press) takes the absolute volume and atrophy rate of the linear model as a function of age as different between the two groups, denoted . The mixed effects as used by Bernal-Rusiel et al. (2012) corresponds to representing the noise in the measuring shape marker as corresponding to two different processes, one associated to the time series within a subject, and the second noise associated to the cross-sectional variation from subject to subject. The analysis includes age, gender and log intracranial volumes as covariates, and computes statistics at each vertex of the triangulated template surface returning p-values corrected for multiple comparisons using permutation testing (Nichols and Hayasaka, 2003).
The analysis uses a mixed linear effects model for each vertex v, scan j and subject s. For this, each subject's left and right structures (controls and patients) has been registered to the template, resulting in the computation of a normalized deformation marker yvj(s) measuring how much expansion/atrophy at vertex v of the template surface in registering it to subject s for scan j. The raw expansion/atrophy measure is defined as the logarithm of the local expansion/reduction in surface area around the vertex, interpreted mathematically as a log-jacobian on the template surface. This measure is then normalized for variations due to gender and intracranial volume by fitting a linear regression model that predicts the former by the latter, and taking the residual, yielding yvj(s). This normalization is group independent.
We model the group variables as g(s) equaling 1 if subject s belongs to the preclinical AD group and zero if the subject belongs to the control group. Our deformation marker model is given by the equation
| (1) |
where the notation is as follows:
-
•
yvj(s) is the deformation marker for subject s at scan j, with v indexing the vth vertex of the deformation marker (or one of the 25 Laplace Beltrami coefficients or a single log-volume), after correction for intracranial volume and gender. Correction is done by taking residuals after least-squares linear regression of the shape variables by the covariates;
-
•
aj(s) is the subject's age at scan j;
-
•
g(s) is the subject's group (g = 0 for control, g = 1 for disease);
-
•
εvj(s) represents the noise, and is modeled as εvj(s) = ηv(s) + ζvj(s) where ηv(s) is a “random effect” that measures between-subject variation and ζvj(s) measures within-subject variation. Both processes are assumed to be centered Gaussian, with variance ρvσv2 and σv2, respectively.
Parameters and ρv are estimated by maximum-likelihood with the estimation procedure derived in the supplement. We test for the null hypothesis with for all v, while correcting for multiple comparisons. For volume testing the logarithm of the volume is used because it is appropriate for the additive noise model. The p-values of these models are computed using permutation sampling (Nichols and Hayasaka, 2003) running until 10% accuracy is reached with high probability. The test statistic is the log-likelihood difference between the null hypothesis and the alternative general hypothesis computing for all vertices the statistic
| (2) |
The parameters are estimated by maximum likelihood for all dimensions v for each of the two hypotheses. Evaluating the log-likelihood in each case at the MLE's of the parameters gives the log-likelihood essentially determined by the mixed sums of squares as shown in the supplement.
The joint test statistic is computed from Eq. (2) with family-wise error rates (FWER) calculated by evaluating the maximum S∗ = max vSv. p-Values are computed using permutation sampling running until a 10% accuracy is reached with high probability. The maximum value S∗ is compared to those obtained by performing the same computation a large number of times, with group labels randomly assigned to subjects. The p-value is given by the fraction of times the values of S∗ computed after permuting the labels is larger than the value obtained with the true groups. The p-values that were observed via the linear effects modeling of deformation markers of Eqs. (1), (2) are provided, for each structure including the left and right sides of the brain in Table 5. The volume statistics shown in column 4 of Table 5 for the three groups provides p-values for the same linear effects model, also evaluated via permutations, in which y is replaced by the structure volume, for which no multiple testing correction is required. This permutation testing procedure also provides a (conservative) estimate of the set of vertices v on which the null hypothesis is not valid. This set is defined by D = {v : Sv ≥ q∗} where q⁎ is the 95 percentile of the observed value of S∗ over the permutations (Nichols and Hayasaka, 2003). Figs. 4 and 5 illustrate the vertex markers on the entorhinal cortex that were significant, coloring these vertices with an atrophy measure defined as , where are the coefficients associated to the group variable in the regression model for vertex v, and is the average age in the preclinical AD population. We also performed a similar analysis based on the decomposition of the deformation marker y(s) over the orthonormal basis formed by the eigenvectors of the Laplace–Beltrami operator on the template surface (Miller and Qiu, 2009). We used the 25 first eigenvectors and followed the same statistical construction in which the original marker y(s) is replaced by its 25-dimensional projection on the basis. Results from this procedure are also reported in Table 4.
Table 5.
Morphometry measures comparing normal group vs preclinical AD group.
| Structures examined | p-Values based on vertex measure Control vs. preclinical AD |
p-Values based on Laplace measure Controls vs. preclinical AD |
p-Values based on volume measure Controls vs. preclinical AD |
|---|---|---|---|
| Amygdala (L) | 0.17 | 0.13 | 0.0086 |
| Hippocampus (L) | 0.022 | 0.33 | 0.073 |
| ERC (L) | < 0.0001 | 0.0001 | 0.51 |
| Amygdala (R) | 0.031 | 0.029 | 0.0043 |
| Hippocampus (R) | 0.0025 | 0.08 | 0.79 |
| ERC (R) | 0.0067 | 0.0003 | 0.17 |
The table presents the p-values resulting from linear mixed effects models testing controls versus preclinical AD based on the Vertex (column 2), Laplace Beltrami (column 3) and Volume (column 4) morphometry measures. Columns list p-values for the vertex (750–1000 dimensions per structure), Laplace (25 dimensions) and volume markers (1 dimension per structure).
Fig. 4.
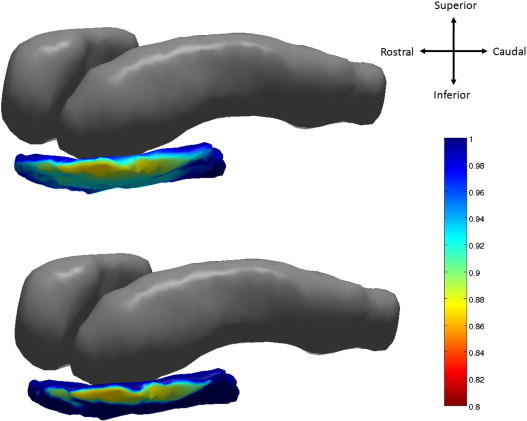
Top: atrophy visualization in left entorhinal cortex as measured by linear effects model fit evaluated at average age of natural log of Jacobian of atrophy and atrophy ratedemonstrating percentage decrease of control to preclinical group. Bottom: statistically significant vertices at 5% FWER.
Fig. 5.
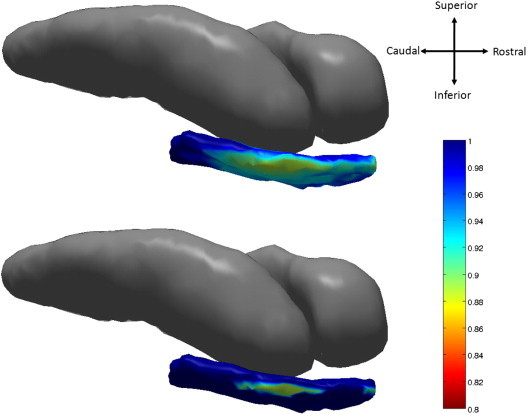
Top: atrophy visualization in right entorhinal cortex as measured by linear effects model fit of natural log of Jacobian of atrophy and atrophy rate evaluated at average age demonstrating percentage decrease of control to preclinical group. Bottom: shows statistically significant vertices as measured by permutation testing at 5% FWER.
Table 4.
p-Values for annualized atrophy rates comparing normal group vs preclinical AD group.
| Groups | Side | p-value atrophy rate Amygdala |
p-value atrophy rate Hippocampus | p-value atrophy rate ERC |
p-value atrophy rate ERC thickness |
|---|---|---|---|---|---|
| Control vs Preclinical AD | Left | 0.046 | 0.486 | 0.161 | 0.145 |
| Right | 0.157 | 0.3304 | 0.011 | 0.041 | |
| Bilateral | 0.042 | 0.07 | 0.021 | 0.050 | |
| ApoE4 + vs ApoE4 − | Left | 0.324 | 0.155 | 0.420 | 0.059 |
| Right | 0.462 | 0.329 | 0.144 | 0.062 | |
| Bilateral | 0.382 | 0.084 | 0.208 | 0.030 |
The table shows the p-value testing on rate of change resulting from linear fitting of volumes for control versus preclinical AD groups (row 2), and ApoE4 positive versus ApoE4 negative groups (row 3) for amygdala (column 3 showing left, right, bilateral), hippocampus (column 4 showing left, right, bilateral) and ERC volume and thickness (columns 5, 6 respectively).
3. Results
Table 3 shows the rates of atrophy for linear fits of the amygdala, hippocampus and entorhinal cortex volumes as a function of scan number for the controls and the preclinical AD subjects. For fitting the atrophy rates, the sample was censored so as to include subjects whose time series contained three or more scans but was not normalized by intracranial volume covariates. We see the amygdala atrophy rate increasing from .6% to nearly 1.2% per-year from control to preclinical AD groups, and the entorhinal cortex atrophy rate from 1.0% to 2.7%. The atrophy rate of the thickness of the entorhinal cortex also increases from 0.33% in controls to 1.04% in the preclinical AD cases. Also, we see an increase in atrophy rate nearly doubling in the ApoE4-positive relative to ApoE4-negative groups in the thickness of the entorhinal cortex. Interestingly, the atrophy rate of the entorhinal cortex of 1.0% in the control groups is two to three times the control atrophy rates of the amygdala and hippocampus.
Table 3.
Annualized atrophy rates for normal group and preclinical AD group.
| Groups | Amygdala mm3/year | Amygdala %/year | Hippocampus mm3/year | Hippocampus %/year | ERC mm3/year | ERC %/year | ERC thickness mm/year | ERC thickness %/year |
|---|---|---|---|---|---|---|---|---|
| L controls (n = 81) | 4.6 ± 39.1 | 0.2 ± 2.7 | 14.0 ± 25.2 | 0.5 ± 0.9 | 4.9 ± 19.8 | 0.8 ± 4.3 | .008 ± 0.043 | 0.34 ± 1.89 |
| L preclinical (n = 20) | 16.8 ± 25.3 | 1.0 ± 1.6 | 14.4 ± 29.1 | 0.5 ± 1.1 | 8.1 ± 15.3 | 1.7 ± 3.2 | .022 ± 0.050 | 0.92 ± 2.20 |
| L ApoE4 + (n = 44) | 4.9 ± 45.3 | 0.2 ± 3.2 | 12.9 ± 29.6 | 0.6 ± 1.0 | 4.8 ± 20.8 | 0.7 ± 4.6 | .019 ± 0.047 | 0.76 ± 2.02 |
| L ApoE4 − (n = 73) | 8.2 ± 32.4 | 0.4 ± 2.1 | 11.9 ± 24.3 | 0.4 ± 0.9 | 5.1 ± 19.5 | 0.5 ± 6.5 | .004 ± 0.054 | − 0.01 ± 3.22 |
| R controls (n = 81) | 14.2 ± 29.8 | 0.9 ± 2.0 | 21.2 ± 31.8 | 0.9 ± 1.9 | 5.5 ± 19.7 | 0.9 ± 4.2 | .007 ± 0.039 | 0.28 ± 1.78 |
| R preclinical (n = 20) | 22.0 ± 27.1 | 1.4 ± 1.8 | 4.6 ± 28.5 | 1.1 ± 1.4 | 13.2 ± 19.2 | 3.3 ± 3.8 | .024 ± 0.040 | 1.08 ± 1.79 |
| R ApoE4 + (n = 44) | 14.5 ± 28.6 | 1.0 ± 2.0 | 20.8 ± 33.4 | 0.8 ± 1.8 | 8.4 ± 24.1 | 1.6 ± 4.9 | .014 ± 0.047 | 0.60 ± 2.10 |
| R ApoE4 − (n = 73) | 16.7 ± 37.1 | 1.0 ± 2.4 | 14.5 ± 30.4 | 0.9 ± 2.3 | 4.3 ± 17.3 | 0.6 ± 4.7 | .001 ± 0.040 | − 0.03 ± 2.18 |
| B controls (n = 81) | 9.4 ± 27.6 | 0.6 ± 1.8 | 17.6 ± 22.4 | 0.7 ± 0.9 | 5.2 ± 14.8 | 1.0 ± 3.3 | .008 ± 0.031 | 0.33 ± 1.42 |
| B preclinical (n = 20) | 19.4 ± 19.2 | 1.2 ± 1.2 | 9.5 ± 20.6 | 0.3 ± 0.8 | 10.6 ± 14.4 | 2.7 ± 3.1 | .023 ± 0.039 | 1.04 ± 1.73 |
| B ApoE4 + (n = 44) | 9.7 ± 29.4 | 0.6 ± 2.0 | 16.9 ± 25.1 | 0.7 ± 0.9 | 6.6 ± 16.2 | 1.3 ± 3.4 | .016 ± 0.034 | 0.71 ± 1.48 |
| B ApoE4 − (n = 73) | 12.5 ± 30.0 | 0.7 ± 1.9 | 13.2 ± 20.7 | 0.5 ± 0.8 | 4.7 ± 15.9 | 0.6 ± 5.5 | .002 ± 0.042 | 0.01 ± 2.47 |
The table presents the volume atrophy rates and standard deviations in % and mm3/year for amygdala (columns 2 and 3), hippocampus (columns 4 and 5) and entorhinal cortex (ERC) (columns 6 and 7), for time series with at least 3 scans. The top group of four rows is for L = Left; the middle group of four rows is for R = Right; the bottom group of four rows is for B = Bilateral; three preclinical subjects with hippocampal volume atrophy rates were outliers and were removed.
We tested on the volume based atrophy rates percentages of the amygdala, the hippocampus and the entorhinal cortex, with the resulting p-values shown in Table 3 generally showing weakly significant differences between the controls versus preclinical AD. The thickness of the entorhinal cortex was also weakly significantly different in ApoE4-positive versus ApoE4-negative subjects when studied bilaterally (p = .03).
Fig. 3 visualizes localized atrophy in volume across the left amygdala, entorhinal cortex, and hippocampus as percentage decrease (Jacobian) between the control population and the preclinical AD population. The average template shape was created for each of the control and preclinical AD groups representing the centers of the population. Shown on the control group template is the surface Jacobian of the diffeomorphism mapping one population to the other. The color scale indicates atrophy deformation change for the Jacobian on the scale of 0.8–1.
Fig. 3.
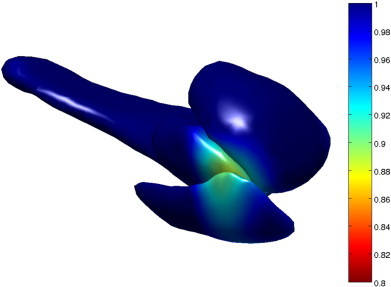
A visualization of atrophy on the left amygdala, entorhinal cortex, and hippocampus as percentage decrease (Jacobian) in volume between the control population and the preclinical population. The transformation whose Jacobian is shown is a diffeomorphism between a template centered to the control group, and a template centered to the preclinical group. The surface that the Jacobian is visualized on corresponds to the control group template.
We now present the p-value statistical results that were obtained for the template based morphometry linear effects model analyses of Eqs. (1), (2) quantifying morphometric change locally across the amygdala, hippocampus, entorhinal cortex template coordinate systems for the preclinical cohort. Table 5 shows the p-value significance between the groups and substructures, for the controls versus the preclinical cases. Significance is shown as measured in order of parametric dimension, with vertex-based change the highest order of 750–1000 dimensions per structure, the Laplacian representation of 25 dimensions per structure, and volume only one dimension per structure. Our general findings are that significance increases as a function of dimension, with volume based testing the least powerful in terms of significance.
As shown in Table 5, the entorhinal cortex is the most strongly significant based on the linear effects model using both of the subsets of the high-dimensional vertex and Laplacian-based markers for the controls vs. those with preclinical AD. Notice that many of the high-dimensional markers (vertex and Laplace) show strongest significance, with the vertex markers < .0001 for the preclinical AD group. This implies more localized change is significant in the entorhinal cortex. This can be contrasted with the amygdala which is also significant, but demonstrates more global change signaled by the strength of the low-dimensional markers. The hippocampus is also significant between the groups, but only associated to the high-dimensional vertex markers implying locality of change in these preclinical groups. The high-dimensional vertex and Laplacian markers imply the entorhinal cortex is the earliest signaler of the disease.
Diffeomorphometry allows for the detection of the anatomical regions within the subcortical structures, which carry the discriminating information between groups. Figs. 4 and 5 respectively, visualize the vertex coordinates on the left and right template entorhinal cortex in the linear mixed effect model for the group-wise analysis. The top panel of Fig. 4 shows image intensity on the templates which is proportional to atrophy level, given by , where is the average age in the study and β, β′ are estimated according to the model of Eqs. (1), (2) using maximum-likelihood estimation (see Supplement) with a parameter value at each vertex. These values are all positive, indicating that group difference is only associated to atrophy. The range of volume decrease as measured by the Jacobian is 0.8 to 1. The bottom panel shows only the vertices on the surfaces of the templates which are statistically significant for atrophy as measured by the permutation testing, demonstrating statistically significant change for the controls versus the preclinical AD cases based on family wise error rates FWER = 5%. Non-significant vertices have zero intensity. These are the vertices which give rise to the vertex p-value statistic in the table of < .0001 for the entorhinal cortex. We have placed the template back into its relative position in an actual brain so that the statistical responses on the template structures can be seen relative to the others (Table 5).
4. Discussion
MRI measures of the amygdala, hippocampus and entorhinal cortex based on both volume and template-centered morphometric population analysis demonstrate that there are statistically significant differences between controls and subjects with preclinical AD. With respect to the localized morphometric analyses, the entorhinal cortex is the most strongly significant based on the linear effects model (p < .0001 left, p = .0067 right) for the high-dimensional surface-based vertex measures signaling localized atrophy. The hippocampus shows significant localized high-dimensional change (p = .022 left, p < .0025 right). The amygdala shows significance for localized high-dimensional change (p = .031 right). This is consistent with the hypothesis that the ERC is more affected in the early onset of the disease than the other structures. Interestingly, only the amygdala demonstrates global morphometric volume change signaled by the strength of the low-dimensional volume markers (p = .0086 left, p = .0043 right).
Atrophy rates based on linear fits to the volume measure for the three structures showed that the annual atrophy rate of the total volume of the entorhinal cortex, the total volume of the amygdala and the right hippocampus is greater in the preclinical AD group vs the controls. The average rate of atrophy of entorhinal cortex is higher than that of the amygdala or the hippocampus. Additionally, the atrophy rate of the entorhinal cortex thickness in the ApoE4-positive group was nearly twice that of the ApoE4-negative group providing significance testing between the two groups (p < .03).
The ERC volume findings are largely consistent with previous reports, and demonstrate the substantially greater rate of change in entorhinal cortex volume during preclinical AD, as compared with the other two structures amygdala and hippocampus. The template-based morphometry findings showing localized shape change in the entorhinal cortex are consistent with histological findings indicating that AD begins to manifest itself in the entorhinal cortex (Gomez-Isla et al., 1996). The transentorhinal region referred to by Braak and Braak, 1991 connects to the lateral boundary that shows significant atrophy in these analyses, as shown in Fig. 4 (left) and 5 (right).
A differential rate of change in the entorhinal cortex, as compared to the hippocampus, has previously been reported among individuals with MCI who subsequently progressed to AD dementia (Du et al., 2001; Dickerson et al., 2001; Jagust et al., 2006; Du et al., 2006; Jack et al., 2010). Our findings indicate that this differential rate of change also pertains to individuals with preclinical AD.
Localized template-based differences in morphometry representing localized alterations in shape of the entorhinal cortex and amygdala during preclinical AD have not, to our knowledge, been previously reported. The finding with regard to the hippocampus is consistent with our previous report in a separate group of subjects with preclinical AD (Csernansky et al., 2005).
The findings with regard to the amygdala are consistent with volumetric changes, as well as non-uniform shape changes, which have been reported in symptomatic AD, such as the volume changes noted in (Poulin et al., 2011) and recent shape analysis by Cavedo et al. (2011) and Qiu et al. (2009b) which used similar morphometric approaches applied to parcellated subfield atlases.
These findings warrant further investigation in several directions. Despite the small rise, atrophied subregions of the amygdala, entorhinal cortex and hippocampus could be detected with p-values based on family-wise error rates which, unlike false discovery rates, have the advantage of not requiring additional assumptions on the data such as independence or positive dependence. Such approaches also present the possibility of direct estimation of onset times of the disease within the temporal lobe structures providing direct estimates within the temporal lobe structures of the progression of the disease.
Acknowledgments
This study is supported in part by grants from the National Institutes of Health: U01-AG03365, P50-AG005146 and P41-RR015241. The BIOCARD Study consists of 7 Cores with the following members: (1) the Administrative Core (Marilyn Albert, Susan Larson and Nicole Favaro), (2) the Clinical Core (Ola Selnes, Marilyn Albert, Rebecca Gottesman, Ned Sacktor, Guy McKhann, Scott Turner, Leonie Farrington, Maura Grega, Stephanie Kielb, Daniel D'Agostino, Sydney Feagen, David Dolan, Hillary Dolan), (3) the Imaging Core (Michael Miller, Susumu Mori, Tilak Ratnanather, Timothy Brown, Anthony Kolasny, Kenichi Oishi, William Schneider, Laurent Younes), (4) the Biospecimen Core (Richard O'Brien, Abhay Moghekar, Ming Li), (5) the Informatics Core (Roberta Scherer, Curt Meinert, David Shade, Ann Ervin, Jennifer Jones, Matt Toepfner, Sravan Nagireddy, Alka Ahuja, Malathi Ram, April Patterson, Lisa Lassiter), the (6) Biostatistics Core (Mei-Cheng Wang, Shanshan Li, Yi Lu), and (7) the Neuropathology Core (Juan Troncoso, Barbara Crain, Olga Pletnikova, Gay Rudow, Karen Wall).
We are grateful to the members of the BIOCARD Scientific Advisory Board who provide continued oversight and guidance regarding the conduct of the study including: Drs. John Csernansky, David Holtzman, David Knopman, Walter Kukull and John McArdle, as well as Drs. Neil Buckholtz, John Hsiao, Laurie Ryan and Jovier Evans, who provide oversight on behalf of the National Institute on Aging (NIA) and the National Institute of Mental Health (NIMH), respectively. We would also like to thank the members of the BIOCARD Resource Allocation Committee who provide ongoing guidance regarding the use of the biospecimens collected as part of the study, including: Drs. Constantine Lyketsos, Carlos Pardo, Gerard Schellenberg, Leslie Shaw, Madhav Thambisetty, and John Trojanowski.
We would like to acknowledge the contributions of the Geriatric Psychiatry Branch (GPB) of the intramural program of the NIMH who initiated the study (PI: Dr. Trey Sunderland). We are particularly indebted to Dr. Karen Putnam, who has provided ongoing documentation of the GPB study procedures and the datafiles received from NIMH.
Footnotes
This is an open-access article distributed under the terms of the Creative Commons Attribution-NonCommercial-ShareAlike License, which permits non-commercial use, distribution, and reproduction in any medium, provided the original author and source are credited.
Appendix A. Supplementary data
Supplementary material.
References
- Apostolova L.G., Mosconi L., Thompson P.M., Green A.E., Hwang K.S., Ramirez A., Mistur R., Tsui W.H., De Leon M.J. Subregional hippocampal atrophy predicts Alzheimer's dementia in the cognitively normal. Neurobiol. Aging. 2010;31:1077–1088. doi: 10.1016/j.neurobiolaging.2008.08.008. [DOI] [PMC free article] [PubMed] [Google Scholar]
- Arnold S.E., Hyman B.T., Flory J., Damasio A.R., Van Hoesen G.W. The topographical and neuroanatomical distribution of neurofibrillary tangles and neuritic plaques in the cerebral cortex of patients with Alzheimer's disease. Cereb. Cortex. 1991;1:103–116. doi: 10.1093/cercor/1.1.103. [DOI] [PubMed] [Google Scholar]
- Arriagada P.V., Growdon J.H., Hedley-Whyte E.T., Hyman B.T. Neurofibrillary tangles but not senile plaques parallel duration and severity of Alzheimer's disease. Neurology. 1992;42:631–639. doi: 10.1212/wnl.42.3.631. [DOI] [PubMed] [Google Scholar]
- Ashburner J., Csernansky J.G., Davatzikos C., Fox N.C., Frisoni G.B., Thompson P.M. Computer-assisted imaging to assess brain structure in healthy and diseased brains. Lancet Neurol. 2003;2:79–88. doi: 10.1016/s1474-4422(03)00304-1. [DOI] [PubMed] [Google Scholar]
- Beg M.F., Miller M.I., Trouv\'E A., Younes L. Computing metrics via geodesics on flows of diffeomorphisms. Int. J. Comput. Vis. 2005;61:139–157. [Google Scholar]
- Bernal-Rusiel J.L., Greve D.N., Reuter M., Fischl B., Sabuncu M.R., For The Alzheimer's Disease Neuroimaging I Statistical analysis of longitudinal neuroimage data with linear mixed effects models. NeuroImage. 2012;66C:249–260. doi: 10.1016/j.neuroimage.2012.10.065. [DOI] [PMC free article] [PubMed] [Google Scholar]
- Braak H., Braak E. Neuropathological stageing of Alzheimer-related changes. Acta Neuropathol. 1991;82:239–259. doi: 10.1007/BF00308809. [DOI] [PubMed] [Google Scholar]
- Carlson N.E., Moore M.M., Dame A., Howieson D., Silbert L.C., Quinn J.F., Kaye J.A. Trajectories of brain loss in aging and the development of cognitive impairment. Neurology. 2008;70:828–833. doi: 10.1212/01.wnl.0000280577.43413.d9. [DOI] [PubMed] [Google Scholar]
- Cavedo E., Boccardi M., Ganzola R., Canu E., Beltramello A., Caltagirone C., Thompson P.M., Frisoni G.B. Local amygdala structural differences with 3T MRI in patients with Alzheimer disease. Neurology. 2011;76:727–733. doi: 10.1212/WNL.0b013e31820d62d9. [DOI] [PMC free article] [PubMed] [Google Scholar]
- Chiang M.C., Avedissian C., Barysheva M., Toga A.W., Mcmahon K.L., De Zubicaray G.I., Wright M.J., Thompson P.M. Extending genetic linkage analysis to diffusion tensor images to map single gene effects on brain fiber architecture. Med. Image Comput. Comput. Assist. Interv. 2009;12:506–513. doi: 10.1007/978-3-642-04271-3_62. [DOI] [PubMed] [Google Scholar]
- Csernansky J.C., Joshi S., Wang L., Gado M., Miller J.P., Grenander U., Miller M.I. Hippocampal morphometry in schizophrenia by high dimensional brain mapping. Proc. Nat. Acad. Sci. 1998;95:11406–11411. doi: 10.1073/pnas.95.19.11406. [DOI] [PMC free article] [PubMed] [Google Scholar]
- Csernansky J.G., Wang L., Joshi S., Miller J.P., Gado M., Kido D., Mckeel D., Morris J.C., Miller M.I. Early DAT is distinguished from aging by high-dimensional mapping of the hippocampus. Neurology. 2000;55:1636–1643. doi: 10.1212/wnl.55.11.1636. [DOI] [PubMed] [Google Scholar]
- Csernansky J.G., Wang L., Swank J., Miller J.P., Gado M., Mckeel D., Miller M.I., Morris J.C. Preclinical detection of Alzheimer's disease: hippocampal shape and volume predict dementia onset in the elderly. NeuroImage. 2005;25:783–792. doi: 10.1016/j.neuroimage.2004.12.036. [DOI] [PubMed] [Google Scholar]
- Cummings J.L., Mega M., Gray K., Rosenberg-Thompson S., Carusi D.A., Gornbein J. The Neuropsychiatric Inventory: comprehensive assessment of psychopathology in dementia. Neurology. 1994;44:2308–2314. doi: 10.1212/wnl.44.12.2308. [DOI] [PubMed] [Google Scholar]
- Den Heijer T., Geerlings M.I., Hoebeek F.E., Hofman A., Koudstaal P.J., Breteler M.M. Use of hippocampal and amygdalar volumes on magnetic resonance imaging to predict dementia in cognitively intact elderly people. Arch. Gen. Psychiatry. 2006;63:57–62. doi: 10.1001/archpsyc.63.1.57. [DOI] [PubMed] [Google Scholar]
- Dickerson B.C., Goncharova I., Sullivan M.P., Forchetti C., Wilson R.S., Bennett D.A., Beckett L.A., Detoledo-Morrell L. MRI-derived entorhinal and hippocampal atrophy in incipient and very mild Alzheimer's disease. Neurobiol. Aging. 2001;22:747–754. doi: 10.1016/s0197-4580(01)00271-8. [DOI] [PubMed] [Google Scholar]
- Du A.T., Schuff N., Amend D., Laakso M.P., Hsu Y.Y., Jagust W.J., Yaffe K., Kramer J.H., Reed B., Norman D., Chui H.C., Weiner M.W. Magnetic resonance imaging of the entorhinal cortex and hippocampus in mild cognitive impairment and Alzheimer's disease. J. Neurol. Neurosurg. Psychiatry. 2001;71:441–447. doi: 10.1136/jnnp.71.4.441. [DOI] [PMC free article] [PubMed] [Google Scholar]
- Du A.T., Schuff N., Chao L.L., Kornak J., Jagust W.J., Kramer J.H., Reed B.R., Miller B.L., Norman D., Chui H.C., Weiner M.W. Age effects on atrophy rates of entorhinal cortex and hippocampus. Neurobiol. Aging. 2006;27:733–740. doi: 10.1016/j.neurobiolaging.2005.03.021. [DOI] [PMC free article] [PubMed] [Google Scholar]
- Feczko E., Augustinack J.C., Fischl B., Dickerson B.C. An MRI-based method for measuring volume, thickness and surface area of entorhinal, perirhinal, and posterior parahippocampal cortex. Neurobiol. Aging. 2009;30:420–431. doi: 10.1016/j.neurobiolaging.2007.07.023. [DOI] [PMC free article] [PubMed] [Google Scholar]
- Gomez-Isla T., Price J.L., Mckeel D.W., Jr., Morris J.C., Growdon J.H., Hyman B.T. Profound loss of layer II entorhinal cortex neurons occurs in very mild Alzheimer's disease. J. Neurosci. 1996;16:4491–4500. doi: 10.1523/JNEUROSCI.16-14-04491.1996. [DOI] [PMC free article] [PubMed] [Google Scholar]
- Herzog A.G., Kemper T.L. Amygdaloid changes in aging and dementia. Arch. Neurol. 1980;37:625–629. doi: 10.1001/archneur.1980.00500590049006. [DOI] [PubMed] [Google Scholar]
- Honeycutt N.A., Smith P.D., Aylward E., Li Q., Chan M., Barta P.E., Pearlson G.D. Mesial temporal lobe measurements on magnetic resonance imaging scans. Psychiatry Res. 1998;83:85–94. doi: 10.1016/s0925-4927(98)00035-3. [DOI] [PubMed] [Google Scholar]
- Hughes C.P., Berg L., Danziger W.L., Coben L.A., Martin R.L. A new clinical scale for the staging of dementia. Br. J. Psychiatry. 1982;140:566–572. doi: 10.1192/bjp.140.6.566. [DOI] [PubMed] [Google Scholar]
- Insausti R., Juottonen K., Soininen H., Insausti A.M., Partanen K., Vainio P., Laakso M.P., Pitkanen A. MR volumetric analysis of the human entorhinal, perirhinal, and temporopolar cortices. AJNR Am. J. Neuroradiol. 1998;19:659–671. [PMC free article] [PubMed] [Google Scholar]
- Jack C.R., Jr., Shiung M.M., Gunter J.L., O'Brien P.C., Weigand S.D., Knopman D.S., Boeve B.F., Ivnik R.J., Smith G.E., Cha R.H., Tangalos E.G., Petersen R.C. Comparison of different MRI brain atrophy rate measures with clinical disease progression in AD. Neurology. 2004;62:591–600. doi: 10.1212/01.wnl.0000110315.26026.ef. [DOI] [PMC free article] [PubMed] [Google Scholar]
- Jack C.R., Jr., Knopman D.S., Jagust W.J., Shaw L.M., Aisen P.S., Weiner M.W., Petersen R.C., Trojanowski J.Q. Hypothetical model of dynamic biomarkers of the Alzheimer's pathological cascade. Lancet Neurol. 2010;9:119–128. doi: 10.1016/S1474-4422(09)70299-6. [DOI] [PMC free article] [PubMed] [Google Scholar]
- Jagust W., Gitcho A., Sun F., Kuczynski B., Mungas D., Haan M. Brain imaging evidence of preclinical Alzheimer's disease in normal aging. Ann. Neurol. 2006;59:673–681. doi: 10.1002/ana.20799. [DOI] [PubMed] [Google Scholar]
- Joshi S., Miller M.I. Landmark matching via large deformation diffeomorphisms. IEEE Trans. Image Process. 2000;9:1357–1370. doi: 10.1109/83.855431. [DOI] [PubMed] [Google Scholar]
- Ma J., Miller M.I., Trouve A., Younes L. Bayesian template estimation in computational anatomy. NeuroImage. 2008;42:252–261. doi: 10.1016/j.neuroimage.2008.03.056. [DOI] [PMC free article] [PubMed] [Google Scholar]
- Ma J., Miller M.I., Younes L. A bayesian generative model for surface template estimation. Int. J. Biomed. Imaging. 2010;210:974957. doi: 10.1155/2010/974957. [DOI] [PMC free article] [PubMed] [Google Scholar]
- Miller M.I., Qiu A. The emerging discipline of computational functional anatomy. NeuroImage. 2009;45:S16–S39. doi: 10.1016/j.neuroimage.2008.10.044. [DOI] [PMC free article] [PubMed] [Google Scholar]
- Morris J.C. The Clinical Dementia Rating (CDR): current version and scoring rules. Neurology. 1993;43:2412–2414. doi: 10.1212/wnl.43.11.2412-a. [DOI] [PubMed] [Google Scholar]
- Munn M.A., Alexopoulos J., Nishino T., Babb C.M., Flake L.A., Singer T., Ratnanather J.T., Huang H., Todd R.D., Miller M.I., Botteron K.N. Amygdala volume analysis in female twins with major depression. Biol. Psychiatry. 2007;62:415–422. doi: 10.1016/j.biopsych.2006.11.031. [DOI] [PMC free article] [PubMed] [Google Scholar]
- Nichols T., Hayasaka S. Controlling the familywise error rate in functional neuroimaging: a comparative review. Stat. Methods Med. Res. 2003;12:419–446. doi: 10.1191/0962280203sm341ra. [DOI] [PubMed] [Google Scholar]
- Pengas G., Pereira J.M., Williams G.B., Nestor P.J. Comparative reliability of total intracranial volume estimation methods and the influence of atrophy in a longitudinal semantic dementia cohort. J. Neuroimaging. 2009;19:37–46. doi: 10.1111/j.1552-6569.2008.00246.x. [DOI] [PubMed] [Google Scholar]
- Poulin S.P., Dautoff R., Morris J.C., Barrett L.F., Dickerson B.C., Alzheimer's Disease Neuroimaging I Amygdala atrophy is prominent in early Alzheimer's disease and relates to symptom severity. Psychiatry Res. 2011;194:7–13. doi: 10.1016/j.pscychresns.2011.06.014. [DOI] [PMC free article] [PubMed] [Google Scholar]
- Price J.L., Morris J.C. Tangles and plaques in nondemented aging and “preclinical” Alzheimer's disease. Ann. Neurol. 1999;45:358–368. doi: 10.1002/1531-8249(199903)45:3<358::aid-ana12>3.0.co;2-x. [DOI] [PubMed] [Google Scholar]
- Qiu A., Miller M.I. Multi-structure network shape analysis via normal surface momentum maps. NeuroImage. 2008;42:1430–1438. doi: 10.1016/j.neuroimage.2008.04.257. [DOI] [PubMed] [Google Scholar]
- Qiu A., Crocetti D., Adler M., Mahone E., Mb D., Miller M., Mostofsky S. Basal ganglia volume and shape in children with attention deficit hyperactivity disorder. Am. J. Psychiatry. 2009;166:74–82. doi: 10.1176/appi.ajp.2008.08030426. [DOI] [PMC free article] [PubMed] [Google Scholar]
- Qiu A., Fennema-Notestine C., Dale A.M., Miller M.I. Regional shape abnormalities in mild cognitive impairment and Alzheimer's disease. NeuroImage. 2009;45:656–661. doi: 10.1016/j.neuroimage.2009.01.013. [DOI] [PMC free article] [PubMed] [Google Scholar]
- Qiu A., Adler M., Crocetti D., Miller M., Mostofsky S. Basal ganglia shapes predict social, communication, and motor dysfunctions in boys with autism spectrum disorder. J. Am. Acad. Child Adolesc. Psychiatry. 2010;49:539–551. doi: 10.1016/j.jaac.2010.02.012. [DOI] [PubMed] [Google Scholar]
- Ratnanather J.T., Barta P.E., Honeycutt N.A., Lee N., Morris H.M., Dziorny A.C., Hurdal M.K., Pearlson G.D., Miller M.I. Dynamic programming generation of boundaries of local coordinatized submanifolds in the neocortex: application to the planum temporale. NeuroImage. 2003;20:359–377. doi: 10.1016/s1053-8119(03)00238-6. [DOI] [PubMed] [Google Scholar]
- Rusinek H., De Santi S., Frid D., Tsui W.H., Tarshish C.Y., Convit A., De Leon M.J. Regional brain atrophy rate predicts future cognitive decline: 6-year longitudinal MR imaging study of normal aging. Radiology. 2003;229:691–696. doi: 10.1148/radiol.2293021299. [DOI] [PubMed] [Google Scholar]
- Scott S.A., Dekosky S.T., Scheff S.W. Volumetric atrophy of the amygdala in Alzheimer's disease: quantitative serial reconstruction. Neurology. 1991;41:351–356. doi: 10.1212/wnl.41.3.351. [DOI] [PubMed] [Google Scholar]
- Scott S.A., Dekosky S.T., Sparks D.L., Knox C.A., Scheff S.W. Amygdala cell loss and atrophy in Alzheimer's disease. Ann. Neurol. 1992;32:555–563. doi: 10.1002/ana.410320412. [DOI] [PubMed] [Google Scholar]
- Segonne F., Dale A.M., Busa E., Glessner M., Salat D., Hahn H.K., Fischl B. A hybrid approach to the skull stripping problem in MRI. NeuroImage. 2004;22:1060–1075. doi: 10.1016/j.neuroimage.2004.03.032. [DOI] [PubMed] [Google Scholar]
- Sperling R.A., Aisen P.S., Beckett L.A., Bennett D.A., Craft S., Fagan A.M., Iwatsubo T., Jack C.R., Jr., Kaye J., Montine T.J., Park D.C., Reiman E.M., Rowe C.C., Siemers E., Stern Y., Yaffe K., Carrillo M.C., Thies B., Morrison-Bogorad M., Wagster M.V., Phelps C.H. Toward defining the preclinical stages of alzheimer's disease: Recommendations from the national institute on aging-alzheimer's association workgroups on diagnostic guidelines for alzheimer's disease. Alzheimer's Dement. J. Alzheimer's Assoc. 2011;7:280–292. doi: 10.1016/j.jalz.2011.03.003. [DOI] [PMC free article] [PubMed] [Google Scholar]
- Thambisetty M., Wan J., Carass A., An Y., Prince J.L., Resnick S.M. Longitudinal changes in cortical thickness associated with normal aging. NeuroImage. 2010;52:1215–1223. doi: 10.1016/j.neuroimage.2010.04.258. [DOI] [PMC free article] [PubMed] [Google Scholar]
- Thompson P.M., Hayashi K.M., De Zubicaray G.I., Janke A.L., Rose S.E., Semple J., Hong M.S., Herman D.H., Gravano D., Doddrell D.M., Toga A.W. Mapping hippocampal and ventricular change in Alzheimer disease. NeuroImage. 2004;22:1754–1766. doi: 10.1016/j.neuroimage.2004.03.040. [DOI] [PubMed] [Google Scholar]
- Tsuchiya K., Kosaka K. Neuropathological study of the amygdala in presenile Alzheimer's disease. J. Neurol. Sci. 1990;100:165–173. doi: 10.1016/0022-510x(90)90029-m. [DOI] [PubMed] [Google Scholar]
- Vaillant M., Glaunes J. Surface Matching via Currents. LNCS. 2005;3565:381–392. doi: 10.1007/11505730_32. [DOI] [PubMed] [Google Scholar]
- Vaillant M., Qiu A., Glaunes J., Miller M.I. Diffeomorphic metric surface mapping in subregion of the superior temporal gyrus. NeuroImage. 2007;34:1149–1159. doi: 10.1016/j.neuroimage.2006.08.053. [DOI] [PMC free article] [PubMed] [Google Scholar]
- Wang L., Beg M.F., Ratnanather J.T., Ceritoglu C., Younes L., Morris J.C., Csernansky J.G., Miller M.I. Large deformation diffeomorphism and momentum based hippocampal shape discrimination in dementia of the Alzheimer type. IEEE Trans. Med. Imaging. 2007;26:462–470. doi: 10.1109/TMI.2005.853923. [DOI] [PMC free article] [PubMed] [Google Scholar]
- Yesavage J.A., Brink T.L., Rose T.L., Lum O., Huang V., Adey M., Leirer V.O. Development and validation of a geriatric depression screening scale: a preliminary report. J. Psychiatr. Res. 1982;17:37–49. doi: 10.1016/0022-3956(82)90033-4. [DOI] [PubMed] [Google Scholar]
- Younes L., Ratnanather J.T., Brown T., Aylward E., Nopoulos P., Johnson H., Magnotta V.A., Paulsen J.S., Margolis R.L., Albin R.L., Miller M.I., Ross C.A., The P.-H. D. I., Coordinators Of The Huntington Study G Regionally selective atrophy of subcortical structures in prodromal HD as revealed by statistical shape analysis. Hum. Brain Mapp. 2013 doi: 10.1002/hbm.22214. (in press) [DOI] [PMC free article] [PubMed] [Google Scholar]
Associated Data
This section collects any data citations, data availability statements, or supplementary materials included in this article.
Supplementary Materials
Supplementary material.