

Abstract
Reading requires coordinated neural processing across a large number of brain regions. Studying relationships between reading-related regions informs the specificity of information processing performed in each region. Here, regions of interest were defined from a meta-analysis of reading studies, including a developmental study. Relationships between regions were defined as temporal correlations in spontaneous fMRI signal; i.e., resting state functional connectivity MRI (RSFC). Graph theory based network analysis defined the community structure of the “reading-related” regions. Regions sorted into previously defined communities, such as the fronto-parietal and cingulo-opercular control networks, and the default mode network. This structure was similar in children, and no apparent “reading” community was defined in any age group. These results argue against regions, or sets of regions, being specific or preferential for reading, instead indicating that regions used in reading are also used in a number of other tasks.
Keywords: Resting-state, Graph Theory, Child, Functional connectivity
Introduction
Reading, as with many advanced human behaviors, is a complicated skill requiring the integrated functioning of a network of brain regions (Schlaggar and Church, 2009; Schlaggar and McCandliss, 2007). Several meta-analyses of functional MRI (fMRI) neuroimaging studies have attempted to define regional components of a reading network (Fiez & Petersen, 1998; Jobard, Crivello, & Tzourio-Mazoyer, 2003; Turkeltaub, Eden, Jones, Zeffiro, 2002; Vigneau et al., 2006). Together these meta-analyses have described a group of generally left hemisphere brain regions consistently used in single word reading tasks. One such region, the visual word form area (VWFA, Cohen & Dehaene, 2004) is in the fusiform cortex near the occipital-temporal border. The VWFA has been reported to show more activity for words than consonant strings (McCandliss, Cohen, & Dehaene, 2003; Vinckier et al., 2007) and digits (Polk et al., 2002), though its specificity for processing words (and nonwords) is debated (see Price & Devlin, 2003; Price & Devlin, 2011; Dehaene & Cohen, 2011; Vogel et al., 2012). The meta-analyses have also identified regions in the supramarginal gyrus (SMG), angular gyrus (AG), and middle temporal gyrus (MTG) as important for reading. Single studies have implicated regions in the SMG in phonological processing (Church, Balota, Petersen, & Schlaggar, 2011; Church, Coalson, Lugar, Petersen, & Schlaggar, 2008; Graves, Desai, Humphries, Seidenberg, & Binder, 2010) and the AG and MTG as possibly involved in semantic processing (Chou et al., 2006; Graves et al., 2010). Finally, regions in the inferior frontal gyrus (IFG), most commonly localized to the pars opercularis, have been identified as important in phonological processing (Fiez, Balota, Raichle, & Petersen, 1999; Gitelman, Nobre, Sonty, Parrish, & Mesulam, 2005; Mechelli, Gorno-Tempini, & Price, 2003; Pugh et al., 1996).
As has been argued elsewhere (e.g, Schlaggar and McCandliss, 2007), reading is a phylogenetically new skill, and it is unclear whether reading-related regions become dedicated to reading, or whether they serve more general processing demands. For example, a region that is used for orthographic (visual) processing of words could be dedicated to the visual analysis of words and letters, or it could be used more generally in the processing of words, objects, abstract shapes, etc. Although functional neuroimaging studies have converged on a general set of brain regions used during reading, it is not yet known whether reading related regions relate specifically to one another (consistent with dedication to reading), or whether reading regions are more closely related to non-reading regions (and are therefore likely to perform more general functions and not be specifically dedicated to reading).
A large and expanding literature suggests that functionally related brain regions tend to demonstrate high and specific correlations in spontaneous activity that are reflected in resting state functional connectivity MRI (RSFC) (e.g., specific and high correlations within the visual system, auditory system, dorsal attention system, etc. (Biswal, Yetkin, Haughton, & Hyde, 1995; Lowe, Mock, & Sorensen, 1998; Greicius, Krasnow, Reiss, and Menon 2003; Fox, Snyder, Vincent, Corbetta, Van Essen & Raichle, 2005; Dosenbach et al., 2007)). RSFC seems to reflect a long history of coactivation across a large range of tasks and time (Bullmore and Sporns, 2009; Dosenbach et al., 2006; Fair, Dosenbach, et al., 2007; Fox and Raichle, 2007; Power et al., 2011; Vogel et al., 2011). RSFC has been used to characterize the network structure of regions across the brain. A primary result has been the classification of regions across the brain into groupings of regions with high correlations (these groupings are called communities, modules, sub-networks, or clusters in network analyses) (Power et al., 2011). The defined communities include many groupings of regions recognizable from prior functional imaging studies, such as selective groupings of default mode, front-parietal control, dorsal attention, ventral attention, motor, and visual regions (Power et al., 2011; Yeo et al., 2011). Given the idea that RSFC reflects a history of coactivation, the aforementioned reading regions, if they are used specifically or even predominantly in reading, should be closely related to one another using RSFC measures. Such close relationships would occur because the reading regions described above should be activated together almost always and rarely activated with other, disparate groups of regions. If, on the other hand, the reading regions described above are involved in reading, but reading is not their only, or even predominant, function, these regions will not necessarily be more related to one another than to more general use regions. The lack of a “reading network” will arise because these regions will be occasionally activated together, but more often each individual region will be activated with other, disparate, groups of regions. In this case each “reading region” will have closer RSFC relationships with whichever set of regions with which it is more commonly coactivated.
Of note, no dedicated “reading community” was seen in the previous whole brain analyses (Power et al., 2011; Yeo et al., 2011). Instead, reading-related regions were dispersed among many different communities (dorsal attention, fronto-parietal, cingulo-opercular, etc). These analyses included hundreds of brain regions, or the entire cortex, indicating that the lack of a reading community was not because reading related regions were inadequately sampled. The lack of a reading community suggests that the strongest relationships of reading-related regions are not to one another but to other regions. However, there remains a possibility that a reading community was not found for methodological reasons. For example, algorithms have known difficulties finding small communities amidst larger communities (Fortunato, 2010), and perhaps a small reading community was difficult to define in a whole-brain context. Another way of stating this is that many strong relationships to a large community could overshadow equally strong relations among a smaller group of reading regions.
Here, in contrast to Yeo et al (2011) and Power et al (2011), we include for analysis only regions derived from a large set of single word reading-related tasks (see below), with the intent of providing the highest probability of finding a dedicated reading community. Importantly, the defined region set includes regions thought to be relatively specific for reading that have been derived from other meta-analyses. Accordingly, in this paper we examine the functional relationships of reading regions for evidence distinguishing between the hypotheses: 1) the reading regions described above are used predominantly in reading and thus will form a distinct and separate community demonstrable through graph analytic techniques, or 2) the reading regions described above are used in a large number of tasks outside of reading and, as a result, do not form a distinct community but are integrated into communities, such as those found in prior large scale network analyses (Power et al., 2011; Yeo et al., 2011), reflective of each region’s predominant function.
A large, distributed group of regions is used in single word reading
To determine the network structure of reading-related regions we must first define what will constitute a reading-related region. The aforementioned meta-analyses (Fiez and Petersen, 1998; Jobard et al., 2003; Turkeltaub et al., 2002; Vigneau et al., 2006) focused on regions identified by comparing reading to another task in an attempt to avoid identifying more “task general” processing. However, studies designed to identify all regions showing activity different from a baseline estimate or rest condition during a reading task find many more regions (Binder, Medler, Desai, Conant, & Liebenthal, 2005; Brown, Lugar, Coaslon, Miezin, Petersen, & Schlaggar, 2005; Church et al., 2011; Graves et al., 2010). This abundance of regions with differential activity reflects the use of a number of different processes in reading. Visual, phonologic, semantic, and spatial processing (to appropriately direct visual attention to words or parts of words) are necessary for reading in general, whereas articulatory and motor output processing are necessary for reading aloud. Essential but non-specific task control processes to instantiate and maintain the reading task set and to evaluate performance are also part of reading. As we are interested in the network structure of all regions used in the conversion of written, visual input into spoken output, we have performed a meta-analysis of five single word reading aloud studies (some previously published in Brown et al., 2005; Church et al., 2011) and have included all regions with BOLD activity significantly different from baseline in a majority of the studies in our analysis. This approach allows us to test the hypotheses proposed above to determine whether a large set of reading-related regions, including reading-predominant or –specific regions found in previous meta-analyses:
form a discrete community (or sub-communities) dedicated to reading (or a sub-component thereof such as phonological or semantic processing), consistent with the idea that those regions are used predominantly in reading, or
are integrated into other general use communities, as described in Yeo et al (2011) and Power et al (2011), consistent with the idea that they have more general functions that dominate their overall community relationships.
Additionally, while there is obvious interest in the network structure of reading-related regions in adults, this organization may well undergo developmental changes. Acquiring fluent reading requires considerable instruction and experience (see Schlaggar & McCandliss, 2007 for a review). Also, children show different functional activity for reading than do adults in both ERP (Brem, Bach, Kucian, Guttorm, Martin, Lyytinen, Brandeis, & Richardson, 2010; Maurer, Brem, Bucher, & Brandeis, 2005; Tarkiainen, Helenius, Hansen, Cornelissen, & Salmelin, 1999) and fMRI studies (Booth et al., 2004; Brem et al., 2010; Brown et al., 2005; Church et al., 2008; Puce, Allison, Asgari, Gore, & McCarthy, 1996; Schlaggar, Brown, Lugar, & Visscher, 2002). Therefore, studying the network structure across development may give additional insight into the organization of reading-related regions and possible age- or skill-related increases in skill specificity. For example, if regions were used preferentially for reading, we might expect to see the emergence of a reading community across development. However, studying the developing network structure requires a set of regions used for single word reading in both children and adults. Thus, as will be described further below, we added regions showing differential BOLD activity between children and adults in a reading fMRI study (Church et al., 2008) to our meta-analytic reading set.
RSFC allows for large-scale network definition
The relationship between reading-related regions has been the subject of much inquiry through the years. Relationships between these regions have been demonstrated in the metabolic activity while reading (Horwitz, Rumsey, & Donohue, 1998) and via effective connectivity (Eichler, 2005; Friston, Harrison, & Penny, 2003; Granger, 1969) during orthographic and phonological processing tasks (Bitan, Booth, Choy, Burman, Gitelman, & Mesulam, 2005; Bitan et al., 2006). However, such studies only address the functional relationship of regions in a specific task state. The “overall” functional connectivity of a limited number of reading related regions has been addressed using RSFC. Our group has recently defined the RSFC connectivity of the VWFA specifically (Vogel, Miezin, Petersen & Schlaggar, 2011). Koyama and colleagues determined the relationship between the small set of reading regions described above (VWFA, SMG/AG, IFG) as well as a few other regions of interest (ROIs) (Koyama, Kelly, Shehzad, Penesetti, Castellanos & Milham, 2010). Hampson and colleagues used RSFC to study the relationship of IFG connectivity to reading ability (Hampson et al., 2006). Recently, typical readers and those with reading difficulties were found to differ on a whole brain analysis of global efficiency using phase-lag estimation of the magnetoencephalography signal (Vourkas et al., 2011). Yet, to date no study has utilized the capability of RSFC to perform a large-scale network analysis of reading utilizing a large set of regions, as described below.
Here we utilize graph theoretic techniques and RSFC defined relationships to study the large-scale network organization of all regions showing differential activity in a reading task, defined by meta-analysis and a developmental study described above. Graph theory is a field of mathematics devoted to studying the structure of networks. Graphs are collections of individual items (nodes) and the relationships between the items (edges) (Sporns, Chialvo, Kaiser, & Hilgetag, 2004). Here, the nodes are the experimentally derived meta-analytic and developmental reading-regions and the edges are the correlations in RSFC timecourses between each pair of these regions. We search for groupings of regions (called communities) within these graphs using two graph theoretic community detection methods: modularity optimization (Newman & Girvan, 2004) and Infomap (Rosvall & Bergstrom, 2008). Again, if the specific reading-related regions described above are dedicated specifically or predominantly to reading, these methods should find that such regions group together in a community, to the exclusion of other regions not specifically used in reading, and this grouping may arise across development. However, if the reading regions described above have a more general processing function, they may have stronger RSFC correlations to other “general use” regions making these methods unlikely to detect a separate reading community, per se.
Methods
Definition of Regions
Reading-related regions were defined in two ways: a meta-analysis of studies in which adults read single words aloud and a single developmental study of reading single words aloud. By using regions derived from both types of analysis we were able to utilize well-characterized adult regions as well as regions showing developmental changes, which could be important for the developmental trajectory of reading networks.
Meta-analysis of adult reading-related regions
The meta-analysis included 5 studies, briefly described in Table 1. In each of these studies typical adult readers spoke aloud a single word or pseudoword presented in the center of a screen. Several of these studies manipulated lexical variables: 3 of the 5 studies manipulated frequency (the rate at which words appear in written English), 2 manipulated lexicality (whether the stimulus is a word or pseudoword), and 2 manipulated consistency (whether a word’s sounds correspond consistently to its letter groups). All studies had an event related design and were performed in a 1.5 Tesla MAGNETOM Siemens Vision system (Erlanger, Germany).
Table 1.
Description of studies included in the adult single word reading meta-analysis
| Study Number | Stimuli | Effects obtained | Subject number |
|---|---|---|---|
| 1 | Verbs | ME | 16 |
| 2 | Words and Pseudowords | ME Frequency Consistency Lexicality |
24 |
| 3* | Words and Pseudowords | ME Lexicality Frequency |
24 |
| 4 | Words | ME Consistency Frequency |
24 |
| 5* | High frequency words | ME | 28 |
Asterisks denote studies that have been previously published, 3 in Church et al., 2008, 5 in Brown et al., 2005
A set of conjunction analyses was performed on the 5 reading studies. First, images were created for the main effect of time (ME), that is regions showing a change in BOLD activity across timepoints (6–7 MR frames) across conditions, for each study. These main effect images were thresholded to only show voxels with a Z-score greater than 7 for the main effect of time, as this image is statistically very robust with a strong effect size. Such a Z-score cutoff allows us to identify regions most strongly associated with reading overall. These 5 main effect images were summed and masked to include only voxels with activity in at least 4 of the 5 studies. A peak finding algorithm was run on this image to find the coordinates of highly consistent activations between the studies, while ensuring that peak coordinates were separated by at least 10 mm.
Regions showing an effect of any lexical manipulation were defined using a similar conjunction analysis approach. For example, voxels showing a difference between high and low frequency words across timepoints were defined for each study manipulating frequency. Then these maps were masked to show only voxels with a frequency by time interaction Z-score greater than 2. The relatively reduced Z-score was used, as the effect size of these lexical interactions is small. A Z-score of 2 allowed for the identification of regions showing a realizable statistical difference between these stimulus types while not ignoring the weak effects. These images were summed and masked only for voxels showing an effect in at least 2 of the 3 studies manipulating frequency and a peak-finding algorithm was run on this image. The effects of lexicality and consistency were calculated similarly, with a required variable by time interaction Z-score greater than 2 and interactions present in both of the studies manipulating each variable. However, all regions defined using lexical manipulations were compared to those showing a ME, and any regions closer than 10 mm were discarded in favor of the ME derived region.
All regions were visualized on the average anatomy of the 2 groups of subjects used in the resting-state functional connectivity analysis described below. A small number of regions that fell clearly in the white matter, ventricles, on the edge of the brain, or along the tentorium (as defined by either visual inspection or individual region resting-state seed maps) were discarded.
Developmental reading-related regions
Regions were also obtained from a single study of reading development. In this study (Church et al., 2008), typical child and adult subjects were asked to read aloud single words (along with several other lexical manipulations that will not be addressed here). The analysis comprises a group of 24 adults (19–35 years old) and 24 children (7–10 years old), matched on accuracy and response time. Regions were defined as those with an age by time interaction Z-score ≥3.5, with at least 24 contiguous voxels. All developmental regions were visualized on the average anatomy described above and the small number of those lying in white matter, ventricles, or tentorium discarded. All remaining regions were compared to the meta-analytic regions and any regions within 10 mm were discarded in favor of the meta-analytic region.
Resting State Functional Connectivity Pre-processing
Subjects
Resting state subjects consisted of 3 groups of 38 subjects. These groups included 38 children (20 male) ages 6–10 years (average 9.4 years), 38 adolescents (25 male) ages 11–14 years (average 13.2 years), and 38 adults (21 male) ages 21–29 years (average 24.8 years). All subjects were recruited from Washington University and the surrounding community. All filled out questionnaires indicating no history of neurologic or psychiatric diagnosis or drug abuse. All subjects gave informed consent in accordance with the guidelines and approval of the Washington University Human Studies Research Committee.
Data-acquisition and pre-processing
Each subject performed 1–4 functional resting runs, composed of 132 or 133 continuous frames with a 2.5 second TR. During the scans subjects were instructed to look at a crosshair and relax but to remain still. All subjects were fitted with a thermoplastic mask to facilitate their ability to remain still.
A Siemens 3T Trio scanner (Erlanger, Germany) with a 12-channel Siemens Matrix head coil was used to collect all functional and anatomical scans. A single high-resolution structural scan was acquired using a sagittal magnetization-prepared rapid gradient echo (MP-RAGE) sequence (slice time echo= 3.08 ms, TR= 2.4 s, inversion time= 1 s, flip angle= 8 degrees, 176 slices, 1×1×1 mm voxels). All functional runs were acquired parallel to the anterior-posterior commissure plane using an asymmetric spin-echo echo-planar pulse sequence (TR= 2.5 s, T2* evolution time 27 msec, flip angle 90 degrees). Complete brain coverage was achieved by collecting 32 contiguous interleaved 4mm axial slices (4×4 mm in-plane resolution).
Preliminary image processing included slice by slice normalization to correct for differences in signal intensity due to collecting interleaved slices, movement correction within and across runs, and whole brain normalization of signal intensity to the mode value across all voxels and TRs. For detailed description see (Miezin, Maccotta, Ollinger, Petersen, & Buckner, 2000).
After preprocessing, data were transformed into a common stereotactic space based on Talairach & Tournoux (1988) using an in-house atlas composed of the average anatomy of 12 healthy young adults ages 21–29 years old and 12 healthy children ages 7–8 years old (see Brown et al., 2005; Lancaster, Glass, Lankipalli, Downs, Mayberg, & Fox, 1995; Snyder, 1996 for methods). As part of the atlas transformation, the data were resampled isotropically at 3 mm×3 mm×3 mm. Registration was accomplished via a 12-parameter affine warping of each individual’s MP-RAGE to the atlas target using difference image variance minimization as the objective function. The atlas-transformed images were checked against a reference average to ensure appropriate registration.
Several additional steps (Fair et al., 2007; Fox et al., 2005; Fox, Zhang, Snyder, & Raichle, 2009) were taken in processing the RSFC data in an attempt to reduce the likelihood that the relationships between regions were due to extraneous sources such as heart rate or respiration. To mitigate such effects, the data were band-pass filtered for frequencies between 0.009 Hz and 0.08 Hz and spatially smoothed (6 mm full width, half max). Additionally, we performed motion correction by regression of the six detrended parameters obtained from the rigid body head motion correction, regression of the signal derived from averaging across the whole brain, regression of signal from ventricular regions of interest (ROIs), and regression of signal from white matter ROIs, and the derivatives of each of these nuisance regressors (for 18 total regressors).
Recently, Power et al. (2012) have demonstrated that small amplitude subject movement, not fully addressed by standard frame realignment methods, can have a profound effect on RSFC data. Therefore, our subjects were subjected to a rigorous process of matching for movement and removal of high-movement frames as described below (Power et al., 2012). The data quality was evaluated using 2 independent checks. First, realignment parameters were used to index subject movement and identify frames (TRs) that might be of poor quality. For each subject, the realignment parameters were used to index subject movement in each RSFC BOLD run that was used. A frame-by-frame displacement of the brain (the sum of the absolute values of 3 translational parameters, and 3 rotational parameters at a distance of 50 mm) was then calculated from these values, and frames whose displacement from the previous frame exceeded 0.5 mm were flagged. Second, at each frame, an index was formed from the sum of the absolute value of the derivative of the RSFC signal at each voxel. Frames where this index exceeded 0.5% BOLD signal were flagged, identifying frames where BOLD signal across the entire brain (or substantial portions of it) was changing rapidly. There is benefit to using both approaches as the first uses realignment parameters directly and the second uses the functional connectivity image itself. For the purpose of our functional connectivity analysis, all flagged frames, as well as 2 frames forward and 1 back from any flagged frame, were ignored in producing the final functional image from which timeseries were extracted. Age, number of frames, and RMS are reported for the final, usable, data in Table 2.
Table 2.
Subject characteristics
| Subject Group | Age (years) | Number of frames used in analysis | Movement (mm rms) | |||
|---|---|---|---|---|---|---|
| Avg | Std Dev | Avg | Std Dev | Avg | Std Dev | |
| Children | 9.4 | 1.1 | 233 | 66.7 | .332 | .108 |
| Adolescents | 13.2 | 1.2 | 273 | 65.4 | .269 | .107 |
| Adults | 24.8 | 2.2 | 244 | 38.7 | .320 | .139 |
Regions are colored by analysis that defined them.
Extraction of resting state timecourses and generation of correlation matrices
A resting state timecourse was extracted for a 10 mm sphere centered on each of the 83 coordinates defined in the meta-analysis and developmental reading-region analysis, described above (Table 1 and Table 3). These timecourses were extracted separately in each of the 114 subjects described above. For each of the 114 subjects the correlation (r) between the timecourse of each region and every other region was calculated, yielding an 83×83 correlation matrix. Due to global signal regression, correlations were zero-centered with standard deviations of ~0.15. These individual matrices were then averaged using the Schmidt-Hunter method (Hunter and Schmidt, 1990) in the 3 groups of 38 subjects described above. Full correlations, rather than partial correlations, were used because our subjects did not have enough timepoints to support regression of many (~80) regressors. A general overview of the resting state methods used here is shown in Figure 1.
Table 3.
Reading-related regions
| MNI Coord. | Region Description | Community Definition | |||||
|---|---|---|---|---|---|---|---|
| x | y | z | Anatomic Location | Functional definition | Children | Adoles. | Adults |
| −24 | −61 | −33 | L Cerebellum | Lexicality | Cerebell.1 | Cerebell.1 | Cerebell.1 |
| 34 | −72 | −26 | R Cerebellum | Lexicality | Cerebell.2 | Cerebell.2 | Cerebell.2 |
| −18 | −76 | 29 | L post parietal | Adult ME | Vis | Vis | Med Vis |
| 15 | −78 | 29 | R post parietal | Adult ME | Vis | Vis | Med Vis |
| −6 | −94 | 12 | R med occipital | Children vs Adults | Vis | Vis | Med Vis |
| 7 | −74 | 14 | L med occipital | Adult ME | Vis | Vis | Med Vis |
| −3 | −81 | 20 | L med occpital | Adult ME | Vis | Vis | Med Vis |
| 18 | −66 | 2 | R mid occipital | Adult ME | Vis | Vis | Med Vis |
| −8 | −83 | 7 | L lingual | Consistency | Vis | Vis | Med Vis |
| 26 | −71 | 33 | R post parietal | Adult ME | Vis | Vis | Lat Vis |
| 40 | −72 | 14 | R occipital | Adult ME | Vis | Vis | Lat Vis |
| 45 | −63 | 4 | R occipito-temporal | Adult ME | Vis | Vis | Lat Vis |
| −36 | −65 | −14 | L fusiform | Lexicality | Vis | Vis | Lat Vis |
| 35 | −65 | −9 | R fusiform | Adult ME | Vis | Vis | Lat Vis |
| −28 | −90 | 6 | L occipital | Adult ME | Vis | Vis | Lat Vis |
| −33 | −59 | −5 | L occipito-temporal | Lexicality | Vis | Vis | Lat Vis |
| 31 | −55 | −7 | R occipito-temporal | Lexicality | Vis | Vis | Lat Vis |
| 35 | −82 | −1 | R occipital | Adult ME | Vis | Vis | Lat Vis |
| −37 | −84 | 1 | L occipital | Adult ME | Vis | Vis | Lat Vis |
| −37 | −76 | −7 | L fusiform | Adult ME | Vis | Vis | Lat Vis |
| −45 | −62 | −8 | L VWFA | Lexicality | Vis | FP | Lat Vis |
| −24 | −66 | 42 | L IPS | Consistency | Par-FP | FP | FP |
| 32 | −59 | 41 | R IPS | Adult ME | Par-FP | FP | FP |
| −43 | −39 | 42 | L IPS | Consistency | Par-FP | FP | FP |
| 44 | 8 | 34 | R med frontal | Lexicality | Front-FP | FP | FP |
| −42 | 7 | 36 | L med frontal | Lexicality | Front-FP | FP | FP |
| 41 | 37 | 29 | R lat frontal | Lexicality | Unclass. | FP | FP |
| −44 | 27 | 33 | L dlPFC | Frequency | Front-FP | FP | FP |
| −53 | 27 | 16 | L IFG | Frequency | Front-FP | FP | Unclass. |
| −64 | −32 | −15 | L ITG | Lexicality | Unclass. | Unclass. | Default |
| 46 | 39 | −15 | R IFG | Children vs Adults | Unclass. | Unclass. | Default |
| 0 | 51 | 32 | Mesial frontal | Children vs Adults | Front-Def | Front-Def | Default |
| 6 | 64 | 2 | R med frontal | Consistency | Front-Def | Front-Def | Default |
| 9 | 52 | 16 | R med frontal | Children vs Adults | Front-Def | Front-Def | Default |
| −9 | 44 | 17 | L ACC | Children vs Adults | Front-Def | Front-Def | Default |
| −8 | 52 | 6 | L ACC | Children vs Adults | Front-Def | Front-Def | Default |
| 7 | 38 | 19 | R ACC | Children vs Adults | Front-Def | Front-Def | Default |
| 0 | 36 | 40 | Mesial sup frontal | Consistency | Front-Def | Front-Def | Default |
| −49 | −57 | 28 | L AG | Children vs Adults | Par-Def | Par-Def | Default |
| −11 | −53 | 32 | L PCC | Children vs Adults | Par-Def | Par-Def | Default |
| 8 | −44 | 24 | R PCC | Children vs Adults | Par-Def | Par-Def | Default |
| −6 | −52 | 18 | L PCC | Children vs Adults | Par-Def | Par-Def | Default |
| −19 | −65 | 19 | L Precuneus | Children vs Adults | Par-Def | Par-Def | Default |
| 12 | −59 | 24 | R Precuneus | Children vs Adults | Par-Def | Par-Def | Default |
| −7 | −66 | 22 | L Precuneus | Children vs Adults | Par-Def | Par-Def | Default |
| −8 | −32 | 27 | L mid cing | Children vs Adults | Par-Def | Default | Default |
| 53 | −16 | −12 | R MTG | Lexicality | Unclass. | Unclass. | Default |
| 11 | −39 | 50 | R med sup parietal | Adult ME | Unclass. | Unclass. | Unclass. |
| −3 | 1 | 49 | SMA | Adult ME | Unclass. | Unclass. | Unclass. |
| −21 | −11 | 57 | L sup frontal | Consistency | Sup Front & Par | Sup Front & Par | Sup Front & Par |
| 36 | −38 | 64 | R sup parietal | Children vs Adults | Sup Front & Par | Sup Front & Par | Sup Front & Par |
| −20 | −31 | 59 | L sup parietal | Adult ME | Sup Front & Par | Sup Front & Par | Sup Front & Par |
| −27 | −30 | 69 | L sup parietal | Children vs Adults | Sup Front & Par | Sup Front & Par | Sup Front & Par |
| 57 | −5 | 14 | R IFG | Adult ME | Motor | Motor | Motor/Aud. Temp |
| −48 | −12 | 34 | L precent gyrus | Adult ME | Motor | Motor | Motor/Aud Temp |
| 53 | −6 | 30 | R precent gyrus | Adult ME | Motor | Motor | Motor/Aud Temp |
| −53 | −9 | 24 | L precent gyrus | Adult ME | Motor | Motor | Motor/Aud Temp |
| 59 | 8 | 34 | R premotor | Children vs Adults | Motor | Motor | Motor/Aud Temp |
| 58 | −15 | 8 | R ant temporal | Adult ME | Aud.Temp | Temporal | Motor/Aud Temp |
| −43 | −37 | 17 | L ant SMG | Adult ME | Aud.Temp | Temporal | Motor/Aud Temp |
| −56 | −39 | 13 | L vent SMG | Adult ME | Aud Temp. | Temporal | Motor/Aud Temp |
| 50 | −33 | 8 | R temporal | Adult ME | Temporal | Temporal | Motor/Aud Temp |
| 42 | −44 | 9 | R temporal | Children vs Adults | Temporal | Temporal | Unclass. |
| 43 | −45 | 20 | R sup temporal | Children vs Adults | Temporal | Temporal | Temporal |
| 55 | −46 | 22 | R SMG | Children vs Adults | Temporal | Temporal | Temporal |
| −51 | −63 | 15 | L occipito-temporal | Lexicality | Temporal | Temporal | Temporal |
| −40 | −48 | 28 | L medial SMG | Children vs Adults | Temporal | Temporal | Unclass. |
| −56 | −43 | 31 | L SMG | Children vs Adults | Temporal | Temporal | Unclass. |
| −12 | −12 | 6 | L Thalamus | Adult ME | Subcort. | Subcort. | Subcort. |
| 11 | −12 | 6 | R Thalamus | Adult ME | Subcort. | Subcort. | Subcort. |
| 20 | 3 | 7 | R Putamen | Lexicality | Subcort. | Subcort. | Subcort. |
| −20 | 4 | 8 | L Putamen | Lexicality | Subcort. | Subcort. | Subcort. |
| −30 | −4 | 0 | L Putamen | Adult ME | Subcort. | Subcort. | Subcort. |
| 32 | −12 | 1 | R Putamen | Adult ME | Subcort. | Subcort. | Subcort. |
| 0 | −13 | 8 | Mesial Thalamus | Consistency | Subcort. | CO | Unclass. |
| 0 | 15 | 45 | Dorsal ACC-mesial frontal cortex | Frequency | Unclass. | CO | CO |
| −8 | 27 | 27 | R frontal | Frequency | Unclass. | CO | CO |
| 56 | 24 | 8 | R frontal operculum | Lexicality | CO | CO | CO |
| −36 | 18 | 2 | L ant insula/frontal operculum | Consistency | CO | CO | CO |
| −46 | 9 | 15 | L frontal operculum | Lexicality | CO | CO | CO |
| 35 | 33 | 8 | R IFG | Lexicality | CO | CO | CO |
| 44 | 22 | 3 | R IFG | Children vs Adults | CO | CO | CO |
| 57 | 12 | 14 | R premotor | Children vs Adults | CO | CO | CO |
Location of reading-related regions, the statistical comparison used to define the region and the community to which the region is assigned in the 3 age groups (as described below and shown in Figures 3 and 4) are listed. ME refers to main effect of reading regions, DA to regions identified in the developmental analysis. IPS= inferior parietal sulcus, dlPFC= dorsal lateral prefrontal cortex, ACC= anterior cingulate cortex, PCC= posterior cingulate cortex, cing= cingulate, SMA= supplementary motor area, FP= fronto-parietal community, Front-FP= frontal regions of the fronto-parietal community, Par-FP= parietal regions on the fronto-parietal community, Front-Def= frontal regions of the default community, Par-Def= parietal regions of the default community, Sup Front & Par= superior frontal and parietal community, Aud= auditory community, CO= cingulo-opercular community
Figure 1. RSFC methods.
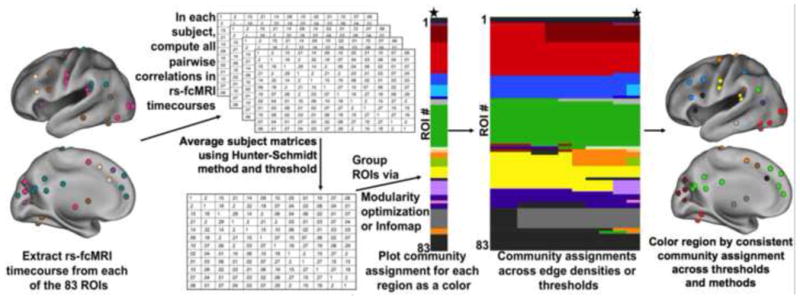
Results will be shown as in the last two panels-1) a color chart with the ROIs presented as rows on the y-axis, the community assignment (displayed as a color in the plot) across and the thresholds on the x-axis for each method, and 2) a plot of the location of regions colored by community assignment on the brain.
Use of graph theoretic techniques in defining network structure
Graph theoretic techniques have been developed to describe the relationship between large numbers of nodes in networks, making them ideal to study the organization of networks of brain regions. In this section, a node will be defined as one of the 83 regions in the reading network described above (Table 3). An edge will be defined as the RSFC correlations between two regions. A connection, or edge, occurs between two nodes, or regions, if the group average correlation coefficient (r) between those regions is greater than the given threshold (i.e. if the correlation threshold for analysis is r = 0.10, all region pairs with an r ≥0.10 are considered to have an edge between them). All edges present above the given correlation threshold are then weighted by their correlation coefficient. For the purposes of this analysis, we employ correlation thresholds from 0 to 0.25. In our dataset, thresholds over r > 0.1 are composed exclusively of statistically significant correlations that pass Bonferonni correction for p < 0.05 (Figure S2). We thus perform a range of analyses, from very inclusive (r > 0, many nonsignificant correlations) to very exclusive (r >.25, only highly significant correlations).
There are many ways to group nodes (regions) into communities (groups of related regions). One such method, modularity optimization (Newman, 2006), involves maximizing Q, a quantification of the number of observed edges within communities relative to the number of expected edges predicted in a random graph with an equal number of nodes and distribution of edges (the null model is the ‘configuration model’, a graph with identical degree distribution). Any grouping which has more observed edges than expected in a random graph will have a positive Q, and the modularity optimization algorithm varies groupings seeking to maximize the value of Q. A second method relies on minimizing the amount of information needed to describe a random walk through the graph, as is done in Infomap (Rosvall & Bergstrom, 2008), also described in further detail below. Infomap is currently one of the best performing algorithms available (Fortunato, 2010). We have used both methods in an effort to ensure that the communities detected by our analyses were reliable across graph analysis methodology.
Modularity optimization analysis
Modularity optimization was performed on a weighted correlation matrix of the reading network regions in all three age groups at all thresholds which passed two criteria: (1) the resulting communities showed a Q > 0.4 (Fortunato, 2010), (2) the network was at least 80% connected. In a network that is 80% connected, there is a path by which 80% of the nodes can reach all other nodes. These criteria restrict analyses to graphs that display community structure and are not greatly fragmented. Our conclusions are supported if these requirements are relaxed (Figure S1). Because no single threshold can be definitive, final community assignment for each age group was made after visually inspecting the communities across the range of thresholds (the basis for final assignments, and the final assignments are shown in Figures 1, 3, and 4). We used modularity optimization by leading eigenvector, a deterministic optimization (Newman, 2006). All modularity optimization analyses were performed using in-house software.
Figure 3. Network organization of reading-related regions in adults.

A. Community assignment of reading-related regions in 38 adults. The leftmost color bar indicates the community assignment made by looking across all thresholds in all methods. To the right of the color bar the Infomap assignment from correlation thresholds of 0.0 to 0.25 in 0.01 steps, modularity optimization assignment from correlation thresholds of 0.0 to 0.25 in 0.01 steps. Each region corresponds to a row in the color plot and each threshold corresponds to a column. Community assignments are depicted as colors in the color bar.
B. Location of reading-related regions colored by community assignment across thresholds and methods. Medial visual regions are shown in maroon, lateral visual regions in red, fronto-parietal regions in blue, default regions in green, superior frontal and parietal regions in orange, motor and presumptive auditory temporal regions in yellow, other temporal regions in purple, subcortical regions in dark gray, cingulo-opercular regions in black. N.B. The white regions represent all regions whose assignment was unclear across thresholds and/or methods and are not a single community. Numbered labels denote regions typically found in reading analyses and correspond to the ROIs labels from panel A.
Figure 4. Development of reading-related network organization.

A. Community assignment by Infomap of reading-related regions in 38 children (7–10 years old), 38 adolescents (11–14 years), and 38 adults (21–29 years) across a range of edge densities (from 15% to 5% in 1% steps). A bar with the community assignment made by looking across edge densities and methods is shown to the left of each of the three thresholded assignment plots. Regions are presented vertically in the order listed in Table 3. N.B. The white regions represent all regions whose assignment was unclear across thresholds and/or methods and are not a single community. Numbered labels denote regions typically found in reading analyses.
B. The location of the regions on the left hemispheres of the brain, colored by community assignment in each age group separately.
Community assignment using Infomap
Infomap divides the network by minimizing information theoretic descriptions of random walks on the network (Rosvall and Bergstrom, 2008). Thus, Infomap provides an independent and complementary method for analyzing the network structure. Infomap was also performed on a weighted correlation matrix of the reading network regions across the same range of thresholds used for modularity optimization in each age group. This method is non-deterministic and was run hundreds of times per analysis; the optimal solution was used. All Infomap analyses were performed using in-house software and code made publicly available by the authors of Infomap.
Comparing network structure across groups
Though examining the network structure across r-values is useful within a group of subjects, r-value-thresholded data is problematic for looking at data between groups. An r-value is dependent on both the particular group of subjects and regions used; an r-value of 0.2 could represent networks with different properties in separate groups due to uninteresting factors such as different number of connections. Therefore, to compare subject groups we used community detection algorithms across various connection densities - from 5–15% density of connections, or kdensity — which can be better equated across subjects groups. Most real-world networks exist with < 10% edge density, and almost all have less than 15% edge density (Newman, 2003). Thus, our thresholds of kden (edge density) = 5–15% were chosen largely because this range of edge densities reflects that of the real world networks (e.g., USA power grid: 2.7%, C. elegans neural network: 7.9%, karate club: 4.6%) used to define the graph analysis tools employed in this analysis. In terms of correlation thresholds, these edge densities span highly significant ranges of r > ~0.12 – r > ~0.25 (Figure S2). Correlation networks, unlike many networks, are full networks – every possible pairwise relationship is defined by a correlation coefficient. We focus on edge densities between 5–15% for the reasons mentioned above but our results hold across all positive thresholds (5–45%, Figure S1).
Results
Meta-analysis and developmental studies find a large group of reading-related regions
Combining the adult meta-analytic regions and the developmental reading regions resulted in 83 regions that were distributed across the brain (Table 3, Figure 2). Fifty-eight regions were obtained from the adult meta-analysis: 29 from the main effect of time (pink in Figure 2), 17 defined as showing an effect of lexicality by time (brown in Figure 2), 8 showing an effect of spelling to sound consistency by time (plum in Figure 2), and 4 showing an effect of frequency by time (peach in Figure 2). Twenty-five regions were defined in the developmental study, all of which showed more activity in children relative to adults (teal in Figure 2). Again, by including all regions showing significant BOLD activity during single word reading we are including regions involved both in many non-reading tasks (such as occipital and motor regions) and those commonly described as important for reading specifically, such as the putative visual word form area (VWFA), regions in the left supramarginal (SMG) and angular gyri (AG), a region in the left inferior temporal gyrus (ITG) that is close to the MTG region found in studies of semantic processing (i.e., Binder, Desai, Graves, & Conant, 2009), and a region in the left inferior frontal gyrus (IFG).
Figure 2. Reading-related regions.

Regions are colored by analysis that defined them.
Graph theoretic techniques reveal a network configuration similar to previous large network analyses
Two techniques, modularity optimization (Newman, 2006) and Infomap (Rosvall & Bergstrom, 2008) were used to define the network structure of reading-related regions in adults (21–29 years old). The modularity optimization and Infomap assignments from correlation coefficient thresholds of r = 0.0 to 0.25 are shown in Figure 3A (regions are presented in the order listed in Table 3). 9 communities were defined by visual inspection of the community assignment across techniques and correlation thresholds, shown in the leftmost column of Figure 3A and region coloration in Figure 3B. The assignments included two communities of visual regions – medial and lateral (maroon and red, respectively) and communities of regions overlapping the previously described fronto-parietal task control network (blue, Dosenbach et al., 2007) and default mode network (green, Fox et al., 2005; Greicius et al., 2003). Further inspection across thresholds also suggested communities of temporal regions (purple) and superior frontal and parietal regions (orange) that are sometimes assigned to the same community as a group of presumptive motor and auditory temporal regions (yellow). Additionally, these methods defined a cingulo-opercular community including members of the previously described cingulo-opercular control network (black, Dosenbach et al., 2007) and a group of all subcortical regions (gray), all of which are sometimes assigned to the same community. The 2 cerebellar regions were each assigned to their own community. Lastly, there was a set of regions that did not have a consistent community assignment across correlation thresholds and algorithms. These regions have all been colored white, but they are not a single community. It is important to note that among the “reading specific regions”, the VWFA is assigned to the visual community, the ITG and AG regions are assigned to the default mode community, and the IFG and SMG do not have a reliable community assignment across thresholds and methods. In other words, the regions consistently activated during reading do not form their own, separate community in this analysis, but rather generally integrate into previously defined communities (Power et al., 2011; Yeo et al., 2011).
No evidence of reading specialization is seen in the developmental network changes
Comparing the community assignment of the 83 regions in children, adolescents, and adults across a range of edge densities, used to ensure comparability across groups as described above, we find a generally similar network structure across the age groups. As with the adults, community assignment was made by visually inspecting the community assignments across edge densities across Infomap (shown in Figure 4) and modularity optimization (data not shown). Children and adolescents show a single visual community (red). A community overlapping the previously defined fronto-parietal network (Dosenbach et al., 2007) was found in both groups, though it is separated into its frontal and parietal components (medium blue and light blue, respectively) in children, while it is a single community by adolescence (blue, in middle panel of Figure 4). The regions overlapping the previously defined default mode community (green, Fox et al., 2005; Greicius et al., 2003) are also divided into frontal and parietal components (light green and dark green, respectively) in both children and adolescents. Communities of superior frontal and temporal regions (orange), presumptive motor regions (yellow), and all temporal regions (purple) are found in both child and adolescent subjects groups. A set of regions overlapping the previously defined cingulo-opercular attention network (black, Dosenbach et al., 2007; Dosenbach, Fair, Cohen, Schlaggar, & Petersen, 2008) and a community of subcortical regions (gray) are also found in both groups, as in adults.
Reading-related regions are distributed among a number of communities in children and adolescents, as in adults. In children, the putative VWFA is located in the visual community, the IFG in the frontal fronto-parietal community, the AG in the parietal default community, the SMG in the temporal community, and the ITG does not have a reliable community assignment. In adolescents the VWFA and IFG are placed in the fronto-parietal community, while the AG is in the default community, the SMG is in the temporal community and the ITG, again, does not have a reliable assignment. As in the adults, there is no indication of a specific community devoted to reading, and no indication that such a community emerges with development.
Discussion
We have defined a group of 83 regions used in reading single words aloud across development, presumably encompassing a majority of the regions involved in transforming a set of printed characters into verbal output. Defining these regions as nodes and the resting state correlations between the regions as edges, we used graph theoretic techniques to define the network structure of reading-related regions. We find that within our large group of meta-analysis derived reading-related regions, there does not appear to be a distinct community specific to reading. Rather, the functional organization of reading-related regions consists of communities similar to those previously described, such as the fronto-parietal and cingulo-opercular task control networks (Dosenbach et al., 2007) and default mode network (Fox et al., 2005; Greicius et al., 2003) as well as sensory and motor processing communities, an overall organization largely consistent with what has been seen in prior whole brain large analyses of brain regions (Power et al., 2011; Yeo et al., 2011). Overall, these results support the hypothesis that the defined reading-related regions perform relatively general processing that is useful for, but not specific to, reading.
Mature network structure of reading-related regions
Unlike most reading meta-analyses (Fiez & Petersen, 1998; Jobard et al., 2003; Turkeltaub et al., 2002; Vigneau et al., 2006) our reading–related region set includes regions not specific to reading tasks, such as primary motor and primary visual cortex. However, the analysis is not completely task-general as it also includes regions thought to be used predominantly in reading, such as the left visual word form area (VWFA, for review see McCandliss et al., 2003), and regions in the left supramarginal gyrus (SMG, Church et al., 2011; Church et al., 2008; Sandak et al., 2004), angular gyrus (AG, Binder et al., 2005; Graves et al., 2010), middle temporal gyrus (Binder et al., 2009), and left inferior frontal gyrus (IFG, Fiez et al., 1999; Mechelli et al., 2003). By using such a complete group of regions we had the possibility of describing the whole network used to perform overt word reading - from the processing of visual input through the production of spoken output.
In this analysis, we were unable to identify a specific community for word reading. Using multiple graph-analytic techniques, including Infomap (Rosvall & Bergstrom, 2008) and modularity optimization (Newman, 2006) a consistent community structure was identified; but rather than containing a reading community, per se, this community structure seemed to map onto previously reported functional systems. For example, we identified communities that overlapped with the fronto-parietal and cingulo-opercular control systems (Dosenbach et al., 2007), one overlapping the default mode system (Fox et al., 2005) and several communities seemingly related to sensorimotor processing (visual, motor, and temporal communities).
These overarching communities are consistent with those found in larger, whole brain, analyses using similar techniques (Power et al., 2011; Yeo et al., 2011). Here, the VWFA was found to be part of the visual community, the SMG and IFG did not have a specific community assignment, and the AG and ITG were found to be part of the default mode community. These observations, in isolation, could be taken to at least in part reflect sub-components of reading, as the VWFA is thought to be related to the visual processing of words, and the AG and ITG are thought to be related to semantic processing, which has been proposed as one function of the default mode system (Seghier and Price, 2012). Though in this analysis there is no consistent community assignment for the IFG and SMG, including no consistent relationship between the two regions, despite prior studies demonstrating both seem to play a role in phonological processing (Church, et al., 2011 and 2008; Graves, et al., 2010; Fiez, et al., 1999; Gitelman, et al., 2005; Mechelli, et al., 2003; Pugh et al., 1996). Overall, interpreting our findings in the context of the communities identified from whole brain analyses leads to the conclusion that the community organization in the current study is driven by the overall community structure of the brain, and not by reading related functions, per se.
As discussed in the Introduction, reading is a newly acquired skill in evolutionary terms (and, of course, is still not a universal skill). The question we would like to answer is whether regions frequently used in reading are rather preferentially committed to reading processes or whether they are more general-use regions that are involved in many (perhaps disparate) processes. If RSFC reflects histories of coactivation it is a uniquely useful measure for gauging such alternatives. On the former account, if reading regions are primarily used for reading, then they will exhibit high and specific RSFC correlations to other reading regions. On the latter account, if a region is only intermittently used for reading and instead is more frequently coactivated in the service of other processes, its RSFC correlations will not be specific, or perhaps even high, to other reading regions, but will reflect its coactivation with other (non-reading) regions. Our community analyses largely support the latter account.
The lack of specific and high RSFC correlations among reading regions can be also found in a seed map approach to RSFC data (as opposed to a community analysis). In a seed map analysis, the RSFC timecourse from a given seed region is correlated with every other voxel in the brain. Those voxels showing significant correlations with the seed region are considered functionally related to the seed region. When Koyama and colleagues performed a seed map analysis on six potential “reading regions”, including the VWFA, SMG, AG, and IFG, they did find two regions of overlap in the SMG and IFG in 5 of the 6 maps; but the seed maps also contained a large number of non-overlapping regions (Koyama et al., 2010). While these seed map differences were not the focus of the study, they support the idea that these regions are not part of one particular system but rather that these regions perform a function that is used in reading and other tasks as well. We have used a seed map based approach to show the VWFA to be more closely related to regions of the dorsal attention system than to other reading-related regions (Vogel et al., 2011).
We must distinguish between the meaning of our functional connectivity results in a task-free setting and the meaning of effective connectivity in a task setting. Effective connectivity aims to derive causal relationships from temporal precedence in timeseries, exemplified by methods like dynamic causal modeling (Friston, Harrison, & Penny, 2003) and Granger causality (Eichler, 2005; Granger, 1969). These methods address how a small number of regions interact in a specific task. Previous effective connectivity studies of reading-related regions have established that VWFA, SMG/AG and IFG interact during orthographic and phonologic processing tasks (Bitan et al., 2007). Our findings are consistent with a view that reading regions are coactive during reading but are otherwise not especially coactive with one another. The origin of RSFC is not yet clear but it appears to relate both to the physical structure of the brains connections (Honey et al., 2009) and to histories of coactivation (Power et al., 2011; Lewis et al., 2009). RSFC does not address how regions interact during one specific task (e.g., reading). However, the current network-level analysis demonstrates that when the presumptive “whole” of these regions’ patterns of co-activation across many tasks is considered, reading-related regions are more commonly activated with other, more general-use regions than each other, indicating information processing characteristics not restricted to reading.
It should also be noted that the graph analysis methods described here are essentially descriptive. We made several attempts to demonstrate the reliability of our results. First, we defined communities across a range of correlation coefficient thresholds. The community assignment across thresholds is generally consistent as can be seen visually in Figure 3. Second, we used two independent network analysis methods to define communities. The reliability in community assignments across these methods can also been seen in Figure 3.
Development of the network structure of reading-related regions
We also did not observe developmental changes indicative of a developing reading network or any type of reading specificity. We did not see a general integration of “reading-preferential” regions into a community or even any obvious change to the community assignment of these regions across development. The detected child and adolescent communities generally recapitulated the adult communities, though both showed only a single visual community and separate frontal and parietal communities of default mode regions, and children also showed separate frontal and parietal communities of fronto-parietal control regions (see Figures 4 and 5). It should be noted, however, that there is still some level of movement in our data (allowing for a frame-by-frame displacement of up to 0.5mm), and some of these developmental differences may be due to that movement (Power et al., 2012). Together, these results demonstrate that while reading is a learned skill that continues to improve greatly between the ages of 7 and 21 years, no reading specific changes in the resting state functional connectivity networks were seen, thus providing further evidence that though these regions may be used in reading, they are not used predominantly for reading.
We suspect that the lack of reading specific network development is likely due, in part, to the correspondence between RSFC correlations and a history of coactivation. Previous work by Bitan et al. (2007) shows developmental changes in effective connectivity among reading-related regions with increasing age and reading skill in orthographic and phonologic processing tasks performed on written stimuli. But, since RSFC encompasses changes related to increasing age and skill across many tasks, not only reading, the more general use developmental changes are likely to be more influential in our analysis. Individual region RSFC analyses may allow for detection of other non-specific, though perhaps reading-influenced, changes. For example, we have recently demonstrated changes in VWFA connectivity to dorsal attention system regions related to reading ability (Vogel et al., 2011).
Limitations
There are several limitations to this study, both in the selection of the regions from the meta-analysis and in the network analysis itself. First, in functional MRI studies, there is a large difference in the effect size expected for main effect analyses such as the main effect of reading and the effect size expected for more specific comparisons such as lexicality, frequency, and consistency. The difference in effect size has required that we use different Z-score thresholds to define regions for the meta-analysis, as described above. Additionally, the community detection methods used here do not allow for straightforward statistical tests of reliability or direct comparisons between groups, as mentioned above. Due to these limitations we have used two separate methods of community detection to define the network structure of reading-related regions in adults, adolescents, and children and have shown the results across a wide range of correlation and edge density thresholds. However, we cannot definitively say that there are no developmental differences between groups as there is no way to directly compare the groups with these methods; we have shown there are no qualitative changes in the network structure of reading-related regions from 7 years to adulthood.
Summary and Conclusions
In this study, we first derived a large set of reading-related regions that show consistent changes in BOLD activity when adults read single words aloud. We then demonstrated, using several resting-state functional connectivity MRI and graph theoretic methods, that there does not appear to be a specific community of reading-related regions. This observation does not mean that there are not special relationships between some of these regions during reading, but rather lends support to the idea that these regions are broadly used across many tasks, including reading. Consistent with this interpretation, we recapitulate previously identified adult RSFC functional networks including the default mode, fronto-parietal and cingulo-opercular control systems, and show neither marked nor consistent changes in this organization across development from age 7 years to adulthood. Overall, we argue these results should encourage the investigation of the general types of processing performed in neural regions, which may underlie their involvement in a number of tasks, rather than attempts to ascribe particular brain regions to specific cognitive skills.
Supplementary Material
Community assignment of reading-related regions in 38 adults, defined using InfoMap across a range of edge densities of 45% to 1% in 1% steps, which corresponds to correlation values of 0.0 to 0.44. Each edge density threshold is plotted as a column and each region as a row. Corresponding r values for edge density thresholds are shown at the bottom of the figure. The color of each cell depicts the community assignment of the region at each edge density threshold. This analysis was run without restricting either the Q to > 0.4 or restricting the percent connectedness to > 80%. At no threshold are canonical reading regions in a single community.
For all edges in the 83×83 node network, this plot shows the statistical significance of edges (p values) plotted against edge weights (Pearson r values). P values are produced using a one-sample t-test of z-transformed Pearson r values at each edge across subjects. P values are plotted using −log10(p) scale (e.g., −log10(p < 0.01) = 2). Correlation coefficients (r-values) are plotted on the x-axis, including negative r-values that are not used in this analysis, with r= 0.25, the highest value used in our main analyses noted. Red points pass Bonferonni correction for p < 0.05.
Highlights.
Reading-related regions defined in a meta-analysis of 5 single-word reading studies
Network analysis techniques show no special relationships between reading regions
Network analysis tools show no special relationships across development0
Reading-related regions are not just used in reading but have more general functions
Acknowledgments
This work was supported by the National Institutes of Health (grant numbers: NS0534425 to B.L.S, HD057076 to B.L.S., NS61144 to S.E.P, and NS6144 to S.E.P), the National Science Foundation (IGERT grant number 0548890 to A.C.V. and J.D.P). Data Collection was additionally supported by the Burroughs Wellcome Fund (to B.L.S.), the Charles A. Dana Foundation (to B.L.S.), the Brooks Family Fund (to B.L.S.), the Tourrette Syndrome Foundation (to B.L.S) the Simons Foundation for Autism Research grant 95117 (to S.E.P.) and the McDonnell Foundation Collaborative Activity Award (to S.E.P.). The authors would like to thank Dr. John Pruett, Dr. Deanna Barch (data collection supported by NIH grant P50 MH71616), Dr. Tamara Hershey (data collection supported by Diabetes Research and Training Center at Washington University grant and NIH P60 DK020579-31), and Dr. Judith Lieu (data collection supported by to J.L. Wiley H. Harrison Memorial Research Award from the American Research Foundation) for the use of their data. We thank Dr. Steven Nelson, Joe Dubis (supported by NIH T32 GM081739), Rebecca Coalson, Kelly McVey, and Rebecca Lepore for their assistance in data collection. We would also like to gratefully acknowledge Dr. Kelly Barnes, Dr. Alex Cohen, Dr. Nico Dosenbach, Dr. Damien Fair, and Dr. Steven Nelson for their many hours of discussion related to this study.
Footnotes
Publisher's Disclaimer: This is a PDF file of an unedited manuscript that has been accepted for publication. As a service to our customers we are providing this early version of the manuscript. The manuscript will undergo copyediting, typesetting, and review of the resulting proof before it is published in its final citable form. Please note that during the production process errors may be discovered which could affect the content, and all legal disclaimers that apply to the journal pertain.
References
- Binder JR, Medler DA, Desai R, Conant LL, Liebenthal E. Some neurophysiological constraints on models of word naming. Neuroimage. 2005;27(3):677–693. doi: 10.1016/j.neuroimage.2005.04.029. [DOI] [PubMed] [Google Scholar]
- Binder JR, Desai R, Graves WW, Conant LL. Where is the semantic system? A critical review and meta-analysis of 120 functional neuroimaging studies. Cerebral Cortex. 2009;19(12):2767–2796. doi: 10.1093/cercor/bhp055. [DOI] [PMC free article] [PubMed] [Google Scholar]
- Biswal B, Yetkin FZ, Haughton VM, Hyde JS. Functional connectivity in the motor cortex of resting human brain using echo-planar MRI. Magn Reson Med. 1995;34(4):537–541. doi: 10.1002/mrm.1910340409. [DOI] [PubMed] [Google Scholar]
- Bitan T, Booth JR, Choy J, Burman DD, Gitelman DR, Mesulam MM. Shifts of effective connectivity within a language network during rhyming and spelling. J Neurosci. 2005;25:5397–5403. doi: 10.1523/JNEUROSCI.0864-05.2005. [DOI] [PMC free article] [PubMed] [Google Scholar]
- Bitan T, Burman DD, Lu D, Cone NE, Gitelman DR, Mesulam MM, Booth JR. Weaker top-down modulation from the left inferior frontal gyrus in children. Neuroimage. 2006;33(3):991–998. doi: 10.1016/j.neuroimage.2006.07.007. [DOI] [PMC free article] [PubMed] [Google Scholar]
- Bitan T, Cheon J, Lu D, Burman DD, Gitelman DR, Mesulam MM, et al. Developmental changes in activation and effective connectivity in phonological processing. Neuroimage. 2007;38(3):564–575. doi: 10.1016/j.neuroimage.2007.07.048. [DOI] [PMC free article] [PubMed] [Google Scholar]
- Booth JR, Burman DD, Meyer JR, Gitelman DR, Parrish TB, Mesulam MM. Development of brain mechanisms for processing orthographic and phonologic representations. J Cogn Neurosci. 2004;16(7):1234–1249. doi: 10.1162/0898929041920496. [DOI] [PMC free article] [PubMed] [Google Scholar]
- Brem S, Bach S, Kucian K, Guttorm TK, Martin E, Lyytinen H, Brandeis D, Richardson U. Brain sensititivity to print emerges when children learn letter-speech sound correspondences. Proc Nat Acad Sci. 2010;107(17):7939–44. doi: 10.1073/pnas.0904402107. [DOI] [PMC free article] [PubMed] [Google Scholar]
- Brown TT, Lugar HM, Coalson RS, Miezin FM, Petersen SE, Schlaggar BL. Developmental changes in human cerebral functional organization for word generation. Cerebral Cortex. 2005;15:275–290. doi: 10.1093/cercor/bhh129. [DOI] [PubMed] [Google Scholar]
- Bullmore E, Sporns O. Complex brain networks: graph theoretical analysis of structural and functional systems. Nature Reviews Neuroscience. 2009;10:186–198. doi: 10.1038/nrn2575. [DOI] [PubMed] [Google Scholar]
- Chou TL, Booth JR, Burman DD, Bitan T, Bigio JD, Lu D, et al. Developmental changes in the neural correlates of semantic processing. Neuroimage. 2006;29(4):1141–1149. doi: 10.1016/j.neuroimage.2005.09.064. [DOI] [PubMed] [Google Scholar]
- Church JA, Balota DA, Petersen SE, Schlaggar BL. Manipulation of Length and Lexicality Localizes the Functional Neuroanatomy of Phonological Processing in Adult Readers. J Cogn Neurosci. 2011;23(6):1475–1493. doi: 10.1162/jocn.2010.21515. [DOI] [PMC free article] [PubMed] [Google Scholar]
- Church JA, Coalson RS, Lugar HM, Petersen SE, Schlaggar BL. A developmental fMRI study of reading and repetition reveals changes in phonological and visual mechanisms over age. Cerebral Cortex. 2008;18(9):2054–2065. doi: 10.1093/cercor/bhm228. [DOI] [PMC free article] [PubMed] [Google Scholar]
- Cohen L, Dehaene S. Specialization within the ventral stream: the case for the visual word form area. Neuroimage. 2004;22(1):466–476. doi: 10.1016/j.neuroimage.2003.12.049. [DOI] [PubMed] [Google Scholar]
- Corbetta M, Shulman GL. Control of goal-directed and stimulus-driven attention in the brain. Nat Review Neurosci. 2002;3(3):201–215. doi: 10.1038/nrn755. [DOI] [PubMed] [Google Scholar]
- Dehaene S, Cohen L. The unique role of the visual word form area in reading. Trend Cogn Sci. 2011;15(6):254–262. doi: 10.1016/j.tics.2011.04.003. [DOI] [PubMed] [Google Scholar]
- Dosenbach NUF, Fair DA, Cohen AL, Schlaggar BL, Petersen SE. A dual-networks architecture of top-down control. Trends Cogn Sci. 2008;12(3):99–105. doi: 10.1016/j.tics.2008.01.001. [DOI] [PMC free article] [PubMed] [Google Scholar]
- Dosenbach NUF, Fair DA, Miezin FM, Cohen AL, Wenger KK, Dosenbach RAT, et al. Distinct brain networks for adaptive and stable task control in humans. Proc Natl Acad Sci U S A. 2007;104(26):11073–11078. doi: 10.1073/pnas.0704320104. [DOI] [PMC free article] [PubMed] [Google Scholar]
- Eichler M. A graphical approach for evaluating effective connectivity in neural systems. Philos Trans R Soc Lond B Biol Sci. 2005;360(1457):953–967. doi: 10.1098/rstb.2005.1641. [DOI] [PMC free article] [PubMed] [Google Scholar]
- Fair DA, Cohen AL, Power JD, Dosenbach NU, Church JA, Miezin FM, et al. Functional brain networks develop from a “local to distributed” organization. PLoS Comput Biol. 2009;5(5):e1000381. doi: 10.1371/journal.pcbi.1000381. [DOI] [PMC free article] [PubMed] [Google Scholar]
- Fair DA, Dosenbach NUF, Church JA, Cohen AL, Brahmbhatt S, Miezin FM, et al. Development of distinct control networks through segregation and integration. Proc Natl Acad Sci U S A. 2007;104(33):13507–13512. doi: 10.1073/pnas.0705843104. [DOI] [PMC free article] [PubMed] [Google Scholar]
- Fiez J, Balota D, Raichle M, Petersen S. Effects of lexicality, frequency, and spelling-to-sound consistency on the functional anatomy of reading. Neuron. 1999;24(1):205–218. doi: 10.1016/s0896-6273(00)80833-8. [DOI] [PubMed] [Google Scholar]
- Fiez J, Petersen S. Neuroimaging studies of word reading. Proc Natl Acad Sci U S A. 1998;95(3):914–921. doi: 10.1073/pnas.95.3.914. [DOI] [PMC free article] [PubMed] [Google Scholar]
- Fortunato S. Community detection in graphs. Physics Reports. 2010;486(3–5):75–174. [Google Scholar]
- Fox MD, Raichle ME. Spontaneous fluctuations in brain activity observed with functional magnetic resonance imaging. Nature Reviews Neuroscience. 2007;8:700–711. doi: 10.1038/nrn2201. [DOI] [PubMed] [Google Scholar]
- Fox MD, Snyder AZ, Vincent JL, Corbetta M, Van Essen DC, Raichle ME. The human brain is intrinsically organized into dynamic, anticorrelated functional networks. Proc Natl Acad Sci U S A. 2005;102(27):9673–9678. doi: 10.1073/pnas.0504136102. [DOI] [PMC free article] [PubMed] [Google Scholar]
- Fox MD, Zhang D, Snyder AZ, Raichle ME. The Global Signal and Observed Anticorrelated Resting State Brain Networks. J Neurophysiol. 2009;101(6):3270–3283. doi: 10.1152/jn.90777.2008. [DOI] [PMC free article] [PubMed] [Google Scholar]
- Friston KJ, Harrison L, Penny W. Dynamic causal modelling. Neuroimage. 2003;19(4):1273–1302. doi: 10.1016/s1053-8119(03)00202-7. [DOI] [PubMed] [Google Scholar]
- Gitelman DR, Nobre AC, Sonty S, Parrish TB, Mesulam MM. Language network specializations: an analysis with parallel task designs and functional magnetic resonance imaging. Neuroimage. 2005;26(4):975–985. doi: 10.1016/j.neuroimage.2005.03.014. [DOI] [PubMed] [Google Scholar]
- Granger CWJ. Investigating causal relations by econometric models and cross-spectral methods. Econometrica. 1969;37(3):424–438. [Google Scholar]
- Graves WW, Desai R, Humphries C, Seidenberg MS, Binder JR. Neural systems for reading aloud: a multiparametric approach. Cereb Cortex. 2010;20(8):1799–1815. doi: 10.1093/cercor/bhp245. [DOI] [PMC free article] [PubMed] [Google Scholar]
- Greicius M, Krasnow B, Reiss A, Menon V. Functional connectivity in the resting brain: A network analysis of the default mode hypothesis. Proc of the Nat Acad of Sci U S A. 2003;100(1):253–258. doi: 10.1073/pnas.0135058100. [DOI] [PMC free article] [PubMed] [Google Scholar]
- Hampson M, Tokoglu F, Sun Z, Schafer RJ, Skudlarski P, Gore JC, et al. Connectivity-behavior analysis reveals that functional connectivity between left BA39 and Broca’s area varies with reading ability. Neuroimage. 2006;31(2):513–519. doi: 10.1016/j.neuroimage.2005.12.040. [DOI] [PubMed] [Google Scholar]
- Honey CJ, Sporns O, Cammoun L, Gigandet X, Thiran JP, Meuli R, Hagmann P. Preducting human resting-state functional connectivity from structural connectivity. Proc of the Nat Acad of Sci U S A. 2009;106(6):2035–2040. doi: 10.1073/pnas.0811168106. [DOI] [PMC free article] [PubMed] [Google Scholar]
- Hosseini SM, Hoeft F, Kesler SR. GAT: a graph-theoretical analysis toolbox for analyzing between group differences in large-scale structural and functional brain networks. PLoS One. 2012;7(7):e40709. doi: 10.1371/journal.pone.0040709. [DOI] [PMC free article] [PubMed] [Google Scholar]
- Horwitz B, Rumse JM, Donohue BC. Functional connectivity of the angular gyrus in normal reading and dyslexia. Proc of the Nat Acad of Sci U S A. 1998;95(15):8939–8944. doi: 10.1073/pnas.95.15.8939. [DOI] [PMC free article] [PubMed] [Google Scholar]
- Hunter JE, Schmidt FL. Methods of Meta-analysis: correcting error and bias in research findings. Newbury Park, CA: Sage; 1990. [Google Scholar]
- Jobard G, Crivello F, Tzourio-Mazoyer N. Evaluation of the dual route theory of reading: a metanalysis of 35 neuroimaging studies. Neuroimage. 2003;20(2):693–712. doi: 10.1016/S1053-8119(03)00343-4. [DOI] [PubMed] [Google Scholar]
- Koyama MS, Kelly C, Shehzad Z, Penesetti D, Castellanos FX, Milham MP. Reading networks at rest. Cereb Cortex. 2010;20(11):2549–2559. doi: 10.1093/cercor/bhq005. [DOI] [PMC free article] [PubMed] [Google Scholar]
- Lancaster JL, Glass TG, Lankipalli BR, Downs H, Mayberg H, Fox PT. A Modality-Independent Approach to Spatial Normalization of Tomographic Images of the Human Brain. Hum Brain Mapp. 1995;3:209–223. [Google Scholar]
- Lewis CM, Baldassarre A, Committeri G, Romani GL, Corbetta M. Learning sculpts the spontaneous activity of the resting huam brain. Proc of the Nat Acad of Sci U S A. 2009;106(41):17558–17563. doi: 10.1073/pnas.0902455106. [DOI] [PMC free article] [PubMed] [Google Scholar]
- Lowe MJ, Mock BJ, Sorensen JA. Functional connectivity in single and multislice echo-planar imaging using resting state fluctuations. Neuroimage. 1998;7(2):119–132. doi: 10.1006/nimg.1997.0315. [DOI] [PubMed] [Google Scholar]
- Maurer U, Brem S, Bucher K, Brandeis D. Emerging neurophysiological specialization for letter strings. J Cogn Neurosci. 2005;17(10):1532–1552. doi: 10.1162/089892905774597218. [DOI] [PubMed] [Google Scholar]
- McCandliss BD, Cohen L, Dehaene S. The visual word form area: expertise for reading in the fusiform gyrus. Trends Cogn Sci. 2003;7(7):293–299. doi: 10.1016/s1364-6613(03)00134-7. [DOI] [PubMed] [Google Scholar]
- Mechelli A, Gorno-Tempini ML, Price CJ. Neuroimaging studies of word and pseudoword reading: consistencies, inconsistencies, and limitations. J Cogn Neurosci. 2003;15(2):260–271. doi: 10.1162/089892903321208196. [DOI] [PubMed] [Google Scholar]
- Miezin FM, Maccotta L, Ollinger JM, Petersen SE, Buckner RL. Characterizing the hemodynamic response: Effects of presentation rate, sampling procedure, and the possibility of ordering brain activity based on relative timing. NeuroImage. 2000;11:735–759. doi: 10.1006/nimg.2000.0568. [DOI] [PubMed] [Google Scholar]
- Newman ME. Properties of highly clustered networks. Phys Rev E Stat Nonlin Soft Matter Phys. 2003;68(2 Pt 2):026121. doi: 10.1103/PhysRevE.68.026121. [DOI] [PubMed] [Google Scholar]
- Newman ME. Modularity and community structure in networks. Proc Natl Acad Sci U S A. 2006;103(23):8577–8582. doi: 10.1073/pnas.0601602103. [DOI] [PMC free article] [PubMed] [Google Scholar]
- Newman ME, Girvan M. Finding and evaluating community structure in networks. Phys Rev E Stat Nonlin Soft Matter Phys. 2004;69(2 Pt 2):026113. doi: 10.1103/PhysRevE.69.026113. [DOI] [PubMed] [Google Scholar]
- Polk TA, Stallcup M, Aguirre GK, Alsop DC, D’Esposito M, Detre JA, et al. Neural specialization for letter recognition. J Cogn Neurosci. 2002;14(2):145–159. doi: 10.1162/089892902317236803. [DOI] [PubMed] [Google Scholar]
- Power JD, Barnes KA, Snyder AZ, Schlaggar BL, Petersen SE. Spurious but systematic correlations in functional connectivity MRI networks arise from subject motion. Neuroimage. 2012;59(3):2142–2154. doi: 10.1016/j.neuroimage.2011.10.018. [DOI] [PMC free article] [PubMed] [Google Scholar]
- Power JD, Cohen AL, Nelson SM, Wig GS, Barnes KAB, Church JA, Vogel AC, Laumann TO, Miezin FM, Schlaggar BL, Petersen SE. Functional network organization of the human brain. Neuron. 2011;72(4):665–678. doi: 10.1016/j.neuron.2011.09.006. [DOI] [PMC free article] [PubMed] [Google Scholar]
- Power JD, Fair DA, Schlaggar BL, Petersen SE. The development of functional human brain networks. Neuron. 2010;67(5):735–748. doi: 10.1016/j.neuron.2010.08.017. [DOI] [PMC free article] [PubMed] [Google Scholar]
- Price CJ, Devlin JT. The myth of the visual word form area. Neuroimage. 2003;19:473–481. doi: 10.1016/s1053-8119(03)00084-3. [DOI] [PubMed] [Google Scholar]
- Price CJ, Devlin JT. The interactive account of ventral occipitotemporal contributions to reading. Trend Cogn Sci. 2011;15(6):246–253. doi: 10.1016/j.tics.2011.04.001. [DOI] [PMC free article] [PubMed] [Google Scholar]
- Puce A, Allison T, Asgari M, Gore JC, McCarthy G. Differential sensitivity of human visual cortex to faces, letterstrings, and textures: a functional magnetic resonance imaging study. J Neurosci. 1996;16(16):5205–5215. doi: 10.1523/JNEUROSCI.16-16-05205.1996. [DOI] [PMC free article] [PubMed] [Google Scholar]
- Pugh KR, Shaywitz BA, Shaywitz SE, Constable RT, Skudlarski P, Fulbright RK, et al. Cerebral organization of component processes in reading. Brain. 1996;119 (Pt 4):1221–1238. doi: 10.1093/brain/119.4.1221. [DOI] [PubMed] [Google Scholar]
- Rosvall M, Bergstrom CT. Maps of random walks on complex networks reveal community structure. Proceedings of the National Academy of Sciences of the United States of America. 2008;105(4):1118–1123. doi: 10.1073/pnas.0706851105. [DOI] [PMC free article] [PubMed] [Google Scholar]
- Sandak R, Mencl WE, Frost SJ, Rueckl JG, Katz L, Moore DL, et al. The neurobiology of adaptive learning in reading: a contrast of different training conditions. Cogn Affect Behav Neurosci. 2004;4(1):67–88. doi: 10.3758/cabn.4.1.67. [DOI] [PubMed] [Google Scholar]
- Schlaggar BL, Brown T, Lugar H, Visscher K. Functional neuroanatomical differences between adults and school-age children in the processing of single words. Science. 2002;296:1476–1479. doi: 10.1126/science.1069464. [DOI] [PubMed] [Google Scholar]
- Schlaggar BL, Church JA. Functional neuroimaging insights into the development of skilled reading. Curr Dir Psychol Sci. 2009;18(1):21–26. doi: 10.1111/j.1467-8721.2009.01599.x. [DOI] [PMC free article] [PubMed] [Google Scholar]
- Schlaggar BL, McCandliss BD. Development of neural systems for reading. Annual Review of Neuroscience. 2007;30:475–503. doi: 10.1146/annurev.neuro.28.061604.135645. [DOI] [PubMed] [Google Scholar]
- Seghier ML, Price CJ. Functional heterogeneity within the default network during semantic processing and speech production. Front Psychol. 2012;2(281) doi: 10.3389/fpsyg.2012.00281. epub Aug 13 2012. [DOI] [PMC free article] [PubMed] [Google Scholar]
- Snyder AZ. Difference image vs. ratio image error function forms in PET-PET realignment. In: Myer R, Cunningham VJ, Bailey DL, Jones T, editors. Quantification of Brain Function Using PET. San Diego, CA: Academic Press; 1996. pp. 131–137. [Google Scholar]
- Sporns O, Chialvo DR, Kaiser M, Hilgetag CC. Organization, development and function of complex brain networks. Trends Cogn Sci. 2004;8(9):418–425. doi: 10.1016/j.tics.2004.07.008. [DOI] [PubMed] [Google Scholar]
- Talairach J, Tournoux P. In: Co-Planar Stereotaxic Atlas of the Human Brain. Rayport M, translator. New York: Thieme Medical Publishers, Inc; 1988. [Google Scholar]
- Tarkiainen A, Helenius P, Hansen PC, Cornelissen PL, Salmelin R. Dynamics of letter string perception in the human occipitotemporal cortex. Brain. 1999;122 (Pt 11):2119–2132. doi: 10.1093/brain/122.11.2119. [DOI] [PubMed] [Google Scholar]
- Turkeltaub PE, Eden GF, Jones KM, Zeffiro TA. Meta-analysis of the functional neuroanatomy of single-word reading: method and validation. Neuroimage. 2002;16(3 Pt 1):765–780. doi: 10.1006/nimg.2002.1131. [DOI] [PubMed] [Google Scholar]
- Vigneau M, Beaucousin V, Herve PY, Duffau H, Crivello F, Houde O, et al. Meta-analyzing left hemisphere language areas: phonology, semantics, and sentence processing. Neuroimage. 2006;30(4):1414–1432. doi: 10.1016/j.neuroimage.2005.11.002. [DOI] [PubMed] [Google Scholar]
- Vinckier F, Dehaene S, Jobert A, Dubus JP, Sigman M, Cohen L. Hierarchical coding of letter strings in the ventral stream: dissecting the inner organization of the visual word-form system. Neuron. 2007;55(1):143–156. doi: 10.1016/j.neuron.2007.05.031. [DOI] [PubMed] [Google Scholar]
- Vogel AC, Miezin FM, Petersen SE, Schlaggar BL. The putative visual word form area is functionally connected to the dorsal attention network. Cerebral Cortex. 2011 doi: 10.1093/cercor/bhr100. epub ahead of print. [DOI] [PMC free article] [PubMed] [Google Scholar]
- Vogel AC, Petersen SE, Schlaggar BL. The left occipito-temporal cortex does not show preferential activity for words. Cerebral Cortex. 2012 doi: 10.1093/cercor/bhr295. epub ahead of print. [DOI] [PMC free article] [PubMed] [Google Scholar]
- Vogel AC, Power JD, Schlaggar BL, Petersen SE. Development of the brain’s functional network architecture. Neuropsychology Reviews. 2010;20(4):362–375. doi: 10.1007/s11065-010-9145-7. [DOI] [PMC free article] [PubMed] [Google Scholar]
- Vourkas M, Micheloyannia S, Simos PG, Razaie R, Fletcher JM, Cirino PT, Papanicolaou AC. Dynamic task-specific brain network connectivity in children with severe reading difficulties. Neuroscience Letters. 2011;488:123–128. doi: 10.1016/j.neulet.2010.11.013. [DOI] [PMC free article] [PubMed] [Google Scholar]
- Yeo BT, Krienen LT, Sepulcre J, Sabuncu MR, Lashkari D, Hollinshead M, Roffman JL, Smoller JW, Zollei L, Polimeni JR, Fischl B, Liu H, Buckner RL. The organization of human cerebral cortex estimated by intrinsic functional connectivity. J of Neurophyiol. 2011;106(3):1125–1165. doi: 10.1152/jn.00338.2011. [DOI] [PMC free article] [PubMed] [Google Scholar]
- Zalesky A, Fornito A, Bullmore E. On the use of correlation as a measure of network connectivity. NeuroImage. 2012;60(4):2096–2106. doi: 10.1016/j.neuroimage.2012.02.001. [DOI] [PubMed] [Google Scholar]
Associated Data
This section collects any data citations, data availability statements, or supplementary materials included in this article.
Supplementary Materials
Community assignment of reading-related regions in 38 adults, defined using InfoMap across a range of edge densities of 45% to 1% in 1% steps, which corresponds to correlation values of 0.0 to 0.44. Each edge density threshold is plotted as a column and each region as a row. Corresponding r values for edge density thresholds are shown at the bottom of the figure. The color of each cell depicts the community assignment of the region at each edge density threshold. This analysis was run without restricting either the Q to > 0.4 or restricting the percent connectedness to > 80%. At no threshold are canonical reading regions in a single community.
For all edges in the 83×83 node network, this plot shows the statistical significance of edges (p values) plotted against edge weights (Pearson r values). P values are produced using a one-sample t-test of z-transformed Pearson r values at each edge across subjects. P values are plotted using −log10(p) scale (e.g., −log10(p < 0.01) = 2). Correlation coefficients (r-values) are plotted on the x-axis, including negative r-values that are not used in this analysis, with r= 0.25, the highest value used in our main analyses noted. Red points pass Bonferonni correction for p < 0.05.