

Abstract
In our companion study (Jarvis et al., 2013) we used quantitative brain molecular profiling to discover that distinct subdivisions in the avian pallium above and below the ventricle and the associated mesopallium lamina have similar molecular profiles, leading to a hypothesis that they may form as continuous subdivisions around the lateral ventricle. To explore this hypothesis, here we profiled the expression of 16 genes at 8 developmental stages. The genes included those that define brain subdivisions in the adult and some that are also involved in brain development. We found that phyletic hierarchical cluster and linear regression network analyses of gene expression profiles implicated single and mix ancestry of these brain regions at early embryonic stages. Most gene expression-defined pallial subdivisions began as one ventral or dorsal domain that later formed specific folds around the lateral ventricle. Subsequently a clear ventricle boundary formed, partitioning them into dorsal and ventral pallial subdivisions surrounding the mesopallium lamina. These subdivisions each included two parts of the mesopallium, the nidopallium and hyperpallium, and the arcopallium and hippocampus, respectively. Each subdivision expression profile had a different temporal order of appearance, similar in timing to the order of analogous cell types of the mammalian cortex. Further, like the mammalian pallium, expression in the ventral pallial subdivisions became distinct during pre-hatch development, whereas the dorsal portions did so during post-hatch development. These findings support the continuum hypothesis of avian brain subdivision development around the ventricle and influence hypotheses on homologies of the avian pallium with other vertebrates.
Keywords: brain evolution, in situ hybridization, zebra finch, embryo, pallium, subpallium, FOXP1, COUP-TF2, ROR-β, LHX9, PPAPPDC1A, anatomical gene expression networks
INTRODUCTION
The telencephalon is regarded as a complex and elaborated structure of the brain. The evolutionary origin and organization of this structure is still unclear. The avian telencephalon organization was recently re-classified into two major regions that contain at least seven major subdivisions: pallium [containing hyperpallium, mesopallium, nidopallium, arcopallium and hippocampus] and subpallium [containing striatum and pallidum] (Reiner et al., 2004; Jarvis et al., 2005). The avian supallial subdivisions are considered well conserved with their mammalian counterparts in developmental origin, connectivity, cell types, and cell organization (Medina and Abellan, 2009; Butler et al., 2011). However, the pallial subdivisions are less conserved, and thus our understanding of the organization of the avian pallium and its cellular homologies with mammals has still been controversial (Jarvis et al., 2005; Butler et al., 2011; Puelles, 2011; Martinez-Garcia et al., 2012).
There are two main competing hypotheses: 1) The “nuclear-to-layered hypothesis” posits that the different nuclear subdivisions of the avian pallium contain cells that are homologous to different layers of the mammalian cortex (Jarvis et al., 2005; Wang et al., 2010); 2) The “nuclear-to-claustrum/amygdala hypothesis” posits that the different nuclear subdivisions of the avian pallium below the lateral ventricle, called the dorsal ventricular ridge (DVR; abbreviations in Table 1), are homologous to the mammalian amygdala and claustrum (Puelles, 2001; Jarvis et al., 2005; Medina and Abellan, 2009). A less discussed hypothesis is that the avian anterior DVR (minus arcopallium) has cell types that are homologous as a field between the mammalian cortex and claustrum/amygdala complex (Butler and Molnar, 2002; Butler et al., 2002). All hypotheses treat the DVR below and the dorsal pallial subdivisions above the lateral ventricle respectively as different from each other, and as a result their subdivisions have been given different names in the classical and recently revised terminologies (Reiner et al., 2004; Jarvis et al., 2005). Our companion study (Jarvis et al., 2013) suggests that the dorsal and ventral subdivisions of the avian pallium have gene expression profiles more similar to each other cross the ventricle divide than they do on the same side of the ventricle, and thus that the DVR should not be thought of as a separate structure from the dorsal pallium (or dorsal cortex). However, this new hypothesis of avian pallium organization is based exclusively on adult features, whereas developmental profiles could help support or refute it.
Table 1.
Abbreviations of brain areas.
| A | Arcopallium |
| Aa | Arcopallium, anterior |
| Ad | Arcopallium, dorsal |
| AH | Anterior hypothalamus |
| Ai | Arcopallium, intermediat |
| aIH | Anterior Intercalated Hyperpallium |
| Ap | Arcopallium, posterior |
| B | Basorostralis |
| Cb | Cerebellum |
| Cl | Claustrum |
| Cld | Claustrum, dorsal |
| Clv | Claustrum, ventral |
| DLM | Dorso-lateral nucleus of the medial thalamus |
| DT | Dorsal thalamus |
| DVR | Dorsal ventricular ridge |
| E | Entopallium |
| H | Hyperpallium |
| Hp | Hippocampus |
| HVC | High vocal center |
| IH | Interculated hyperpallium |
| IN | Intercalated nidopallium |
| L2 | Field L2 |
| LAD | Lamina arcopallialis dorsalis |
| LMAN | Lateral magnocellular nucleus of the anterior nidopallium |
| LMD | Lamina mesopallialis dorsalis |
| LMI | Lamina mesopallialis intermediate |
| LMV | Lamina mesopallialis ventralis |
| LPS | Lamina pallio-subpallialis |
| LSt | Lateral striatum |
| M | Mesopallium |
| MD | Mesopallium dorsale |
| Mes | Mesencephalon |
| MSt | Medial striatum |
| MV | Mesopallium ventrale |
| N | Nidopallium |
| Na | Nidopallium anterior |
| Nc | Nidopallium caudale |
| P | Pallidum |
| Pa | Pallium |
| Pd | Pallidum dorsale |
| pIH | Posterior intercalated hyperpallium |
| POA | Preoptic area |
| PT | Posterior thalamus |
| Pv | Pallidum ventrale |
| R | Rhombencephalon |
| RA | Robust nucleus of arcopallium |
| SPa | Subpallium |
| St | Striatum |
| Std | Striatum dorsale |
| Stv | Striatum ventrale |
| V | Telencephalic ventricle |
| VT | Ventral thalamus |
| X | Area X |
Here we performed in-situ hybridization expression profiling to infer the developmental origin of the adult brain telencephalic subdivisions. We selected genes that were most enriched in different adult pallial subdivisions [COUP-TF2, EMX2, ER81, LHX9, PAX6, PPAPDC1A, ROR-β, SEMA6A], subpallial subdivisions [D1B, DLX1, DLX6, LHX8] or a combination of both [FOXP1, NKX2.1, GRIN2D], and a control gene with enrichment in the brainstem [OTX2]. We performed quantitative and qualitative profiling of five embryonic stages, two early post hatch stages, and adulthood of the zebra finch. We used sagittal sections, as it allowed us to assess regional expression continuities that are difficult to discover in coronal sections. Our findings suggest that different adult cell populations may begin in the embryo either below or above the lateral ventricle, and during development they wrap around the ventricle to expand in the counter territory to form a partial mirror image of gene expression surrounding the lateral ventricle and the adjacent lamina. The results influence hypotheses on vertebrate brain organization between birds and mammals.
MATERIAL AND METHODS
Animals
Zebra finch eggs were collected within 6 hours after females laid them, and incubated at 37-37.5°C and 45-50% humidity. We then opened eggs at 1-2 day intervals to characterize zebra finch developmental stages that correspond to Hamburger and Hamilton stages (HH) based upon embryonic morphology (Fig. 1A; n = 94 embryos total). Embryos used for gene expression analyses were from embryonic day 4 (ED4; n = 6), day 6 (ED6; n = 6), day 8 (ED8; n = 6), day 10 (ED10; n = 6), and day 12 (ED12; n = 6) of incubation. Post hatch day 1 (P1) hatchlings were collected from the incubator and two from the nest raised by their parents (n = 8 total). P6 animals (n = 6) were collected from the nest, and adult male animals (>120 days after hatch; n = 6) were collected from the cages in our aviary. All animal protocols were approved by the Duke University Institutional Animal Care and Use Committee (Protocol A133-11-05).
Figure 1.

Development of zebra finch embryos. A: Development of zebra finch embryo morphology and the corresponding Hamburger-Hamilton stages. Embryonic day (ED) indicates the days of the incubation. Each panel includes separated upper and lower limbs in right side, used for staging. Scale bar = 2 mm, except 0.5mm at ED2. B: Correlation between Hamburger Hamilton stages and zebra finch embryonic days until the hatch day (ED13). Each dot is the value of one embryo (n = 94). A little under half of the dots overlapped due to very similar values at each developmental stage. A reduced version of this plot up to ED4 was reported in Chen et al. (2012a).
Radioactive in situ hybridizations
The head of embryos and hatchlings were dissected and the skin removed; for adults the skull was also removed. All adult brain samples were male. All tissues were immediately frozen in tissue Tek OCT (Sakura, USA) and stored at −80°C. Radioactive in-situ hybridization was performed on serial tissue sections using a previously described protocol (Wada et al., 2004; Chen et al., 2012b). Heads of embryos and hatchlings were sagittally sectioned in five alternative series at 10μm thickness. Adult brains were sagittally sectioned in fifteen alternative series at 12μm thickness. Sections were fixed in 4% paraformaldehyde in PBS (pH = 7.4) and hybridized at 65°C with antisense 35S-UTP labeled riboprobes. Riboprobes were synthesized from zebra finch cDNA clones, which were either obtained from our songbird brain transcriptome cDNA collection (SBTD; http://songbirdtranscriptome.net/; Duke University;Wada et al., 2006), purchased from Clemson university genomics institute (CUGI; Replogle et al., 2008), or cloned using conserved primers against identified sequences in the zebra finch genome (Warren et al., 2010), respectively in the pFLC1, pBS SK+, or pGEM T-easy vectors. The clone sources, polymerase information and Genbank accession numbers or gene IDs of the cDNA fragments are listed in Table 2. The hybridized sections were first exposed to X-ray film (Biomax MR; Kodak) for 8 hours to 3 days depending on gene expression abundance, then dipped into autoradiographic emulsion (NTB2; Kodak), incubated for 4 to 16 days at 4°C, processed with Kodak developer (D-19) and fixer, and Nissl stained with cresyl violet acetate solution (Sigma, St. Louis, MO). Sections were cover slipped and sealed with Permount solution (Fisher Scientific). Dark field or bright field pictures were taken with an Olympus macrozoom microscope (MVX10) and images processed using Photoshop CS4 (Abode, CA).
Table 2. List of genes used in this study.
The zebra finch cDNA fragments are listed with their corresponding region of the gene (base pair), GenBank accession number or the clones used, the clone ID, database source, and polymerase for antisense and sense riboprobes.
| Gene | Molecular Function | GenBank ID | GenBank Accession Number of Clone ID |
Enrichment of Brain Regions |
Polymerase for Antisense/Sense Riboprobes |
|---|---|---|---|---|---|
| COUPTF2 | Chicken ovalbumin upstream promoter-TF2 |
AB542998.1 | AB542998 (1–545 bp) | Nidopallium | T7/SP6 |
| D1B | Dopamine receptor 1B |
AB372108.1 | AB372108 (1-625 bp) | Striatum | T7/SP6 |
| DLX1 | Distal-less homeobox 1 |
CK306520 | CUGI 32K10 | Subpallium | T3/T7 |
| DLX6 | Distal-less homeobox 6 |
EH120087 | SBTD 0063P0006H11 | Subpallium (Striatum; Pallidum; POA) |
T3/T7 |
| EMX2 | Empty spiracles homeobox 2 |
XM_002187442 |
HM633193 (170 bp) |
Pallial ventricular zone |
SP6/T7 |
| ER81 | Ets-related protein 81 | DV582566 | SBTD 0064P0002B03 | Arcopallium; Hippocampus |
T3/T7 |
| FOXP1 | Forkhead box P1 | NM_001076698 |
AY549152 (1544-1711 bp) |
Mesopallium; Striatum |
T7/SP6 |
| GRIN2D | NMDA receptor 2D | AB042759.1 | AB042759 (1-521 bp) | Subpallium (Striatum; Pallidum; POA); Midbrain; Brainstem |
SP6/T7 |
| LHX8 | LIM homeobox 8 | EH122589 | SBTD 0057P0002H01 | Subpallium (Striatum; Pallidum; POA) |
T3/T7 |
| LHX9 | LIM homeobox 9, zinc finger |
XM_002193946 | AB542999 (1-467 bp) | Arcopallium; Hippocampus |
SP6/T7 |
| NKX2.1 | NK2 homeobox 2.1 | XM_002199787 |
HM633194 (1-637 bp) |
Subpallium (Pallidum) |
T7/SP6 |
| OTX2 | Orthodenticle homeobox 2 |
DV583144 | SBTD 0064P0001D02 | Forebrain-midbr ain boundary |
T3/T7 |
| PAX6 | Paired box 6 | DV580106 | SBTD 0063P0027B10 | Pallial ventricular zone |
T3/T7 |
| PPAPDC1A | Phosphatidic acid phosphatase 2 domain containing 1A |
CK305549 | CUGI 27G14 | Hyerpallium; Nidopallium |
T3/T7 |
| ROR-ß | RAR-related orphan receptor beta |
XM_002190956 |
XM_002190956 (702-1102 bp) |
Pallial sensory neurons (L2, E, and B) |
SP6/T7 |
| SEMA6A | Semaphorin-6A | CK308635 | CUGI P45I15 | Hyperpallium; Nidopallium; Striatum |
T3/T7 |
Telencephalic phylo-gene expression trees and network analysis
To classify the brain areas by gene expression profiles within and across developmental stages, we quantified the amount of expression in each brain subdivision in images from either x-ray film or emulsion-dipped slides that were digitally converted to grayscale. Regions of interest were outlined with the highlighting tool of Image J 1.43u (NIH, MA), the average pixel density calculated in at least two adjacent sections, and adjacent background signal from the glass slide subtracted out. We chose the regions to quantify based on two criteria: 1) Topographic match of expression in adult with late embryonic and hatchling brain patterns [11 regions; A, Nc, Na, H, Hp, MD, MV, Pd, Pv, Std, Stv]; and 2) Quadrants of regions labeled without bias to the adult patterns as R1 through R9 around the lateral ventricle in early embryonic (ED4, ED6, and ED8) brains, as we were not confident based on the expression patterns alone of the predicted primordial adult regions. R1-R6 designated putative pallial regions and R7-R9 putative supallial regions. We did not include the primary sensory pallial regions (intercalated pallium) in the quantitative analyses, due to the higher uncertainty in locating them with gene expression markers in embryonic brains. We selected 14 genes for quantification: ER81, SEMA6A, GRIN2D, NKX2.1, COUP-TF2, FOXP1, LHX9, DLX6, D1B, ROR-β, LHX8, PPAPDC1A, DLX1, OTX2. We excluded PAX6 and EMX2 for the quantifications, as they were uninformative for adult brain expression patterns, being expressed almost exclusively in the ventricular zone.
The gene expression values were either linear normalized between 0-1 or discretized into three levels (0, 1, or 2; Jarvis et al., 2013). This scaling normalizes differences in expression intensity for different genes due to exposure time and also prevents genes with high abundance (strong signal) in one brain region from dominating the relationships in the quantitative analyses. We applied the values to the R program Pvclust (free software for statistical computing and graphics http://www.r-project.org/) to determine the relationships of brain regions within each developmental age. We used the bootstrapping hierarchical clustering method on Distance-Correlation values between brain regions, and calculated bootstrapping probability (BP) and the approximately unbiased probability (AU) of the nodes for each branch (Suzuki and Shimodaira, 2006). To generate tree figures of the brain relationships, we used the program FigTree v1.3.1 (http://tree.bio.ed.ac.uk/software/figtree/). The tree infers the phyletic relationship of brain regions with different cell types based upon gene expression profiles, and thus we call them “phylo-gene expression trees”.
To determine the relationships of brain regions across development, we constructed a network across ages using a simple regression model. First, to prevent stronger relationships within each age from biasing and dominating the relationships of a network over those between ages, we merged the linear normalized values of two regions together that had the highest expression vector correlation of all 14 genes within each age at r > 0.7 (Pearson correlation). This threshold value was determined empirically from the adult data of similarities within two locations of the same brain subdivision. We then further normalized the data to eliminate gene expression differences that were enriched overall in one stage over another, by estimating a stage-specific component of gene expression and then used regression to eliminate that source of variation. This procedure made gene expression across stages more comparable, but very similar results were obtained when this step was omitted (data not shown). After normalization, we built a linear model explaining gene expression in each region of the current stage of interest as a linear combination of regions at previous stages. Because of the changing patterns of expression across 7 stages and 14 genes, we only considered the 4 previous stage regions most correlated (Pearson) to the region of interest using the following equation: RS ~ X1R1s-1 + X2Rs-1 + X3Rs-1 + X4Rs-1, where R is the current region of interest, S is the current stage, S-1 is the previous stage, R1 … R4 are the regions with the highest correlation (Pearson) to R, and X1 … X4 are the estimated coefficients. The regression ignores the region labels, so that a particular region at one stage will only match that same annotated region at the previous stage if the gene expression vectors are significantly related. An edge was drawn from the brain region of the late stage to the early stage if the two were significantly related (p < 0.05) based on the linear model. The network relationships were visualized with Cytoscape v2.8.2 (Smoot et al., 2011), which we called an “anatomical expression network”.
Figure preparation
Figures for publication were prepared similarly as in Jarvis et al (2013). The digitized microscope images were adjusted in Adobe Photoshop, the ‘Levels’ function used to expand the image information within the 250-pixel range, and then color adjusted using the “Color Balance’ function to remove red darkfield reflectance from the Nissl stain overshadowing the white silver grain mRNA signal. The background outside of the tissue was cut out in order to help visualize the brain boundaries. All images of the same experiment were adjusted similarly to avoid creating artificial differences within a serial sectioned set of images of the same gene.
RESULTS
Zebra finch embryonic stages
In order to address our hypothesis on development of avian brain subdivisions (Jarvis et al., 2013) in songbirds, we first needed to determine the zebra finch embryonic stages relative to established chicken stages (Hamburger and Hamilton, 1992). We chose the zebra finch due to it being a popular animal model for vocal learning with parallels to human speech (Jarvis, 2004; Zeigler and Marler, 2008). Although a classification of some zebra finch embryo stages was previously reported at around the time we began our project (Charvet and Striedter, 2009), that study did not cover the full range of development and differences could occur under different incubation conditions. Thus, we characterized zebra finch embryonic stages under our incubation conditions, using standard limb morphology characteristics, egg teeth, eyelid positions, and feathers (Fig. 1A). We found that the early zebra finch hatching stages corresponded to late chicken embryonic stages (Fig. 1B). Based on the segregation of different brain divisions (e.g. telencephalon, midbrain, and cerebellum) and subdivisions (populations of cells within the divisions), we chose to study comparative gene expression profiles in animals from embryonic days 4, 6, 8, 10, 12, to P1, corresponding respectively to Hamilton and Hamburger embryonic developmental stages HH24 to 46. We also performed expression analyses on a subset of genes in animals at P6 for patterns that differed between P1 and adults, and included expression analyses of all genes in adults. Although most past studies used frontal sections to analyze forebrain development, we used sagittal sections which we found gave a novel perspective on the anterior to posterior forebrain developmental organization around the ventricles.
The primordial songbird pallium and subpallium
In order to track adult brain anatomical expression profiles back to embryonic development, we next needed to identify the primordial pallium and subpallium at the earliest developmental stage studied, ED4. We found that similar to early chicken HH26 and mouse ED12 embryos (Garcia-Lopez et al., 2008), zebra finch ED4 embryos contained a dorsal ventricular zone region in the telencephalic neural tube (upside down U shaped label in sagittal sections) that expressed high levels of early pallial-specific markers, the transcription factors EMX2 (Fig. 2A) and PAX6 (Fig. 2B). There were some differences between genes. EMX2 had a gradient of lower expression into the anterior primordial subpallium, whereas PAX6 had sharp boundaries with the subpallium. We followed the developmental expression profiles into adulthood and found that enriched expression levels of both genes remained mostly restricted to the ventricular zone of the telencephalon (Fig. 3). However, for EMX2, from ED6 to P1, there was a posterior region of labeled cells that emanated from the caudal lateral ventricle near the pallium-subpallium boundary (Fig. 3A2-3A6; yellow arrows), which has been proposed to be migrating cells moving into the anterior pallium (Cobos et al., 2001; Medina and Abellan, 2009). In adults, EMX2 expression was mainly enriched in the dorsal part of the pallial ventricular zone in adults (Fig. 3A7) indicating that expression was shut down in the ventral pallial ventricular zone at an earlier age. For PAX6, an isolated region of the caudal striatum had high expression in adults that could be traced back to ED10 (Fig. 3B4-3B7; yellow arrowheads). In adults, both genes had lower expression throughout the ventricular zone relative to embryonic animals, suggesting a reduced, but still present role of these genes.
Figure 2.

Expression of gene markers in the primordial pallium and subpallium in sagittal sections at medial telencephalon levels of ED4 zebra finch embryos. Rostral is oriented to the right. A-B: EMX2 (A) and PAX6 (B) are expressed continuously in the pallium (Pa). Note a decreased gradient of EMX2 and PAX6 expression from the anterior pallium to the anterior subpallium. C: NKX2.1 is expressed in the subpallium (SPa). D: LHX8 is expressed in a superficial layer of ventral subpallium. E-F: DLX1 (E) and DLX6 (F) are expressed in the subventricular zone of the ventral subpallium. Note that DLX1 and DLX6 expression overlaps with EMX2 expression in an anterior portion of the subpallium. Gray axes show the orientation of each section (D: dorsal; V: ventral; A: anterior; P: posterior). White, mRNA signal. Red, cresyl violet label (Nissl stain). Scale bar = 500 μm.
Figure 3.


Time series expression of pallial ventricular zone genes. The panels from right to left across each page are sagittal sections from ED4 to adult. Right is oriented rostrally. A-B: EMX2 (A) and PAX6 (B) are expressed strongly in the dorsal ventricular zone (white arrowheads) through all development stages. Yellow arrow points to junction between the posterior ventricle location and brain where EMX2 cells are thought to migrate out of; yellow arrow head points to dissociated cells for PAX6. C: Brightfield Nissl stained sections of in-situ hybridizations with EMX2 showing the Nissl-defined regions examined in this study. The magnifications of panels C1-C2 are different, in order to highlight the regions of interest. Scale bar = 500 μm, except 2 mm in adult panels.
We found, also similar to chicken and mouse (Bardet et al., 2010), a ventral region of the zebra finch telencephalic zone at ED4 that expressed the subpallial marker transcription factors NKX2.1, LHX8, DLX1, and DLX6 (Fig. 2C-F). NKX2.1 was expressed throughout the subpallium, whereas LHX8, DLX1, and DLX6 were restricted to a thin layer in the superficial ventral part of the subpallium. The developmental expression pattern of these genes into adulthood was not restricted to the ventricles, but mainly the subpallium (discussed in subpallium section below).
Together, these findings suggest a well-conserved pattern of expression from early embryonic stages to adulthood, and identify primordial pallial and subpallial regions during all embryonic stages from which we can anchor specific subdivision markers to test our hypothesis. In the remainder of this study, we first present our quantitative analyses within and across each developmental stage, then a detailed qualitative analysis of the developing pallium and subpallium subdivision profiles, and end with possible discovery of an embryonic appearance of the motor song production nucleus of the arcopallium.
Quantitative brain phylo-gene expression trees analyses within ages reveal shared relationships of regions above and below the ventricle during development
To conduct a quantitative assessment of the brain expression profiles within each age, we applied our brain phylo-gene expression approach on 14 genes, which had defined adult brain subdivisions, in 9 (ED4-ED8) to 11 (ED10-P1) embryonic brain regions (Tree results in Figs. 4-5; Gene expression profiles in Figs. 7-15 and 18). That is, each brain region measured at each age was represented by a vector of expression levels for the 14 genes. The difference in the number of brain regions measured for different developmental ages was because we could readily locate brain subdivisions that resembled the adult forms back to ED10, and thus labeled those regions with the presumed adult names as a hypothesis, but we could not readily locate such regions from ED4 to ED8 as the brain topography was more different than adults, and thus for these earlier ages we measured gene expression in 9 consecutive regions surrounding the ventricle, as a discovery approach (see methods; Fig. 4H-J). This means that the numbered regions have the possibility of not corresponding to each other for each age from ED4-ED8. In selecting the regions, we noted that nearly all-pallial markers had at least two expression domains below and above the lateral ventricle with lags in expression time for some of them (shown for all 14 genes in Figs. 7-9 and 18). Further, these dorsal and ventral pallial regions had points of anatomical continuities with each other seen in medial to lateral sagittal sections (shown for canonical subdivision specific genes in Figs. 10-15).
Figure 4.

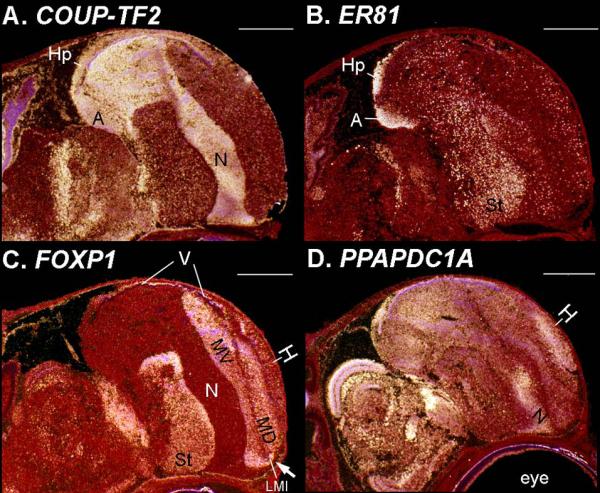
Phylo-gene expression tree analyses of telencephalic organization at different development stages. A: Phylo-gene expression tree and heat map of adult brain regions (y-axis) for 14 genes (x-axis). In the tree, similar colors indicate shared expression profiles between brain areas, such as yellow for the hippocampus and arcopallium, with the topography indicated in the diagram in the upper left of an adult avian sagittal brain section. In the heat map, the color of the boxes indicates relative expression levels (red, higher than the average for that region relative to other regions; blue, lower than the average). The bootstrap probability (BP; green) values and the approximately unbiased probability (AU; red) values are listed in each branch, as well as distances at each node. A small correlation distance between areas indicates a high similarity in brain gene expression patterns (= 1-correlation values). The scale bar below the phylo-gene expression tree shows the branch distance. B-G: Phylo-gene expression trees for the same genes at (B) P1, (C) ED12, (D) ED10, (E) ED8, (D) ED6, and (G) ED4. H-J: Sagittal sections using the COUP-TF2 pattern to show the numbered regions (R1-R9) we measured telencephalic gene expression at (H) ED8, (I) ED6, and (J) ED4. Scale bars = 500μm.
Figure 5.

Telencephalic phylo-gene expression trees from different methods and numbers of genes. A-F: Comparison of trees generated with the continuous (A, D), normalized (B, E) or discretized (C, F) gene expression data at two example ages, adult and ED10. G-J: Adult trees with fewer genes than 14, minus (G) OTX2 (H) OTX2, DLX1, and SEMA6A, (I) OTX2, DLX1, SEMA6A, and LHX8, or (J) OTX2, DLX1, SEMA6A, LHX8 and ER81.
Figure 7.


Time series expression of arcopallial and hippocampal enriched genes. A-B: Medial and lateral sections showing the LHX9 expressing region around the caudal ventricle that forms the hippocampus (white arrows) dorsal medially and the arcopallium (yellow arrows) ventral laterally. There is also a gradient of lower expression in the caudal nidopallium adjacent to the arcopallium (B7, white arrowhead). C-D: Medial and lateral sections of ER81 expression, showing similar regions. Although the final adult ER81 pattern is similar to LHX9, the trajectory of the developmental expression profile is different. The arrows in panels C2 and D2 points to such a transient dorsal ventricle expression zone of ER81 cells; the white arrowheads in D6 and D7 points to the lack of high expression in the anterior arcopallium. Scale bar = 500 μm, except 2 mm in adult panels.
Figure 15.

Medial-lateral anatomical profiles of adult pallial enriched genes at P1. Sagittal brain sections of zebra finch embryos from medial (top) to lateral (bottom) shows development of (A) LHX9, (B) COUP-TF2, (C) PPAPDC1A, (D) FOXP1, and (E) ROR-β gene expression. Note that PPAPDC1A dorsal primordial hyperpallium region starts to show decreased FOXP1 expression, but the majority is still mixed in with the FOXP1 dorsal mesopallium-like region (yellow arrows); the FOXP1 ventral mesopallium region is more similar to its adult form and does not overlap with PPAPDC1A. Also seen is a weak expansion of the ROR-β primary sensory intercalated pallium zones (white arrowhead).
Figure 18.


Time series expression of subpallial enriched genes. A: DLX6 expression showing pallidal (white arrowhead) and striatal (white arrow) locations from ED4 to adulthood, with reduced expression in the adult pallidum. DLX6 also has some expression in caudal nidopallium (yellow arrow) and the thalamus from ED6 to P1, but is reduced in these regions in adults. B: D1B expression at high levels mainly in the striatum from ED8 onward. C: LHX8 expression at high levels in the pallidum (white arrowhead) and striatum from ED4-P1 (C1-7), and then down regulated in the striatum of adults. D: DLX1 shows a migrating pattern of expression from the primordial pallidum at ED4 (D1), to the striatum, then nidopallium and arcopallium, and then finally enrichment in the hippocampus in adulthood (D7). E: NKX2.1 shows a migrating, spreading pattern from the primordial pallidum at ED4 (E1, white arrowhead), to the striatum (white arrow), to ventral pallial regions, and finally to dorsal pallium regions in adults, except for the mesopallium. F: OTX2 shows high levels in the brainstem from ED4 (F1) to adulthood (F7), demarcating the boundary between the telencephalon and thalamus (white arrows). Scale bar = 500 μm, except 2 mm in adult panels.
Figure 9.


Time series expression of intercalated pallial enriched genes. A-B: Medial and lateral sections of ROR-β expression, showing higher levels in the primordial sensory thalamic input neurons of the telencephalon (L2, E, B, and IH) from ED8 onward (A3-7 and B3-7, yellow arrowheads). High expression is also seen in parts of the dorsal thalamus (DLM region), in the mesopallium, and parts of the ventral ventricular zone between ED6-ED8 (A2-3 and B2-3, white arrows). C: GRIN2D expression with a similar pattern for the intercalated pallium regions (yellow arrows), but without high expression in the mesopallium, and instead higher expression in the pallidum (white arrowhead) and brainstem. Scale bar = 500 μm, except 2 mm in adult panels.
Figure 10.

Medial-lateral anatomical profiles of adult pallial enriched genes at ED4. Sagittal brain sections of zebra finch embryos from medial (top) to lateral (bottom) shows development of expression of the pallial subdivision defining genes of (A) LHX9, (B) COUP-TF2, (C) PPAPDC1A, (D) FOXP1, and (E) ROR-β. (F) NKX2.1 is shown for comparative purposes for the location of the subpallium (SPa). Note only LHX9 and COUP-TF2 show high expression levels at this age, where the arcopallium (A) and hippocampus (Hp) begin.
Using the above approach, first we confirmed that phylo-gene expression tree analyses on the 14 selected genes on the more reduced set of 11 brain regions in the adult resulted in trees that were consistent with the analyses of 50 genes and 23 brain regions in our companion study (Jarvis et al., 2013). Like that study, we found that with these 14 genes, in the adult pallium, the dorsal and ventral mesopallium (MD and MV), the nidopallium and hyperpallium (N and H), the arcopallium and hippocampus (A and Hp), each above and below the ventricle and adjacent lamina mesopallium intermediate (LMI) were more similar to each other than they were to any other brain subdivision (Fig. 4A). In the subpallium, the dorsal and ventral striatum (Std and Stv) and the dorsal and ventral pallidum (Pd and Pv) were each more similar to each other than they were to any other brain subdivision (Fig. 4A; according to our revised nomenclature). The pallial regions also separated from the subpallial regions. These relationships held regardless of whether non-normalized, normalized, or discretized values were used (Fig. 5A-C). The normalized values resulted in higher bootstrap (BP) and approximately unbiased (AU) probabilities; but even for BP below 70 and AU below 95 the tree structure was similar. Removal test of one or more genes showed the tree structure was relatively stable until we went below 10 or less genes (Fig. 5G-J). We believe that the overall stability of the tree structure with fewer genes than in our adult study (14 vs 50) occurred because we included fewer brain regions (11 vs 23). Thus, this set of 14 genes was sufficient to reliably quantify stable relationships of the quantified brain regions.
With the adult tree structure confirmed, we went backwards from P1 to ED10, and found similar strongly supported relationships with the regions we hypothesized to be the adult precursors (Fig. 4B-D). A difference was that the region we proposed to be hyperpallium and nidopallium in the embryos for these ages based upon adult topography and gene expression, split up, where our proposed embryonic hyperpallium grouped closer with the two mesopallium regions (MV and MD) at all three ages, and our proposed nidopallium grouped closer with the arcopallium and hippocampus (Fig. 4B-D). We believe this is due to mixed cellular ancestry, as highlighted in our network analyses below. The trees from ED4 to ED8 indicated shared relationships as in the older embryos and adults, but the topology of the relationships with our numbering across ages was not consistent (Fig. 4E-G) as expected. Importantly, though, we noted that unlike ED10-P1, where regions above and below the ventricle had shared relationships as in adults, from ED4-ED8, the shared relationships were mostly local (closer R numbers to each other).
Quantitative temporal networks analyses across ages suggest origins of adult brain subdivisions
To determine the relationships across ages, we performed a linear network analyses using the same expression values applied to the tree approach (see methods). We first merged up to two regions at regression r > 0.7 (p < 0.05) within each age to reduce strong attraction of regions within one brain subdivision over shadowing relationships across time. This merging resulted in identifying and confirming supported similarities of gene expression profiles within each age group, including the relationships of our hypothesized adult and embryonic dorsal and ventral mesopallium (MD and MV), the nidopallium and hyperpallium, the arcopallium and hippocampus, the two different striatal regions (Std and Stv), and the two pallidal regions (Pd and Pv), from ED10 onward (Fig. 6). Before ED10, regions merged as well, which was expected considering that we separated them into segments that had shared expression profiles. However, the merged regions did not always have the same-labeled numbers, consistent with the numbering not necessarily being the same region across ages (Fig. 6).
Figure 6.

Linear regression, anatomical expression network of avian telencephalic development. Abbreviated names separated by an “_” in each circle are the regions that have significantly similar expression profiles within each age (correlation > 0.7; p < 0.05). The thickness of the line between developmental stages is scaled to the correlation of the expression profiles between ages. The colors of the circle represent each developmental stage. R1-R9 designate our numbered divisions of the early embryonic telencephalon as in Figure 4E-G.
Next we used the merged values to generate networks with the linear method blind to brain region identity. We found that the hypothesized subpallial regions all linked the strongest together in time and not to pallial regions, where they began as one merged region we labeled R5 and R7 at ED4, followed by R7 and R8 from ED6 to ED8, that then split into striatal and pallidal subdivisions by ED10 and stayed that way into adulthood (Fig. 6). The more dorsal R7 region (at ED6-ED8) predominantly gave rise to the striatum and the more ventral R8 region gave rise to the pallidum. Within the pallium, R2 and R3 in the embryonic caudal pallium had the strongest links with the adult hippocampus and arcopallium from ED4 onward, even though R6 was in the topographic position of the arcopallium containing high levels of COUP-TF2 expression (Figs. 4H-J and 6). The adult nidopallium did not show links to regions before ED10, but it did approach statistical significance (p < 0.07) for R4 and R5 in the pallium below the ventricle at ED8 (data not shown). R1 in the anterior dorsal pallium above the ventricle starting at ED8 was most strongly associated with the dorsal and ventral mesopallium combined (MD and MV) into adulthood, but in a transient relationship with the hyperpallium at P1. On either side of P1, the hypothesized hyperpallium was partly linked in the network with the anterior nidopallium. There was not a link of the pallidal domains from P1 to adulthood, which we think was weakened by the migrating patterns of subpallial GABAergic cells into the striatum and pallium (described in supallial section below).
Overall, both the phylo-gene expression tree and the network analyses indicate that adult brain subdivisions can have either local or mixed embryonic ancestry, with dual relationships to regions above and below the lateral ventricle. We next asked how such mixed and dual relationships could arise. To do answer this question, we analyzed the temporal-anatomical patterns of the canonical markers that defined the adult subdivisions in the chronological order that their expression profiles appeared in the embryo (Table 3), starting with pallial regions and designating the R1-R9 regions by their adult inferred regions according to the network analyses.
Table 3. Summary of enriched gene expression profiles in each developmental stage.
Black text, stable enriched gene expression profile found into adulthood. Red text, transient enriched gene expression profiles that do not last into adulthood. N/P: Not present.
| Cell population | ED4 | ED6 | ED8 | ED10 | ED12 | P1 | Adult | ||
|---|---|---|---|---|---|---|---|---|---|
| Ventricle zone | EMX2 | EMX2 | EMX2 | EMX2 | EMX2 | EMX2 | EMX2 | ||
| PAX6 | PAX6 | PAX6 | PAX6 | PAX6 | PAX6 | PAX6 | |||
|
| |||||||||
| Pallium | Hippocampus | COUP-TF2 | COUP-TF2 | COUP-TF2 | COUP-TF2 | COUP-TF2 | COUP-TF2 | - | |
| LHX9 | LHX9 | LHX9 | LHX9 | LHX9 | LHX9 | LHX9 | |||
| ER81 | ER81 | ER81 | ER81 | ||||||
| DLX1 | DLX1 | DLX1 | |||||||
|
| |||||||||
| Arcopallium | COUP-TF2 | COUP-TF2 | COUP-TF2 | COUP-TF2 | COUP-TF2 | COUP-TF2 | COUP-TF2 | ||
| LHX9 | LHX9 | LHX9 | LHX9 | LHX9 | LHX9 | LHX9 | |||
| ER81 | ER81 | ER81 | ER81 | ||||||
| DLX1 | DLX1 | - | |||||||
| NKX2.1 | |||||||||
|
| |||||||||
| Nidopallium | Caudal | N/P | COUP-TF2 | COUP-TF2 | COUP-TF2 | COUP-TF2 | COUP-TF2 | COUP-TF2 | |
| PPAPDC1A | PPAPDC1A | PPAPDC1A | PPAPDC1A | PPAPDC1A | PPAPDC1A | ||||
| ER81 | - | - | - | - | |||||
| DLX1 | DLX1 | DLX1 | DLX1 | - | |||||
| NKX2.1 | NKX2.1 | NKX2.1 | NKX2.1 | ||||||
| SEMA6A | SEMA6A | ||||||||
|
| |||||||||
| Anterior | N/P | N/P | COUP-TF2 | COUP-TF2 | COUP-TF2 | COUP-TF2 | COUP-TF2 | ||
| PPAPDC1A | PPAPDC1A | PPAPDC1A | PPAPDC1A | PPAPDC1A | |||||
| SEMA6A | SEMA6A | SEMA6A | SEMA6A | ||||||
| ER81 | ER81 | ER81 | - | ||||||
| NKX2.1 | NKX2.1 | NKX2.1 | |||||||
|
| |||||||||
| Hyperpallium | N/P | N/P | N/P | PPAPDC1A | PPAPDC1A | PPAPDC1A | PPAPDC1A | ||
| SEMA6A | SEMA6A | SEMA6A | SEMA6A | ||||||
|
| |||||||||
| Mesopallium | Dorsal | N/P | N/P | FOXP1 | FOXP1 | FOXP1 | FOXP1 | FOXP1 | |
| PPAPDC1A | PPAPDC1A | PPAPDC1A | - | ||||||
| ROR-ß | ROR-ß | ROR-ß | - | ||||||
| SEMA6A | SEMA6A | SEMA6A | - | ||||||
|
| |||||||||
| Ventral | N/P | N/P | N/P | FOXP1 | FOXP1 | FOXP1 | FOXP1 | ||
| ROR-ß | ROR-ß | ROR-ß | - | ||||||
|
| |||||||||
| Intercalated pallium | N/P | N/P | GRIN2D | GRIN2D | GRIN2D | GRIN2D | GRIN2D | ||
| ROR-ß | ROR-ß | ROR-ß | ROR-ß | ROR-ß | |||||
| NKX2.1 | |||||||||
|
| |||||||||
| Subpallium | Striatum | NKX2.1 | NKX2.1 | NKX2.1 | NKX2.1 | NKX2.1 | NKX2.1 | NKX2.1 | |
| DLX6 | DLX6 | DLX6 | DLX6 | DLX6 | DLX6 | ||||
| ER81 | ER81 | ER81 | ER81 | ER81 | - | ||||
| LHX8 | LHX8 | LHX8 | LHX8 | LHX8 | - | ||||
| DLX1 | - | - | - | - | - | ||||
| D1B | D1B | D1B | D1B | D1B | |||||
| FOXP1 | FOXP1 | FOXP1 | FOXP1 | FOXP1 | |||||
|
| |||||||||
| Pallidum | LHX8 | LHX8 | LHX8 | LHX8 | LHX8 | LHX8 | LHX8 | ||
| NKX2.1 | NKX2.1 | NKX2.1 | NKX2.1 | NKX2.1 | NKX2.1 | NKX2.1 | |||
| DLX6 | DLX6 | DLX6 | DLX6 | DLX6 | DLX6 | - | |||
| DLX1 | DLX1 | - | - | - | - | - | |||
| ER81 | ER81 | ER81 | - | - | - | ||||
| GRIN2D | GRIN2D | GRIN2D | GRIN2D | GRIN2D | GRIN2D | ||||
Qualitative temporal-anatomical analyses of pallial development reveal continuities around ventricle folds
Development of arcopallium and hippocampus
In our companion study (Jarvis et al., 2013), we found that core portions of the arcopallium had the most similarities with the hippocampus. Consistent with this finding, our quantitative analyses in this study linked the arcopallium and hippocampus mainly to R3 around a ventricle fold of the caudal pallium (Figs. 4 and 6). The expression markers for these regions, the LHX9 and ER81 transcription factors, already appeared at ED4. For LHX9, there was high expression throughout the pallial ventricular zone that overlapped with the EMX2 and PAX6 expression region (compare Fig. 7A1, B1 to Fig. 3A1, B1). But from ED6 onward a region of high continuous LHX9 expression was restricted around the caudal-lateral ventricle fold, with the dorsal part (R3) later becoming the hippocampus (Fig. 7A2-A7) and the ventral part (R6) later becoming the arcopallium (Fig. 7B2-B7). This continuity between hippocampus and arcopallium LHX9 expression could be easily seen in medial to lateral sections from ED6 to P1 (Figs. 11A-15A; brightfield section example in Fig. 16A). Sometime between P1 to adulthood, LHX9 expression was shut down in the anterior arcopallium nucleus (Fig. 7B6-B7). LHX9 expression in other brain areas, such as the dorsal thalamus, optic tectum, was consistent throughout embryonic development to adulthood (Fig. 7A-B).
Figure 11.

Medial-lateral anatomical profiles of adult pallial enriched genes at ED6. Sagittal brain sections of zebra finch embryos from medial (top) to lateral (bottom) shows development of (A) LHX9, (B) COUP-TF2, (C) PPAPDC1A, (D) FOXP1, and (E) ROR-β gene expression. Note that PPAPDC1A begins to show high expression in the ventral-lateral pallium, where the caudal nidopallium (Nc) appears to begin.
Figure 16.

Examples of continuities of expression around the lateral ventricle at P1. Gray arrows indicate the ventricular enclosure area. Black arrows and arrow heads points the gene expression in one side and the other side of the ventricle. A: Sagittal brain section of LHX9 expression around the posterior lateral ventricle fold indicates where there is continuity surrounding the ventricle. B: FOXP1 expression from the same embryo around the anterior ventricle fold that forms the two halves of the mesopallium. C: NKX2.1 expression around the ventral lateral ventricle in the location of the striatum. D: Lower magnification of NKX2.1 expression shows high levels around the ventral posterior-medial fold in the ventricle (c) for the pallidum and medial septum; this image also shows the relative positions of other ventricle folds (a and b). Each box with the lower case letters (a, b and c) indicates the relative location of each panel. E: Darkfield image of FoxP1 expression at P6 showing that the ependymal epithelial cells in the ventricle no longer exist in the LMI lamina between MD and MV after ventricle seals up. F: Brightfield image of thicker sections (40 μm) in adult showing the difference in the ventricular surface ependymal cells and the LMI lamina, but still continuity between the two. Scale bars = 200 μm (A-D) and 500 μm (E-F).
ER81 expression during embryonic development was not as topologically consistent (Fig. 7C-D). Instead, at ED6, high levels of ER81 expression appeared first in a layer of cells within the dorsal pallium and in cluster of cells within the primordial basal ganglia (Fig. 7C2 and 7D2). By ED10, expression was still high in the primordial striatum and pallidum, but there were scattered labeled cells in the dorsal pallium and in the primordial nidopallium (Fig. 7D3). ED10 was the first age we could see signs of higher levels of ER81 in the hippocampus and ED12 was the first signs in the arcopallium, both contained within the LHX9-labelled region (Fig. 7B4-5 and 7D4-5). But there were still scattered labeled cells in the basal ganglia (Fig. 7D5). This pattern was still present in P1 animals (Fig. 7C6-D6). By P6, there was a greater enrichment of expression in the arcopallium and hippocampus with decreasing levels in the basal ganglia (Fig. 17B). By adulthood, ER81 label was almost entirely enriched in the arcopallium (except anterior arcopallium form P1 onward), hippocampus and a part of the medial nidopallium (Fig. 7D7). These findings suggest that ER81 does not label a specific embryonic brain subdivision developmentally, but labels cells with either transient expression or that migrate. The latter hypothesis is consistent with previous developmental studies suggestion of ER81 in the mammalian cortex and its eventual enriched expression in layer V cells (Yoneshima et al., 2006; Teissier et al., 2010). Together the above findings suggest that the arcopallium and hippocampus develops early around the caudal pole of the lateral ventricle, potentially with ER81 cells migrating in from other pallial regions, or turning on later during development.
Figure 17.
Pallial subdivision defining genes at P6. A: ER81 at P6 is expressed in hippocampus and arcopallium, but scattered labeled cells are found in the pallidum, striatum, and non-mesopallium parts of the pallium, approaching the pattern found in adulthood. B: COUP-TF2 expression in the nidopallium, arcopallium, and hippocampus. C: FOXP1 expression with now clearly defined dorsal and ventral mesopallium label around the LMI lamina and ventricle, separate from the hyperpallium. White arrow, continuity between dorsal and ventral mesopallium. D: PPAPDC1A starts to show more enriched expression in anterior parts of the hyperpallium and nidopallium. Scale bar = 1mm.
Development of Nidopallium and Hyperpallium
In our companion study (Jarvis et al., 2013), we found that the adult hyperpallium (formally named hyperpallium apicale; Reiner et al., 2004; Jarvis et al., 2005) had very similar molecular and Nissl profiles as the adult nidopallium (minus the sensory input fields of L2, E, B, and IH). These two regions showed continuity of expression at the anterior pole of the lateral ventricle, but only when the ventricle was in the posterior part of the cerebrum. An exception was the COUP-TF2 nuclear receptor transcription factor, which was enriched in both the nidopallium and arcopallium more so than in the hyperpallium. Based on these and other findings, we had hypothesized that the hyperpallium and nidopallium might derive from the same area of the embryo, forming as a continuous domain that wraps around the lateral ventricle, with later differentiation of COUP-TF2; or that the hyperpallium and nidopallium develop separately, but with similar molecular profiles (Jarvis et al., 2013). Our quantitative analyses of the embryonic expression profiles in this study was consistent with either hypothesis, in that they linked the adult hyperpallium and nidopallium to regions above and below the ventricle close to significance from ED8 onward, but there was also suggestion of mixed ancestry with the mesopallium (Fig. 4). To test these hypotheses, we analyzed the temporal-anatomical profile of their strongest markers: the COUP-TF2 transcription factor, the PPAPDC1A phosphatase, and the SEMA6A axon guidance receptor.
For COUP-TF2, an adult-like nidopallium-shaped region that overlapped with a PPAPDC1A region and not with LHX9 in the arcopallium was seen earliest in the ventral pallium at ED6 (Figs. 8A2-A7, 8B2-B7 and 11A-C). This nidopallium-like COUP-TF2 and PPAPDC1A labeled region appeared to expand into a bulge in the lateral ventricle as part of the DVR from ED6 to ED8 and then remained that way into adulthood (Fig. 8A2-B3, white arrows). From ED10 onward, COUP-TF2 was also highly expressed in the anterior part of the third ventricle that later become the boundary between the optic tectum and thalamus (Fig. 8A4-A7, yellow arrows). We did not find a COUP-TF2 region at any age in the dorsal pallium above the lateral ventricle where the hyperpallium was expected to form (Figs. 8A, 10B-15B, and 17A).
Figure 8.


Time series expression of nidopallial, hyperpallial, and mesopallial enriched genes. A: COUP-TF2 with strong and consistently enriched expression in the nidopallium, arcopallium, and hippocampus, through embryonic development until adulthood. B:PPAPDC1A expression in the primordial nidopallium (B3, white arrow) and the hyperpallium (B4, white arrowhead). C: SEMA6A expression with a less consistent but overlapping profile (arrows) as PPAPDC1A. D: FOXP1 with consistent expression in the primordial mesopallial regions (white arrows) and striatum (yellow arrows) from ED8 onward (D3-D7). Scale bar = 500 μm, except 2 mm in adult panels.
In contrast, the PPAPDC1A region that overlapped with COUP-TF2 expression at ED6 in the ventral pallium had cells that extended from it dorsally at the anterior pole of the ventricle by ED8 at the same location where COUP-TF2 expression stopped (Fig. 8A2-3, 8B2-3). By ED10, this continuous region of PPAPDC1A expression extended and wrapped around the ventricle to reach the dorsal pallium (Fig. 8B4). This continuity between the primordial nidopallium and hyperpallium could be readily seen in medial to lateral sections at all ages from ED8 to P1, but with an intermediate bridge region of slightly lower PPAPDC1A expression (Figs. 12C-15C, white arrows).
Figure 12.

Medial-lateral anatomical profiles of adult pallial enriched genes at ED8. Sagittal brain sections of zebra finch embryos from medial (top) to lateral (bottom) shows development of (A) LHX9, (B) COUP-TF2, (C) PPAPDC1A, (D) FOXP1, and (E) ROR-β gene expression. Note that PPAPDC1A expression begins to migrate into the dorsal pallium above the ventricle, FOXP1 begins to show high expression in the dorsal pallium where the primordial dorsal mesopallium appears to begin (yellow arrows), and ROR-β starts to label the primary sensory intercalated pallium zones in the most anterior part of the telencephalon (white arrowhead).
Although SEMA6A labeled the adult nidopallium and hyperpallium [as well as the anterior arcopallium and lateral striatum (Fig. 8C7; Jarvis et al, 2013)], like ER81, its expression topologically changed locations and was thus more difficult to interpret (Fig. 8C). Nevertheless, wherever there was enriched PPAPDC1A expression in the embryonic pallial regions, the same region had high SEMA6A expression (Fig. 8B-C). These findings suggest that the reason that the nidopallium and hyperpallium are similar to each other is that are continuous with each other around the ventricle, but with still some molecular differences that allows them to be distinguished during development.
Development of Mesopallium
In our companion (Jarvis et al., 2013) and other studies (Haesler et al., 2004; Mouritsen et al., 2005; Feenders et al., 2008; Horita et al., 2010), the two regions revised to hyperpallium dorsale and mesopallium in the 2004-2005 nomenclature (Reiner et al., 2004; Jarvis et al., 2005) were proposed instead to be two subdivisions of the mesopallium on either side of the lateral ventricle. Evidence that they might be continuous was that the two domains had a thin region of continuous gene expression in the anterior pole of the LMI lamina that was once the lateral ventricle space during development. Our quantitative analyses in this study linked the two adult regions (MD and MV) to one region above the embryonic ventricle that we labeled R1 at ED8 (Fig. 6). This link was best revealed by the marker that we used to identify the mesopallium, the FOXP1 transcription factor.
From ED4-ED6, there was no detectable differential high expression of FOXP1 in the telencephalon (Figs. 8D1-2, 10D, 11D). By ED8, high differential FOXP1expression occurred in the pallium in a strip of cells in R1 above the medial half of the ventricle (Figs. 8D3 and 12D1-3; located according to EMX2 in Fig. 3A3). High expression also appeared in the embryonic dorsal thalamus and striatum as in adults. The dorsal pallial strip extended into the anterior pole of the telencephalon above a proliferative zone where one would expect to find adult hyperpallium dorsale in the 2004-2005 nomenclature (Reiner et al., 2004) or dorsal mesopallium of our revised nomenclature (Jarvis et al., 2013). There was no other pallial brain region at ED8 with high FOXP1 expression, including not in the eventual location of the ventral mesopallium below the ventricle (Fig. 12D1-D4). By ED10, the anterior part of this dorsal pallial region proliferated (enlarged) and began to extend into the DVR in front of the ventricle (Figs. 8D4 and 13D). By ED12, the anterior part of the FOXP1 region wrapped around the ventricle and turned into a caudal portion of the DVR (Figs. 8D5, 14D, and 16B) in a location where one would find adult mesopallium of the 2004-2005 nomenclature (Reiner et al., 2004) or ventral mesopallium of our revised nomenclature (Jarvis et al., 2013). After hatching, from P1 to P6 the two FOXP1 expressing areas were still in the dorsal and ventral pallium above and below the ventricle, and began to take on the adult shapes (Figs. 8D6 and 15D; P6 in Fig. 17C). Simultaneously form ED12 to P6, as the ventral FOXP1 expression area moved caudally into the DVR, the anterior 2/3rds of the lateral ventricle sealed up on itself, with the two FOXP1 areas sealing with it to form the LMI lamina of low FOXP1 expression that separates them (Fig. 17C) as seen in adults (Fig. 8D7); there was still clear continuity of expression that wrapped around the anterior pole of LMI at P6 (Fig. 17C). By adulthood, the seal was complete and extended so far anterior near the venicula blood vessel at the brain’s surface that we could barely detect the FOXP1 continuity around LMI (Fig. 8D7, white arrow and Jarvis et al., 2013), making it appear at as if these two regions were entirely separate unless examined at higher magnification (Fig. 16E-F). When doing so, we noted that even though MOAB gene is expressed in the ventricular zone cells and the LMI lamina (Jarvis et al., 2013), Pax6 expression and the darker Nissl stained eppendyml epithelial cells remain only in the ventricular zone (Figs. 3B4-B7 and 16E-F). The FOXP1 developmental pattern was not seen with non-mesopallium stably expressed genes, including those highly enriched in the striatum [D1B and DLX6; see subpallium section] like FOXP1 and in other pallial divisions [COUP-TF2, PPAPDC1A, and LHX9] not like FOXP1 (Fig. 8). This pattern was seen in all animals at each developmental time point after ED8.
Figure 13.

Medial-lateral anatomical profiles of adult pallial enriched genes at ED10. Sagittal brain sections of zebra finch embryos from medial (top) to lateral (bottom) shows development of (A) LHX9, (B) COUP-TF2, (C) PPAPDC1A, (D) FOXP1, and (E) ROR-β gene expression. Note that at this age PPAPDC1A expression enters the future hyperpallium regions in the dorsal pallium overlapping with part of the FOXP1 dorsal mesopallium region (yellow arrows), and the anterior portion of the FOXP1 dorsal mesopallium region begins to bulge into the ventral pallium where part of the future ventral mesopallium is located. Also seen is an expansion of the ROR-β label for the primary sensory intercalated pallium zones (white arrowhead).
Figure 14.

Medial-lateral anatomical profiles of adult pallial enriched genes at ED12. Sagittal brain sections of zebra finch embryos from medial (top) to lateral (bottom) shows development of (A) LHX9, (B) COUP-TF2, (C) PPAPDC1A, (D) FOXP1, and (E) ROR-β gene expression. Note that PPAPDC1A dorsal hyperpallium labeled region is still mixed in with the FOXP1 dorsal mesopallium region (yellow arrows), and the anterior-ventral portion of the FOXP1 region has expanded to where the future ventral mesopallium is located, taking on the MV shape as seen in adults. Also seen is a further expansion of the ROR-β the primary sensory intercalated pallium zones dorsally (white arrowhead), but still with some regions contained within the FOXP1 mesopallium-like region.
Interestingly, from ED10-P1, contained within a subportion of the FOXP1 dorsal expression region was the primordial hyperpallium marker PPAPDC1A (Fig. 8B and 8D), indicating a potential source of the mix ancestry result seen in our quantitative analyses (Fig. 4B-D). Supporting this possibility are four additional qualitative results: 1) PPAPDC1A appeared at ED6 in the ventral pallium before FOXP1 did at ED8, where they did not overlap; 2) The subsequent migration of the PPAPDC1A expression into the dorsal pallium at ED8 did not overlap with the FOXP1 region at that time (Fig. 12C-D); 3) In the most lateral sections at ED10, the dorsal PPAPDC1A expression was found without FOXP1 expression (Fig. 13C-D) and in the most medial sections the reverse pattern was found (Fig. 13C1 and D1); and 4) The overlap between PPAPDC1A expression and FOXP1 expression in mid-sagittal sections was only seen from ED12 to P1, and it was more patchy for PPAPDC1A and more uniform for FOXP1 (Figs. 14C1-3, 14D1-3, 15C1-3 and 15D1-3). After P6, the dorsal PPAPDC1A and FOXP1 labels started to further segregate into their adult-like forms in the hyperpallium and dorsal mesopallium respectively (Fig. 8A7, 8B7, 17C and 17D). These findings suggests that nidopallium-hyperpallium markers develop first more laterally in the pallium below the ventricle, the mesopallium marker develops first more medially in the pallium above the ventricle, and two cross each others domains more centrally as they enter the respective opposite territories above and below the ventricle.
Development of primary sensory telencephalic fields
In our companion study (Jarvis et al., 2013), we found that the sensory input fields share similar molecular identities. These fields were: 1) IH (visual and somatosensory parts) sandwiched between the hyperpallium and dorsal mesopallium; and 2) field L2 (auditory), E (visual), and B (somatosensory) sandwiched between the nidopallium and striatum (except L2 within the nidopallium). L2, E and B formed a continuous strip of differentially expressed cells that we proposed to call the intercalated nidopallium (IN) as a complement to IH. These findings suggested that all of these regions could have the same embryonic origin. Although we could not reliably quantify thinly labeled IN and IH regions in the small embryonic brains for the phylo-gene expression tree and network analyses, we were still able to partially test this hypothesis by examining the temporal-anatomical profiles of two genes, GRIN2D and ROR-β, that were expressed at high levels in parts of adult IH and IN relative to the rest of the pallium. ROR-β, however, is expressed at intermediate levels in the adult mesopallium (Fig. 9A7; Jarvis et al., 2013).
We found that during the embryonic development, there were regions with enriched ROR-β expression that were similarly located and shaped as adult IH and IN, from ED8 onward at the anterior pole of the telencephalon (Figs. 9B3-7 and 12E). Part of the expression was in the dorsal pallium and part was in the ventral pallium. Further, at all of these embryonic ages, there was a thin region of continuity between the IH-like and IN-like regions at the anterior pole of the telencephalon (Fig. 9A-B, yellow arrows). However, the relative distributions of the labeled cells were more diffuse than in the adult. There was also high expression overlapping with but not completely contained within the dorsal FOXP1 expressing region that formed the dorsal mesopallium (not surprising since ROR-β is expressed in the adult mesopallium) (Figs. 9 and 13-15E). The further along development, the thinner the ROR-β regions became, and the lower the expression in the mesopallium. We also noted from ED6 onward some ROR-β expression in parts of the ventricular zone, but it was variable across individual embryos (Fig. 12-15E) and was not continuous with regions that gave rise to the primary sensory populations. The GRIN2D developmental pattern was similar to ROR-β with modest enriched levels from ED8 onward, except that it was also expressed at enriched levels in the pallidum and brainstem (Fig. 9C3-7). The expression in IH was also not as prominent during development or in adults. These findings suggest a close relationship between IH and IN during development, but with some recognizable gene expression differences.
Overall, the pallial developmental expression patterns revealed continuities of expression around the ventricles that were later more segregated during post hatch development. We next examined the subpallial regions to ask if they had similar properties.
Qualitative temporal-anatomical analyses of subpallial development reveal mixed ancestries
Development of striatum
In adults, DLX6 and D1B had the most enriched expression in the striatum (Fig. 18A7 and B7) and they overlapped with FOXP1 striatal expression (Fig. 8D7; Jarvis et al., 2013). In embryos, from ED4 onward, we found a clear pattern of enriched DLX6 expression in the subpallium ventral to the PAX6 pallial region (Fig. 18A), defined as R7 and R8 in our network analyses (Fig. 6). By ED8, both D1B (Fig. 18B3) and FOXP1 (Fig. 8D3) expression appeared in the dorsal part of this region (R7) with stable pallial-subpallial expression boundaries into adulthood, and thus it appears to be the primordial striatum. The ventral part of the DLX6 enriched region without FOXP1 and D1B expression (R8) could be the primordial pallidum (see next section). DLX6 also had a stable enriched expression pattern in the thalamus from ED6 into adulthood (Fig. 18A2-7).
Development of pallidum
In adults, three genes we examined, LHX8, GRIN2D, and NKX2.1, had enriched expression in the pallidum (Figs. 9C and 18C-E). Several of these genes, such as DLX1, were also previously found in the avian embryonic subpallium (Abellan and Medina, 2009; Fragkouli et al., 2009). Here, we found that the patterns of some of these genes varied from embryonic to adult stages. From ED4-P1, LHX8 was highly and equally expressed in the primordial striatum (FOXP1- and D1B-defined) and pallidum (DLX6-defined; Fig. 18C1-6), and was then turned down in the striatum by adulthood (Fig. 18C7). GRIN2D was turned on in the pallidum by ED6 (Fig. 9C2) and increased in this same region from P1 onward to become more enriched in the pallidum from P1 to adulthood (Fig. 9C6-7). The DLX1 pattern, in contrast, migrated from the highest levels in the subpallium at ED4 to the highest levels in the caudal nidopallium from ED12 to P1, to low expression throughout the telencephalon except in the hippocampus in adults (Fig. 18D). NKX2.1 started with high expression in the entire extant of the primordial subpallial ventricle from ED4-6, was localized in the primordial pallidum at ED8, spread to the primordial striatum by ED10, and finally spread with relatively uniform labeling throughout the subpallium and pallium, except the two mesopallium domains (MV and MD), in adulthood (Fig. 18E). Similar to some of the pallial expression patterns around folds in the ventricle, the striatum and medial septum region also showed continuous high expression of NKX2.1 around a posterior ventral fold in the ventricle (Fig. 16C). Although the OTX2 showed some enriched expression in the subpallium at ED4 (Fig. 18F1), it did not last and was mainly restricted to the brainstem form ED6 onward (Fig. 18F2-7).
The above findings suggest that striatal subpallial markers are maybe more relatively stable throughout development, whereas pallidal subpallial markers might have a higher propensity to migrate. The later finding is consistent with known migration of NKX2.1 GABAergic positive interneurons from the pallidum to the rest of the telencephalon in birds, reptiles, and mammals (Puelles et al., 2000; Bardet et al., 2006; Metin et al., 2007; Garcia-Lopez et al., 2008; van den Akker et al., 2008; Medina and Abellan, 2009; Bardet et al., 2010). Our findings further indicate that the mesopallium might not receive a high concentration of NKX2.1 GABAergic neurons from the pallidum.
Possible origin of the RA song nucleus
Gene expression specializations in song nuclei have been found to start occurring mainly after P10 (Konishi and Akutagawa, 1990; Nixdorf-Bergweiler, 1996; Gahr and Metzdorf, 1999). These findings have lead to the belief that the specialized song nuclei of vocal learning birds appear days after post hatch development. To explore possible development of song system nuclei earlier than P10, we examined the developmental profiles of the subset of genes we used with specialized expression in adult song nuclei. DLX6 was highly expressed in the adult Area X, but we did not find this feature from ED4 to P6 (Fig. 19A). EMX2 was expressed slightly higher and LHX9 down regulated in adult RA relative to the surrounding arcopallium, and here we noted comparable differential expression of these two genes in a topologically similar position from ED12 to P1 (Fig. 19B-C). While our paper was in press, a recent discovery was made of calbidin specialization in the Area X song nucleus of the striatum at ED13 (Garcia-Calero and Scharff, 2013), which is the same as our P1 animals under our incubation conditions. These findings suggest that development of song nuclei specializations could start earlier than P10, towards the end of embryonic development.
Figure 19.

Possible early origin of the RA song nucleus. A: EMX2 gene expression, which is higher in adult RA, shows higher expression in the caudal arcopallium (surround by white arrows) at P1 with the same shape as the RA nucleus of adults. B: LHX9 expression in an adjacent section shows the boundaries of the arcopallium and slightly lower expression in the location of the specialized EMX2 region (black arrows). C: ER81 expression in an adjacent section.
DISCUSSION
Here we performed a quantitative and qualitative analyses of expression profiles of genes enriched in each subdivision of the avian telencephalon throughout embryonic development to adulthood. Our findings lead us to make the following conclusions: 1) The partial mirror image of subdivision expression profiles found in adults can be best explained as continuous zones that develop around different sectors of the ventricle (Fig. 20); 2) These developmental expression profiles cannot be mapped onto the commonly Cartesian-defined coordinate system, two perpendicular axes in the coronal plane to define the telencephalic subdivisions of ventral, dorsal, medial, and lateral pallium relative to the ventricle (Fig. 21); And (3) The pallial subdivisions form sequentially, which may occur in a comparable order to mammalian cortical layers. Below we discuss the implications of these findings for understanding overall avian telencephalic development and impact on hypotheses of homologies with the mammalian brain.
Figure 20.

A model of avian telencephalic development. A-F: Temporal and anatomical progression of regions with shared gene expression profiles (colors) from ED4 to adulthood. Right is oriented anterior. Not all brains regions are generated in the same plane of section. For example, the mesopallium marker patterns are positioned more medial than the nidopallium+hyperpallium marker patterns, and they partly overlap in the central medial-lateral location of the lateral telencephalon. Thus this model represents a compressed view for each developmental age. See main text for explanation of the model. Further details on the chronological appearance of expression markers are summarized in Table 3.
Figure 21.

Comparison with Cartesian-defined model of avian cerebral organization. Shown are coronal views of an adult pigeon brain (A, B) and sagittal views of an adult songbird brain (C, D) with the brain subdivisions colored coded according to a recent vision of Cartesian defined subdivisions (A, C) and the phyletic quantitative gene expression and continuum model (B, D) of this and the companion study (Jarvis et al 2013). The center of coordinates is placed in the ventricle at the level of the LMI lamina, with the x-axis parallel to LMI and the y-axis parallel to the dorsal-ventral position of the ventricle. In these views, regardless of how the regions are named, most non-hippocampus/arcopallium pallial regions extend from the lateral wall of the ventricle to the lateral surface of the telencephalon. Solid white lines are laminas that separate subdivisions. Dashed black lines divide regions within a subdivision, whether a lamina is present or not. Dashed gray lines show the Cartesian coordinate axes (A: anterior; D: dorsal; L: lateral; M: medial; P: posterior; V: ventral).
A temporal developmental model of avian pallial organization
In our companion study (Jarvis et al., 2013), based on shared gene expression and known connectivity evidence, we proposed that the avian telencephalon consist of four major pallial populations: the IH and IN regions as 10-pallium, the hyperpallium and nidopallium as 20-pallium, the dorsal and ventral mesopallium as 30-pallium, and the arcopallium as a 40-pallium. We hypothesized that this brain organization might form by continuous domains that wrap around the telencephalic ventricle during embryonic development. Our developmental findings in this study are consistent with this hypothesis.
To explain these findings, we propose the model shown in Figure 20, which considers the position of the labeled cell population around the ventricle in all planes, development to adulthood, function, and connectivity. In this model, the 40-pallium [arcopallium] and hippocampal markers appear first between ED4-ED6 located in the posterior ventral-dorsal pallium before the DVR bulge into the ventricle takes shape (Fig. 20A, light and dark yellow). The 20-pallium [nidopallium/hyperpallium] markers appear second, starting from the posterior ventral pallium by ED6 (Fig. 20C, mustard green), extending anteriorly in the ventral pallium to wrap around the anterior pole of the ventricle by ED8, and then invading part of the dorsal pallium by ED10 to become the hyperpallium from P1 onward (Fig. 20E-F, green). The 30-pallium [dorsal mesopallium/ventral mesopallium] markers appear third, starting out as a thin layer in the dorsal pallium by ED8 that eventually becomes the dorsal mesopallium (Fig. 20C, red), bulging towards the ventral pallium more anteriorly by ED10 (Fig. 20D, red) where it then wraps around the developing LMI lamina as the ventricle folds to become the ventral mesopallium from ED12 onward (Fig. 20E-F, red). Finally, the 10-pallium [IH/IN] markers appears with weak expression first by ED8 as a curved strip in the anterior ventral-dorsal pole of the telencephalon (Fig. 20C, orange), followed by caudal extensions both ventrally and dorsally from ED12 onward to become respectively IN inserted between the nidopallium and striatum and IH inserted between the dorsal mesopallium and hyperpallium (Fig. 20D-F, orange). Because the 10-pallium pattern shows up weakly at first, we believe additional gene expression markers will be necessary to verify its timing. It may also be that is simply a diffuse set of cells that overlap in timing with the appearance of other subdivision populations. Some of the timing we found confirms a recent study that showed that ER81-labeled lower pallial cells appear before FOXP1-labeled upper pallial cells in chicken embryos (Suzuki et al 2012). It is possible and probable that some of the details on the timing will change when more genes are analyzed, in that some brain subdivisions may appear earlier than the expression of the two or more of its markers, as in the case of FOXP1 in the striatum. At least the existing data gives us a temporal model to start working with, and one that is consistent with the adult organization.
This model could explain the partial mirror image organization of brain subdivisions. However, the model is not a simple wrapping of continuous regions around the ventricle folds for all regions. The invasion of the primordial hyperpallium-like expression of PPAPDC1A would mean that it mixes with the developing mesopallium cells or is co-expressed with the mesopallium marker (FOXP1) in late embryonic stages (Fig. 20D-E, green dots). It is only after hatching that the well-defined boundaries and enlargement of hyperpallium occur. The migration of the mesopallium expression pattern below the anterior ventricle fold in medial to central pallial sectors would require that it displace the migration of the nidopallium-hyperpallium regions that would wrap around the same ventricle fold in central pallial sections.
Such complex moving patterns are consistent with the known more massive anterior-posterior tangential migration of cells in the developing avian telencephalon relative to other migration patterns (Striedter and Keefer, 2000; Dugas-Ford et al., 2012). The moving patterns are also consistent with radial migration of cells away from the ventricle to the surface of the avian telencephalon (Nomura et al., 2009; Tanaka et al., 2011; Suzuki et al., 2012). However, in our model this radial migration would be an expansion of a brain subdivision, not a mechanism to move cells between different dorsal and ventral pallial subdivisions. An alternative explanation is that the pallial populations above and below the lateral ventricle do not have a shared direct developmental origin through migration, but have a parallel independently evolved developmental program. A third alternative is trans-differentiation, where non-migrating cells influence adjacent proliferating cells to convert to a similar cell type. Of these three possibilities, we believe that the continuum hypothesis due to migration is the most parsimonious, as independent evolution would require independent mutations for large transcriptomes of genes in different subdivisions to change in the same way and trans-differentiation would not require migration, but it is already known that there is a significant amount of cell migration in the developing avian telencephalon.
These hypotheses can be validated or falsified by testing more gene expression markers and performing developmental fate mapping of labeled cells in vivo, with existing tools (Striedter and Keefer, 2000; Suzuki et al., 2012). One such experiment would be to locally transfect embryonic cells in a ventral or dorsal region relative to the embryonic ventricle with a viral genomic integration vector containing a promoter for the gene marker of that region upstream of a fluorescent protein (e.g. GFP), and then perform time-lapse microscopy recordings of the developing embryos, which is possible with birds before hatching (Kulesa et al., 2009). If fluorescently labeled cells are seen migrating and expanding from the opposite end of the ventricle, around the ventricle folds, forming the same pattern as the endogenous gene expression patterns then this would support the continuum hypothesis of development of the same brain subdivisions around the ventricle folds. However, if fluorescent labeled cells are seen to only develop locally and not migrate into the region with shared gene expression markers above or below the ventricle, then this would support the independent origins or trans-differentiation hypothesis.
Contrast to the common Cartesian-defined model of developmental brain organization
Our model differs from some past developmental models in important ways. Vertebrate telencephalic gene expression profiles and cellular fate mapping has most often been examined in the coronal view, where the pallium has been categorized into four perpendicular Cartesian sectors in the coronal plane: dorsal, ventral, lateral, and medial pallium with the center of the coordinates in the middle of the ventricle (Puelles, 2001; Puelles, 2011). These four Cartesian sectors have been equated with the adult brain subdivisions, usually with the center of the coordinates at the level of the LMI lamina (Fig. 21A, C), but with differences among studies. One of the latest views is that the embryonic Cartesian-defined avian dorsal pallium gives rise to the hyperpallium (hyperpallium and dorsal mesopallium of this study), the ventral pallium gives rise to the nidopallium and arcopallium, the lateral pallium to the mesopallium (ventral mesopallium of this study), and the medial pallium to the hippocampus (Medina and Abellan, 2009). However, this model is not consistent with the topographic gene expression relationships we discovered in the developing and adult pallium. For example, the mesopallium marker FOXP1 forms at the dorsal most edge of the medial half of the lateral pallium first before it expands further laterally above the ventricle and ventrally below it. The hyperpallium-nidopallium marker PPAPDC1A first forms in the ventral pallium above the striatum but in a lateral location, mixes with the invading mesopallium region around an anterior fold in the ventricle, and then segregates dorsally above the ventricle. By adulthood, the hyperpallium, nidopallium, dorsal mesopallium and ventral mesopallium subdivisions all extend from the lateral surface of the ventricle to the lateral edge of the telencephalon, with no one subdivision more medial or lateral to each other in the Cartesian coordinate system depending on anterior-posterior location (Fig. 21B, D). That is, the mesopallium topographically can’t be called lateral pallium relative to other pallial subdivisions because it is not more lateral to them; rather, it so far appears that the nidopallium+hyperpallium develops more laterally to the mesopallium (Fig. 21B). Finally, neither the “dorsal, ventral, lateral, and medial pallium” model nor its predecessor, the “dorsal pallium and DVR” model, can explain our observation of dorsal-ventral continuities around the ventricle in the developing avian telencephalon. Rather, our findings suggest that avian telencephalic organization is more contorted and continuous (Fig. 21C-D). We believe that the more complex, but visible organization may have been easily missed in past studies due to viewing brain sections mainly in the coronal plane where some of the anterior to posterior continuities can not be found in single sections, to not having a sufficient number of gene expression markers for each brain subdivision, and to viewing the position of the ventricle as an absolute border where cells on one side were not considered directly related to cells on the other side.
Interpretations relative to homologies with mammals
Our findings impact the two major competing hypotheses of avian and mammalian pallium homologies (Medina and Reiner, 2000; Jarvis et al., 2005; Medina and Abellan, 2009; Wang et al., 2010; Butler et al., 2011; Puelles, 2011): 1) The nuclear-to-layered hypothesis, which claims that the avian pallial regions ventral to the LMI lamina (old LFS) are homologous to different mammalian cortical layers (Fig. 22A vs 22B; red, green, yellow, orange); And 2) The claustrum-amygdala hypothesis, which instead claims that avian pallial regions ventral to the LMI lamina (old LFS) are homologous to the mammalian claustrum and amygdala (Fig. 22A vs 22C; red, green, yellow; Jarvis et al., 2013). Both hypotheses claim that the subdivisions above the LMI lamina are homologous to the mammalian cortex. However, in order for either of these hypotheses to be true in the context of our findings, all of the avian 10-40 pallial regions above and below LMI will have to be homologous to either the six layered cortex or to the claustrum/amygdala. The nuclear-to-layered hypothesis does satisfy this requirement, but only partly, as the homologies with specific cortical layers in the dorsal pallium above LMI need to be further specified with those below LMI. To specify one possibility, our designated 10-pallium would be homologous to mammalian cortex layer IV neurons, the 20-pallium to layer III, the 30-pallium to higher order layer II and III neurons, and 40-pallium to layer V and VI neurons (Fig. 22B; Jarvis et al., 2013). Consistent with this modified nuclear-to-layered hypothesis is that the avian pallial sequential development we found thus far overlaps with the order of the mammalian cortical development from deeper to upper layers, in the order of layers VI, V, IV, III, and II (Molyneaux et al., 2007; Boyle et al., 2011). Our timing findings are also consistent with overall pallial development in mammals, which occurs sequentially from ventral to dorsal maturation of regions (Bayer and Altman, 1991). The major difference is that in mammals layer IV neurons form before layers III and II, and the markers of avian 10-pallium that we studied appear either simultaneously or soon after the 30-pallium markers. However, more markers and finer time course analyses are necessary to validate this difference. At issue with this model is that there is nothing yet that distinguishes relationships with the claustrum and amygdala separate from the cortex homologies.
Figure 22.

Avian cerebral organization and its mammalian homologies according to different hypotheses. A: Color-coded scheme of the avian brain in our organization model. B: Color-coded scheme of the rodent brain according to the nuclear-to-layered hypothesis of homology with the avian brain. C: Color-coded scheme of the rodent brain according to the nuclear-to-claustrum/amgydala hypothesis of homology with the avian brain. D: Color-coded scheme of the rodent brain according to a field hypothesis of homology with the avian brain proposed in this study.
In order for the claustrum-amgydala hypothesis to hold in the context of our findings, the mammalian claustrum and amgydala would have to be considered extensions of specific layers of the cortex. Here, the avian pallial regions dorsal to LMI would be homologous to different layers of the cortex as described above, but the regions ventral to LMI would be continuous extensions homologous to the claustrum and amygdala. Consistent with this idea, the pallial amygdala has been proposed to be an extension of cortex layers V and VI (Swanson, 2000). The developing claustrum and mammalian upper cortical layer neurons both express FOXP1 and EMX1 (Smith-Fernandez et al., 1998; Puelles et al., 2000; Aboitiz, 2011; Boyle et al., 2011) as does the developing avian mesopallium (30-pallium). The developing mammalian amygdala and different layers of the cortex expresses LMO4, LHX9, COUP-TF2 (Allen Brain Institute Mouse Atlas; http://mouse.brain-map.org), genes originally used to claim that the amygdala is homologous to avian arcopallium (Yamamoto et al., 2005; Molnar and Cheung, 2006; Watakabe et al., 2007; Garcia-Lopez et al., 2008; Butler et al., 2011; Puelles, 2011; Dugas-Ford et al., 2012; Tang et al., 2012). Difficulties with this idea is that the amygdala has also been found to develop both from cells that migrate from the six-layered cortex and from non-layered cortical regions (Deussing and Wurst, 2007; Remedios et al., 2007; Soma et al., 2009), and the avian mesopallium appears to begin in the dorsal pallium, whereas the nidopallium-hyperpallium cells appear to begin in the ventral pallium.
We also found that the adult layer V marker, ER81, was not anatomically consistent through all developmental stages in birds, but spreads from two separate zones, the subpallium to the pallium and the dorsal pallium to other parts of the pallium. This finding indicates that the ER81 expressing cells possibly migrate tangentally, as has been suggested previously for mammals (Teissier et al., 2010). It is not clear if layer V ER81 cells migrate into their cortical regions by a mechanism separate from radial migration, an idea that would contradict the dominant inside out pattern of excitatory neuron development away from the ventricle. However, we note that ER81 is also expressed at comparably high levels in the basolateral amygdala (Allen Brain Institute Mouse Atlas), and amygdala development does include tangential migration of cells (Deussing and Wurst, 2007; Remedios et al., 2007; Soma et al., 2009). We were also surprised to find that the gene expression profiles of the arcopallium were most closely related to the avian hippocampus, also around a fold in the ventricle. Like the mammalian hippocampus, the avian hippocampus contains multiple, segregated cell types, but more nuclear-like in organization than the layered formation in mammals (Atoji and Wild, 2006). And finally, we believe that there has not yet been a sufficient set of gene expression markers identified that distinguish the claustrum and amygdala from the six layered cortex, and that have been analyzed also in the avian brain.
At present, until further evidence can support either hypothesis or the modifications mentioned above, we believe that our adult (Jarvis et al., 2013) and developmental (this study) data on the avian brain compared with expression profiles in the mammalian brain are best explained in the context of a field homology hypothesis (Fig. 22A vs 22D; Butler and Molnar, 2002; Butler et al., 2002; Jarvis et al., 2013). In this hypothesis, the 10-40 cells in the avian pallium would be homologous as a field to cells in the mammalian cortex, claustrum, and amgydala. The avian arcopallium (40-pallium) would be homologous to both the mammalian cortex layer V and pallial amygdala; the avian mesopallium (30-pallium) would be homologous to both the mammalian cortex layers I-II and the claustrum. Testing this hypothesis would require further resolving cell-type relationships first within mammalian and avian brains, and between mammalian and avian brains.
In summary, our findings suggest that a new model is necessary for explaining avian brain organization, evolution and homologies with other vertebrates. We attempted to propose such a model that is consistent with our current findings and the previously published data. We caution that the details of this model will probably require revision and fine tuning as more expression data, other types of analyses, and more functional experiments are preformed. But, we believe that the fundamental principles are unlikely to change. We hope that it can serve to germinate novel ideas and approaches to further decipher the general principles of our understanding of comparative vertebrate brain organization.
ACKNOWLEGMENTS
We thank Tony Reiner, Harvey Karten, Ann Butler, Loreta Medina, Luis Puelles, Martin Wild, Toru Shimizu, and Claudio Mello for their comments and critical discussions.
This research was supported by a NIH Director’s Pioneer Award and HHMI to Erich D. Jarvis.
Footnotes
CONFLICT OF INTEREST All authors declare no conflict of interest in this work.
References
- Abellan A, Medina L. Subdivisions and derivatives of the chicken subpallium based on expression of LIM and other regulatory genes and markers of neuron subpopulations during development. J Comp Neurol. 2009;515(4):465–501. doi: 10.1002/cne.22083. [DOI] [PubMed] [Google Scholar]
- Aboitiz F. Genetic and developmental homology in amniote brains. Toward conciliating radical views of brain evolution. Brain Res Bull. 2011;84(2):125–136. doi: 10.1016/j.brainresbull.2010.12.003. [DOI] [PubMed] [Google Scholar]
- Atoji Y, Wild JM. Anatomy of the avian hippocampal formation. Rev Neurosci. 2006;17(1-2):3–15. doi: 10.1515/revneuro.2006.17.1-2.3. [DOI] [PubMed] [Google Scholar]
- Bardet SM, Cobos I, Puelles E, Martinez-De-La-Torre M, Puelles L. Chicken lateral septal organ and other circumventricular organs form in a striatal subdomain abutting the molecular striatopallidal border. J Comp Neurol. 2006;499(5):745–767. doi: 10.1002/cne.21121. [DOI] [PubMed] [Google Scholar]
- Bardet SM, Ferran JL, Sanchez-Arrones L, Puelles L. Ontogenetic expression of sonic hedgehog in the chicken subpallium. Front Neuroanat. 2010;4 doi: 10.3389/fnana.2010.00028. [DOI] [PMC free article] [PubMed] [Google Scholar]
- Bayer SA, Altman J. Neocortical development. xiv. Raven Press; New York: 1991. p. 255.p. 258. [Google Scholar]
- Boyle MP, Bernard A, Thompson CL, Ng L, Boe A, Mortrud M, Hawrylycz MJ, Jones AR, Hevner RF, Lein ES. Cell-type-specific consequences of Reelin deficiency in the mouse neocortex, hippocampus, and amygdala. J Comp Neurol. 2011;519(11):2061–2089. doi: 10.1002/cne.22655. [DOI] [PubMed] [Google Scholar]
- Butler AB, Molnar Z. Development and evolution of the collopallium in amniotes: a new hypothesis of field homology. Brain Res Bull. 2002;57(3-4):475–479. doi: 10.1016/s0361-9230(01)00679-7. [DOI] [PubMed] [Google Scholar]
- Butler AB, Molnar Z, Manger PR. Apparent absence of claustrum in monotremes: implications for forebrain evolution in amniotes. Brain Behav Evol. 2002;60(4):230–240. doi: 10.1159/000066698. [DOI] [PubMed] [Google Scholar]
- Butler AB, Reiner A, Karten HJ. Evolution of the amniote pallium and the origins of mammalian neocortex. Ann N Y Acad Sci. 2011;1225:14–27. doi: 10.1111/j.1749-6632.2011.06006.x. [DOI] [PMC free article] [PubMed] [Google Scholar]
- Charvet CJ, Striedter GF. Developmental origins of mosaic brain evolution: Morphometric analysis of the developing zebra finch brain. J Comp Neurol. 2009;514(2):203–213. doi: 10.1002/cne.22005. [DOI] [PubMed] [Google Scholar]
- Chen CC, Balaban E, Jarvis ED. Interspecies avian brain chimeras reveal that large brain size differences are influenced by cell-interdependent processes. PLoS One. 2012a;7(7):e42477. doi: 10.1371/journal.pone.0042477. [DOI] [PMC free article] [PubMed] [Google Scholar]
- Chen CC, Wada K, Jarvis ED. Radioactive in situ hybridization for detecting diverse gene expression patterns in tissue. J Vis Exp. 2012b;(62) doi: 10.3791/3764. [DOI] [PMC free article] [PubMed] [Google Scholar]
- Cobos I, Puelles L, Martinez S. The avian telencephalic subpallium originates inhibitory neurons that invade tangentially the pallium (dorsal ventricular ridge and cortical areas) Developmental Biology. 2001;239(1):30–45. doi: 10.1006/dbio.2001.0422. [DOI] [PubMed] [Google Scholar]
- Deussing JM, Wurst W. Amygdala and neocortex: common origins and shared mechanisms. Nat Neurosci. 2007;10(9):1081–1082. doi: 10.1038/nn0907-1081. [DOI] [PubMed] [Google Scholar]
- Dugas-Ford J, Rowell JJ, Ragsdale CW. Cell-type homologies and the origins of the neocortex. Proc Natl Acad Sci U S A. 2012 doi: 10.1073/pnas.1204773109. [DOI] [PMC free article] [PubMed] [Google Scholar]
- Feenders G, Liedvogel M, Rivas M, Zapka M, Horita H, Hara E, Wada K, Mouritsen H, Jarvis ED. Molecular mapping of movement-associated areas in the avian brain: a motor theory for vocal learning origin. PLoS One. 2008;3(3):e1768. doi: 10.1371/journal.pone.0001768. [DOI] [PMC free article] [PubMed] [Google Scholar]
- Fragkouli A, van Wijk NV, Lopes R, Kessaris N, Pachnis V. LIM homeodomain transcription factor-dependent specification of bipotential MGE progenitors into cholinergic and GABAergic striatal interneurons. Development. 2009;136(22):3841–3851. doi: 10.1242/dev.038083. [DOI] [PMC free article] [PubMed] [Google Scholar]
- Gahr M, Metzdorf R. The sexually dimorphic expression of androgen receptors in the song nucleus hyperstriatalis ventrale pars caudale of the zebra finch develops independently of gonadal steroids. J Neurosci. 1999;19(7):2628–2636. doi: 10.1523/JNEUROSCI.19-07-02628.1999. [DOI] [PMC free article] [PubMed] [Google Scholar]
- Garcia-Calero E, Scharff C. Calbindin expression in developing striatum of zebra finches and its relation to the formation of area X. J Comp Neurol. 2013;521(2):326–341. doi: 10.1002/cne.23174. [DOI] [PubMed] [Google Scholar]
- Garcia-Lopez M, Abellan A, Legaz I, Rubenstein JL, Puelles L, Medina L. Histogenetic compartments of the mouse centromedial and extended amygdala based on gene expression patterns during development. J Comp Neurol. 2008;506(1):46–74. doi: 10.1002/cne.21524. [DOI] [PMC free article] [PubMed] [Google Scholar]
- Haesler S, Wada K, Nshdejan A, Morrisey EE, Lints T, Jarvis ED, Scharff C. FoxP2 expression in avian vocal learners and non-learners. J Neurosci. 2004;24(13):3164–3175. doi: 10.1523/JNEUROSCI.4369-03.2004. [DOI] [PMC free article] [PubMed] [Google Scholar]
- Hamburger V, Hamilton HL. A series of normal stages in the development of the chick embryo. 1951. Dev Dyn. 1992;195(4):231–272. doi: 10.1002/aja.1001950404. [DOI] [PubMed] [Google Scholar]
- Horita H, Wada K, Rivas MV, Hara E, Jarvis ED. The dusp1 immediate early gene is regulated by natural stimuli predominantly in sensory input neurons. J Comp Neurol. 2010;518(14):2873–2901. doi: 10.1002/cne.22370. [DOI] [PMC free article] [PubMed] [Google Scholar]
- Jarvis E, Yu J, Rivas MV, Horita H, Feenders G, Whitney O, Jarvis S, Jarvis ER, Kubikova L, Puck AEP, Siang-Bakshi C, Martin S, McElroy M, Hara E, Howard J, Mouritsen H, Chen C-C, Wad K. A global view of the functional molecular organization of the avian cerebrum: mirror images and functional columns. J Comp Neurol. 2013 doi: 10.1002/cne.23404. In Press. [DOI] [PMC free article] [PubMed] [Google Scholar]
- Jarvis ED. Learned birdsong and the neurobiology of human language. Ann N Y Acad Sci. 2004;1016:749–777. doi: 10.1196/annals.1298.038. [DOI] [PMC free article] [PubMed] [Google Scholar]
- Jarvis ED, Gunturkun O, Bruce L, Csillag A, Karten H, Kuenzel W, Medina L, Paxinos G, Perkel DJ, Shimizu T, Striedter G, Wild JM, Ball GF, Dugas-Ford J, Durand SE, Hough GE, Husband S, Kubikova L, Lee DW, Mello CV, Powers A, Siang C, Smulders TV, Wada K, White SA, Yamamoto K, Yu J, Reiner A, Butler AB. Avian brains and a new understanding of vertebrate brain evolution. Nat Rev Neurosci. 2005;6(2):151–159. doi: 10.1038/nrn1606. [DOI] [PMC free article] [PubMed] [Google Scholar]
- Konishi M, Akutagawa E. Growth and atrophy of neurons labeled at their birth in a song nucleus of the zebra finch. Proc Natl Acad Sci U S A. 1990;87(9):3538–3541. doi: 10.1073/pnas.87.9.3538. [DOI] [PMC free article] [PubMed] [Google Scholar]
- Kulesa PM, Stark DA, Steen J, Lansford R, Kasemeier-Kulesa JC. Watching the assembly of an organ a single cell at a time using confocal multi-position photoactivation and multi-time acquisition. Organogenesis. 2009;5(4):238–247. doi: 10.4161/org.5.4.10482. [DOI] [PMC free article] [PubMed] [Google Scholar]
- Martinez-Garcia F, Puelles L, Ten Donkelaar HJ, Gonzalez A. Adaptive function and brain evolution. Front Neuroanat. 2012;6:17. doi: 10.3389/fnana.2012.00017. [DOI] [PMC free article] [PubMed] [Google Scholar]
- Medina L, Abellan A. Development and evolution of the pallium. Seminars in Cell & Developmental Biology. 2009;20(6):698–711. doi: 10.1016/j.semcdb.2009.04.008. [DOI] [PubMed] [Google Scholar]
- Medina L, Reiner A. Do birds possess homologues of mammalian primary visual, somatosensory and motor cortices? Trends Neurosci. 2000;23(1):1–12. doi: 10.1016/s0166-2236(99)01486-1. [DOI] [PubMed] [Google Scholar]
- Metin C, Alvarez C, Moudoux D, Vitalis T, Pieau C, Molnar Z. Conserved pattern of tangential neuronal migration during forebrain development. Development. 2007;134(15):2815–2827. doi: 10.1242/dev.02869. [DOI] [PubMed] [Google Scholar]
- Molnar Z, Cheung AF. Towards the classification of subpopulations of layer V pyramidal projection neurons. Neurosci Res. 2006;55(2):105–115. doi: 10.1016/j.neures.2006.02.008. [DOI] [PubMed] [Google Scholar]
- Molyneaux BJ, Arlotta P, Menezes JR, Macklis JD. Neuronal subtype specification in the cerebral cortex. Nat Rev Neurosci. 2007;8(6):427–437. doi: 10.1038/nrn2151. [DOI] [PubMed] [Google Scholar]
- Mouritsen H, Feenders G, Liedvogel M, Wada K, Jarvis ED. Night-vision brain area in migratory songbirds. Proc Natl Acad Sci U S A. 2005;102(23):8339–8344. doi: 10.1073/pnas.0409575102. [DOI] [PMC free article] [PubMed] [Google Scholar]
- Nixdorf-Bergweiler BE. Divergent and parallel development in volume sizes of telencephalic song nuclei in male and female zebra finches. J Comp Neurol. 1996;375(3):445–456. doi: 10.1002/(SICI)1096-9861(19961118)375:3<445::AID-CNE7>3.0.CO;2-2. [DOI] [PubMed] [Google Scholar]
- Nomura T, Hattori M, Osumi N. Reelin, radial fibers and cortical evolution: insights from comparative analysis of the mammalian and avian telencephalon. Dev Growth Differ. 2009;51(3):287–297. doi: 10.1111/j.1440-169X.2008.01073.x. [DOI] [PubMed] [Google Scholar]
- Puelles L. Thoughts on the development, structure and evolution of the mammalian and avian telencephalic pallium. Philosophical Transactions of the Royal Society of London - Series B: Biological Sciences. 2001;356(1414):1583–1598. doi: 10.1098/rstb.2001.0973. [DOI] [PMC free article] [PubMed] [Google Scholar]
- Puelles L. Pallio-pallial tangential migrations and growth signaling: new scenario for cortical evolution? Brain Behav Evol. 2011;78(1):108–127. doi: 10.1159/000327905. [DOI] [PubMed] [Google Scholar]
- Puelles L, Kuwana E, Puelles E, Bulfone A, Shimamura K, Keleher J, Smiga S, Rubenstein JL. Pallial and subpallial derivatives in the embryonic chick and mouse telencephalon, traced by the expression of the genes Dlx-2, Emx-1, Nkx-2.1, Pax-6, and Tbr-1. J Comp Neurol. 2000;424(3):409–438. doi: 10.1002/1096-9861(20000828)424:3<409::aid-cne3>3.0.co;2-7. [DOI] [PubMed] [Google Scholar]
- Reiner A, Perkel DJ, Mello CV, Jarvis ED. Songbirds and the revised avian brain nomenclature. Annals of the New York Academy of Sciences. 2004;1016:77–108. doi: 10.1196/annals.1298.013. [DOI] [PMC free article] [PubMed] [Google Scholar]
- Remedios R, Huilgol D, Saha B, Hari P, Bhatnagar L, Kowalczyk T, Hevner RF, Suda Y, Aizawa S, Ohshima T, Stoykova A, Tole S. A stream of cells migrating from the caudal telencephalon reveals a link between the amygdala and neocortex. Nat Neurosci. 2007;10(9):1141–1150. doi: 10.1038/nn1955. [DOI] [PubMed] [Google Scholar]
- Replogle K, Arnold AP, Ball GF, Band M, Bensch S, Brenowitz EA, Dong S, Drnevich J, Ferris M, George JM, Gong G, Hasselquist D, Hernandez AG, Kim R, Lewin HA, Liu L, Lovell PV, Mello CV, Naurin S, Rodriguez-Zas S, Thimmapuram J, Wade J, Clayton DF. The Songbird Neurogenomics (SoNG) Initiative: community-based tools and strategies for study of brain gene function and evolution. BMC Genomics. 2008;9:131. doi: 10.1186/1471-2164-9-131. [DOI] [PMC free article] [PubMed] [Google Scholar]
- Smith-Fernandez AS, Pieau C, Reperant J, Boncinelli E, Wassef M. Expression of the Emx-1 and Dlx-1 homeobox genes define three molecularly distinct domains in the telencephalon of mouse, chick, turtle and frog embryos: implications for the evolution of telencephalic subdivisions in amniotes. Development. 1998;125:2099–2111. doi: 10.1242/dev.125.11.2099. [DOI] [PubMed] [Google Scholar]
- Smoot ME, Ono K, Ruscheinski J, Wang PL, Ideker T. Cytoscape 2.8: new features for data integration and network visualization. Bioinformatics. 2011;27(3):431–432. doi: 10.1093/bioinformatics/btq675. [DOI] [PMC free article] [PubMed] [Google Scholar]
- Soma M, Aizawa H, Ito Y, Maekawa M, Osumi N, Nakahira E, Okamoto H, Tanaka K, Yuasa S. Development of the mouse amygdala as revealed by enhanced green fluorescent protein gene transfer by means of in utero electroporation. J Comp Neurol. 2009;513(1):113–128. doi: 10.1002/cne.21945. [DOI] [PubMed] [Google Scholar]
- Striedter GF, Keefer BP. Cell migration and aggregation in the developing telencephalon: pulse-labeling chick embryos with bromodeoxyuridine. J Neurosci. 2000;20(21):8021–8030. doi: 10.1523/JNEUROSCI.20-21-08021.2000. [DOI] [PMC free article] [PubMed] [Google Scholar]
- Suzuki IK, Kawasaki T, Gojobori T, Hirata T. The temporal sequence of the mammalian neocortical neurogenetic program drives mediolateral pattern in the chick pallium. Dev Cell. 2012;22(4):863–870. doi: 10.1016/j.devcel.2012.01.004. [DOI] [PubMed] [Google Scholar]
- Suzuki R, Shimodaira H. Pvclust: an R package for assessing the uncertainty in hierarchical clustering. Bioinformatics. 2006;22(12):1540–1542. doi: 10.1093/bioinformatics/btl117. [DOI] [PubMed] [Google Scholar]
- Swanson LW. Cerebral hemisphere regulation of motivated behavior. Brain Res. 2000;886(1-2):113–164. doi: 10.1016/s0006-8993(00)02905-x. [DOI] [PubMed] [Google Scholar]
- Tanaka DH, Oiwa R, Sasaki E, Nakajima K. Changes in cortical interneuron migration contribute to the evolution of the neocortex. Proc Natl Acad Sci U S A. 2011;108(19):8015–8020. doi: 10.1073/pnas.1102153108. [DOI] [PMC free article] [PubMed] [Google Scholar]
- Tang K, Rubenstein JL, Tsai SY, Tsai MJ. COUP-TFII controls amygdala patterning by regulating neuropilin expression. Development. 2012;139(9):1630–1639. doi: 10.1242/dev.075564. [DOI] [PMC free article] [PubMed] [Google Scholar]
- Teissier A, Griveau A, Vigier L, Piolot T, Borello U, Pierani A. A novel transient glutamatergic population migrating from the pallial-subpallial boundary contributes to neocortical development. J Neurosci. 2010;30(31):10563–10574. doi: 10.1523/JNEUROSCI.0776-10.2010. [DOI] [PMC free article] [PubMed] [Google Scholar]
- van den Akker WM, Brox A, Puelles L, Durston AJ, Medina L. Comparative functional analysis provides evidence for a crucial role for the homeobox gene Nkx2.1/Titf-1 in forebrain evolution. J Comp Neurol. 2008;506(2):211–223. doi: 10.1002/cne.21542. [DOI] [PubMed] [Google Scholar]
- Wada K, Howard JT, McConnell P, Whitney O, Lints T, Rivas MV, Horita H, Patterson MA, White SA, Scharff C, Haesler S, Zhao S, Sakaguchi H, Hagiwara M, Shiraki T, Hirozane-Kishikawa T, Skene P, Hayashizaki Y, Carninci P, Jarvis ED. A molecular neuroethological approach for identifying and characterizing a cascade of behaviorally regulated genes. Proc Natl Acad Sci U S A. 2006;103(41):15212–15217. doi: 10.1073/pnas.0607098103. [DOI] [PMC free article] [PubMed] [Google Scholar]
- Wada K, Sakaguchi H, Jarvis ED, Hagiwara M. Differential expression of glutamate receptors in avian neural pathways for learned vocalization. The Journal of comparative neurology. 2004;476(1):44–64. doi: 10.1002/cne.20201. [DOI] [PMC free article] [PubMed] [Google Scholar]
- Wang Y, Brzozowska-Prechtl A, Karten HJ. Laminar and columnar auditory cortex in avian brain. Proc Natl Acad Sci U S A. 2010;107(28):12676–12681. doi: 10.1073/pnas.1006645107. [DOI] [PMC free article] [PubMed] [Google Scholar]
- Warren WC, Clayton DF, Ellegren H, Arnold AP, Hillier LW, Kunstner A, Searle S, White S, Vilella AJ, Fairley S, Heger A, Kong L, Ponting CP, Jarvis ED, Mello CV, Minx P, Lovell P, Velho TA, Ferris M, Balakrishnan CN, Sinha S, Blatti C, London SE, Li Y, Lin YC, George J, Sweedler J, Southey B, Gunaratne P, Watson M, Nam K, Backstrom N, Smeds L, Nabholz B, Itoh Y, Whitney O, Pfenning AR, Howard J, Volker M, Skinner BM, Griffin DK, Ye L, McLaren WM, Flicek P, Quesada V, Velasco G, Lopez-Otin C, Puente XS, Olender T, Lancet D, Smit AF, Hubley R, Konkel MK, Walker JA, Batzer MA, Gu W, Pollock DD, Chen L, Cheng Z, Eichler EE, Stapley J, Slate J, Ekblom R, Birkhead T, Burke T, Burt D, Scharff C, Adam I, Richard H, Sultan M, Soldatov A, Lehrach H, Edwards SV, Yang SP, Li X, Graves T, Fulton L, Nelson J, Chinwalla A, Hou S, Mardis ER, Wilson RK. The genome of a songbird. Nature. 2010;464(7289):757–762. doi: 10.1038/nature08819. [DOI] [PMC free article] [PubMed] [Google Scholar]
- Watakabe A, Ichinohe N, Ohsawa S, Hashikawa T, Komatsu Y, Rockland KS, Yamamori T. Comparative analysis of layer-specific genes in Mammalian neocortex. Cereb Cortex. 2007;17(8):1918–1933. doi: 10.1093/cercor/bhl102. [DOI] [PubMed] [Google Scholar]
- Yamamoto K, Sun Z, Wang HB, Reiner A. Subpallial amygdala and nucleus taeniae in birds resemble extended amygdala and medial amygdala in mammals in their expression of markers of regional identity. Brain Res Bull. 2005;66(4-6):341–347. doi: 10.1016/j.brainresbull.2005.02.016. [DOI] [PubMed] [Google Scholar]
- Yoneshima H, Yamasaki S, Voelker CC, Molnar Z, Christophe E, Audinat E, Takemoto M, Nishiwaki M, Tsuji S, Fujita I, Yamamoto N. Er81 is expressed in a subpopulation of layer 5 neurons in rodent and primate neocortices. Neuroscience. 2006;137(2):401–412. doi: 10.1016/j.neuroscience.2005.08.075. [DOI] [PubMed] [Google Scholar]
- Zeigler HP, Marler P. Neuroscience of birdsong. xvi. Cambridge Univeristy Press; Cambridge England ; New York: 2008. p. 550. [Google Scholar]