Abstract
Biomechanical models that describe soft tissue deformation provide a relatively inexpensive way to correct registration errors in image-guided neurosurgical systems caused by nonrigid brain shift. Quantifying the factors that cause this deformation to sufficient precision is a challenging task. To circumvent this difficulty, atlas-based methods have been developed recently that allow for uncertainty, yet still capture the first-order effects associated with deformation. The inverse solution is driven by sparse intraoperative surface measurements, which could bias the reconstruction and affect the subsurface accuracy of the model prediction. Studies using intraoperative MR have shown that the deformation in the midline, tentorium, and contralateral hemisphere is relatively small. The dural septa act as rigid membranes supporting the brain parenchyma and compartmentalizing the brain. Accounting for these structures in models may be an important key to improving subsurface shift accuracy. A novel method to segment the tentorium cerebelli will be described, along with the procedure for modeling the dural septa. Results in seven clinical cases show a qualitative improvement in subsurface shift accuracy making the predicted deformation more congruous with previous observations in the literature. The results also suggest a considerably more important role for hyperosmotic drug modeling for the intraoperative shift correction environment.
Index Terms: Brain modeling, dural septa, falx cerebri, finite-element methods, image-guided surgery, inverse model, tentorium cerebelli
I. Introduction
Image guidance found its earliest applications in neurosurgery and it is the standard of care today for the surgical treatments of central nervous system neoplasia, epilepsy, and cerebrovascular disorders. The fidelity of image to physical space registration is central to image-guided neuronavigation and is known to be compromised by the phenomenon of brain shift, deformation of brain tissue caused by gravity, edema, hyperosmotic drugs administered prior to surgery, and tissue resection. Systematic studies to characterize this deformation have been performed with the aid of intraoperative digitization and have found that the range of deformation for brain tissue could vary from 1 to 2.5 cm from their preoperative state during surgery [1], [2]. A trained neurosurgeon is aware of the misalignment between the surgical field and the preoperative image and compensates for it to some extent [3] but guidance systems capable of compensation would be very desirable.
Extensive work has been reported in the literature to compensate for brain shift. One strategy is to use intraoperative imaging techniques such as CT [4], MRI [1], and ultrasound [5]. Although intraoperative imaging captures a great deal of anatomical shift, the wealth of preoperative data cannot be updated during surgery. As a result, the brain shift literature has also demonstrated a need for preoperative to intraoperative data registration via computational approaches. Hata et al. used non-rigid registration between preoperative and intraoperative MR images with a mutual information metric [6]. Biomechanical models using discretized methods (such as finite-element techniques) have been explored by many groups for this problem. Hagemann et al. performed a 2-D analysis using a linear elastic model driven by surface displacements computed using active contours method [7]. Ferrant et al. followed a similar approach and extracted the surface of the cortex and ventricles for the preoperative and intraoperative MR images and used an iterative shape matching algorithm to compute the surface displacements [8]. Wittek et al. obtained displacement information from intraoperative MR data and obtained volumetric displacement by applying a nonlinear model [9]. Clatz et al. used a block matching algorithm instead of surface information to drive their computer-model-based approach [10]. It should be noted that all of the aforementioned methods require an intraoperative MR scan, and while all are important contributions, those devices are not widely available due to high cost of operation, a cost that could represent monetary, radiation exposure (in the case of CT), and/or cumbersomeness.
A more cost-effective alternative to volumetric intraoperative images is to use sparse data, which do not require the installation of expensive tomographic devices in the operating room (OR). Stereoscopic cameras and laser range scanners (LRS) are two devices in this category and have been used extensively to capture cortical surface data. The former involves a pair of charge-couple device (CCD) cameras attached to the stereoscopic microscope. Triangulation is used between corresponding homologous points to estimate the surface coordinates. The latter method involves a laser source and CCD camera. It works by propagation of a laser onto the brain surface and with its acquisition via CCD, followed by the triangulation of the range of the surfaces. The method further involves the systematic translation of the laser light and a complete surface description of the object of interest can be constructed. With respect to the stereo method, Skrinjar et al. and Sun et al. have used this technique to compute and compensate for intraoperative brain shift [11], [12]. With the LRS method, there have been several investigations involving the evaluation of rigid registration [13]–[15] and the measurement of nonrigid brain shift [16], [17].
While methods to measure the cortical surface are improving, having accurate updated subsurface information to delineate the remainder of tumor margin prior to, during, and after a resection would dramatically improve the utility of image-guided surgery systems. Interestingly, for the same reasons that make biomechanical models a compelling methodology with intraoperative MR data, they are a promising avenue to pursue for an intraoperative updating strategy using sparse data. In the past decade, the growth in this literature and approach has been quite significant. Sun et al. used a stereoscopic microscope to estimate the 3-D cortical surface and registered it to the preoperative image for guidance in the OR [12]. Paul et al. used automatic landmark extraction for registering the stereoscopically reconstructed surfaces and computing the nonrigid displacements [18]. Dumpuri et al. used a statistical model driven by sparse laser range scan data to correct for brain shift [19].
While many approaches are being pursued, the study reflected in this paper uses the approach described by Dumpuri et al. [19]. In this approach, an atlas of solutions that accounts for shift caused by gravity, edema, and mannitol with different head orientations and capillary permeabilities is computed. As a general characterization, the inverse solution is reconstructed by minimizing the least-squared error between the solutions and the measurements made with sparse data. This method has been validated thus far using preoperative and immediate-postoperative MR data and the predictions were found to account for 85% of subsurface shift using surface data only (similar accuracies have been found for subsurface predictions) [20].
While this work was quite compelling, it still does not represent an assessment of the technique during the intraoperative state. In this study, a modified approach to the atlas correction is investigated within the context of true intraoperative shift correction. Results are reported that reflect the difference in the magnitude of deformation occurring intraoperatively as opposed to the pre- and postoperative measurements used in the Dumpuri et al. study. While intraoperative MR imaging capabilities are not available at our institution, valuable insight into the degradation of an intraoperative updating process can be observed when compared to the findings of Dumpuri et al.
Another important contribution of this paper is studying the sensitivity of brain shift compensation to models that include the dural septa. Briefly, the dura, the outermost meningeal layer, reflects inward in four places in the brain forming the falx cerebri, tentorium cerebelli, falx cerebelli, and diaphragma sellae. These strong structures support the brain parenchyma, preventing large deformation in the contralateral hemisphere, hindbrain, and midbrain. Our hypothesis is that with sufficient understanding of the first-order deformation effects in the brain, surface shift measurements in the craniotomy region are sufficient to compensate for volumetric shift. In this paper, it is suggested that the dural septa are crucial components for accurately predicting subsurface shift. To lend rationale, Ferrant et al. found that the greatest subsurface error in their model lied at the midsagittal plane, the location of the rigid membrane, falx cerebri [8]. In their approach to correction, a homogeneous elastic model was used with no accounting of dural septa. Similar reports using intraoperative MR have also shown that relatively little deformation is observed in the regions around the midline, tentorium, and contralateral hemisphere [21]. In previous work by Miga et al. [22], the modeling of the falx cerebri was described and utilized in [19], [20], and [23]. However, no systematic study has been reported that demonstrates the influence of these septa on the performance of intraoperative shift compensation. The goal of this study is to systematically study the effect of the dural septa on subsurface brain shift and assess the need to model these structures within the context of acquired intraoperative shift data in seven cases.
II. Methods
A. Data Acquisition
Preoperative MR tomograms were acquired for seven patients using a 1.5-T clinical scanner a day prior to undergoing tumor surgery. The acquired images were T1 weighted and gadolinium enhanced with voxel size of 1 mm × 1 mm × 1.2 mm. Demographic and other intraoperative information is compiled in Table I. Patient consent was obtained prior to surgery for this Vanderbilt Institutional Review Board approved procedure. After the craniotomy, an optically tracked commercial LRS device (RealScan3D USB, 3D Digital Corporation, Bethel, CT) was used to obtain cortical surface scans immediately after the opening of the dura and after tumor resection.
TABLE I.
Patient Information
| # | Age (yrs), gender | Tumor location | Tumor pathology | Lesion size (cm) | Craniotomy diameter (cm) | Head orientation in the OR |
|---|---|---|---|---|---|---|
| 1 | 22,F | L,F | Gr(II)Olig. | 5.2×6.2×6.0 | 7.7 | IS 90 deg |
| 2 | 52,M | L,F | Astro. | 4.9×5.6×5.0 | 8.3 | IS 90 deg |
| 3 | 58,M | L,P | Met. | 3.7×3.5×4.1 | 4.7 | IS 135 deg |
| 4 | 77,M | L,T | Gr(IV) GBM | 3.4×3.6×2.0 | 5.0 | IS 90 deg |
| 5 | 75,F | L,T | Gr(II) GBM | 5.0×5.0×5.0 | 6.1 | IS 90 deg |
| 6 | 46,M | R,T | Gr(IV) GBM | 3.0×3.0×3.0 | 4.3 | IS 90 deg |
| 7 | 27,M | L,T | Gr(IV) glioma | 6.9×4.0×4.0 | 9.0 | IS 90 deg |
Tumor locations L: left or R: right signify the hemisphere, followed by the lobe—F: frontal, P: parietal, or T: temporal. Tumor pathologies described by the grade (ranging from I to IV) and types—Olig: oligodendroglioma, Astro: astrocytoma, Met: metastatic tumor, and GBM: glioblastoma multiforme. Orientation: IS—Refers to rotation about inferior–superior axis (e.g., IS 90 reflects patient’s head parallel to the floor).
The scanning device shown in Fig. 1 records the cortical surface shape and color texture of the surface that facilitates the intraoperative measurement of brain shift. This has been reported extensively in [15] and [16].
Fig. 1.
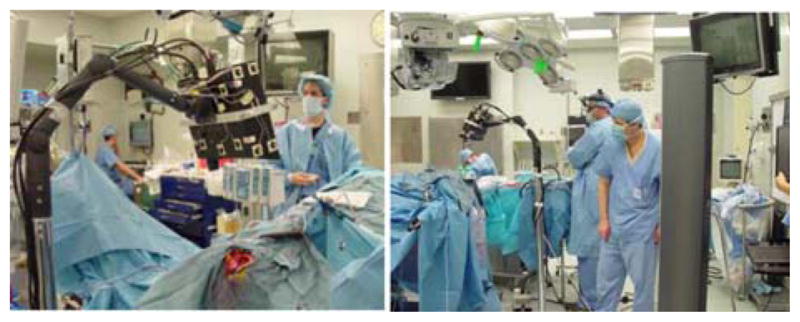
(Left) LRS performing a scan during surgery. (Right) Scanner mounted on arm being tracked by the camera on right.
B. Mesh Construction
Patient-specific meshes were created individually from MR images of the patient. Brain and tumor surfaces were manually segmented and subsequently processed using the marching cube algorithm [24] with a Laplacian smoothing function [25]. Once the surfaces were extracted, a tetrahedral mesh was created [26] that typically consisted of approximately 20 000 nodes and 100 000 tetrahedral elements. An image-to-grid intensity threshold method was then used to classify the brain parenchyma elements into gray and white matter [27].
Falx cerebri and tentorium cerebelli are the two important substructures of the dural septa and different segmentation techniques were used for each of them. The falx was segmented manually and meshed in a manner similar to that described in Miga et al. [22]. Briefly, using the sagittal view of the patient’s image volume, a patient-specific plane is created. This plane is then used to split the tetrahedral domain and then boundary conditions consistent with the constraint of the falx are applied (discussed in greater detail in Section II-C). This procedure is shown in Fig. 2. With respect to the tentorium region, the invagination encloses the straight sinus which is visualized as a high-intensity region in the gadolinium enhanced images. In this region, a limited series of points were selected and a 3-D thin plate spline algorithm was used to morph a plane into a tentorium surface, which was then smoothed. The tentorium cerebelli in the contralateral hemisphere was segmented similarly. Those surfaces were then used to create tentorium structures in the finite-element mesh. This procedure is demonstrated in Fig. 3(a)–(e). The quality of the segmentation was assessed visually by overlaying the tentorium points on the gadoliunium enhanced images as shown in Fig. 3(g). These overlays suggest that the overall patient-specific segmentation of the tentorium is representative for modeling purposes.
Fig. 2.
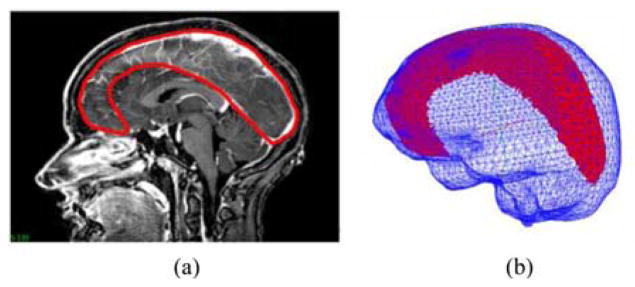
Falx segmentation procedure. (a) Manual periphery drawn around falx on gadolinium-enhanced MRI and (b) segmented falx overlaid with the mesh.
Fig. 3.
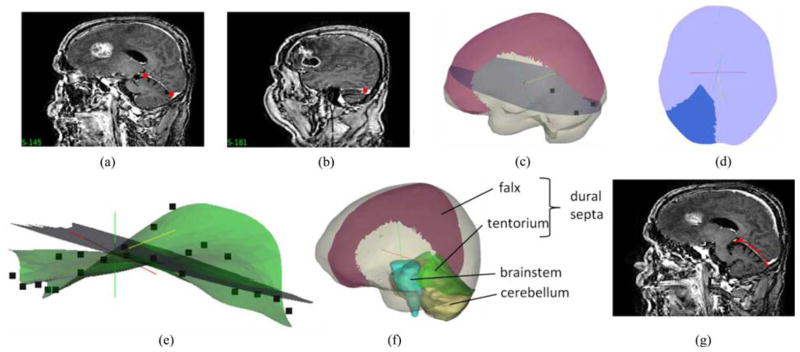
Procedure for tentorium segmentation. (a) and (b) Selection of three points used for clipping a plane in the mesh, (c) clipped plane (with those three points) overlaid with the mesh and the falx, (d) clipped plane segmented into an approximate tentorium shaped structure, and (e) segmented plane with the final tentorium surface created by morphing the plane in (d) using a thin plate spline algorithm. Points on the surface are the target points used to drive the thin plate spline algorithm. (f) Mesh overlaid with the segmented falx and the tentorium surfaces. Segmented brainstem (in blue) and cerebellum (in yellow) shown for reference were not modeled separately. (g) Saggital MRI slices overlaid with the red points of the tentorium surface. Good overlap of the points and the hyperintense region indicate the quality of segmentation.
C. Computational Model and Atlas Generation
The biphasic model proposed by Paulsen et al. was used to model the shift deformations [28]. The model was set up similar to that described in Dumpuri et al. [19] and the details are provided here for completeness. The equations of biphasic consolidation are as follows:
| (1) |
| (2) |
The term u⃗ is the displacement vector, p is the interstitial pressure, G is the shear modulus, ν is the Poisson’s ratio, α is the ratio of fluid volume extracted to volume change of the tissue under compression, ρt is the tissue density, ρf is the fluid density, g is the gravitational unit vector, t is the time, kc is the capillary permeability, pc is the intracapillary pressure, and k is the hydraulic conductivity. The material properties were similar to the ones used in Dumpuri et al. [19] and are listed in Table IV in the Appendix.
The collection of deformations computed using different driving conditions for the model is termed an atlas. The atlas was constructed for two kinds of deformation: deformation caused by gravity and deformation caused by mannitol, a hyperosmolar drug administered prior to surgery to reduce intracranial pressure. The boundary conditions used for building the atlases are described in [20]. For the aforementioned two deformation types, three different displacement boundary conditions were used-–fixed, stress free, and slippage. The brainstem experiences no deformation and is assigned fixed Dirichlet boundary conditions. The highest region on the head, according to the head orientation, is designated to be stress free. All other nodes on the boundary, including the internal boundaries (the dural septa), are assigned slip boundary conditions, that is, they cannot move in the normal direction, but movement in the tangential direction is permitted. The demarcation between the stress free and slippage region is done according to the head orientation, the demarcating plane is perpendicular to the direction of gravity, and level is set empirically. The pressure boundary conditions were set by the presumed level to which cerebrospinal fluid has drained during the procedure. With respect to our methods, multiple fluid drainage levels are included as part of the deformation atlas strategy described by Dumpuri et al. in [20]. The nodes exposed to atmospheric pressure are set as a Dirichlet boundary condition and the nodes submerged in fluid are subject to Neumann boundary conditions, i.e., nondraining surfaces. In order to build the atlas, for each patient, 60 different head orientations were used (three of which are represented in the columns of Fig. 4). Since the entire head is draped except for the craniotomy region, it makes it challenging to ascertain the exact head orientation. An approximation of the head orientation can be obtained from the surgeon’s preoperative plan. From that base orientation, vectors can be populated around that base orientation to deal with the various changes to OR patient configuration (e.g., in our experience, the surgeon can often elect to change bed tilt and even roll during a case). Tissue resection was simulated by decoupling nodes belonging to tumor material type. For the gravity deformations, three different fluid drainage levels were used, counting for mesh with and without tumor resection, resulting in 360 solutions. For mannitol-induced deformations, three different capillary permeability values were used with the 60 head orientations, also resulting in 360 different solutions in the atlas. This resulted in a combined atlas with 720 gravity and mannitol concatenated solutions. In addition, the deformations were further investigated with the construction of two atlases for shift compensation use, one that contained the dural septa and one that did not.
Fig. 4.
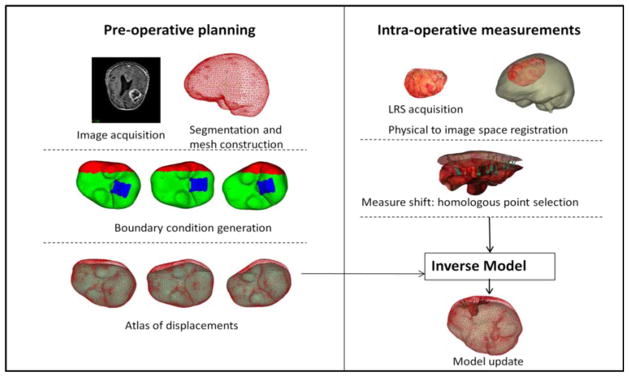
Schematic showing the overall procedure for model updated image-guided neurosurgery. Workflow is broadly divided into preoperative and intraoperative phases. Most time intensive steps are done in the preoperative phase, i.e., image segmentation and mesh construction. Boundary conditions for each deformation type and generation of model solutions to form the atlas are also done preoperatively. Some representative displacement boundary conditions are shown—with blue region being the fixed brainstem, red represents the stress free region, and green the slippage boundary conditions. Dural septa (not shown in the figure) are included in the model by assigning them the slippage boundary condition. Intraoperative phase consists of sparse data collection (laser range scans), registration of those scans to image space and obtaining measured shift through homologous points on the pre- and postresection scans. In the last step, those measurements are used to fit the displacement atlas using an inverse model to obtain the final model updated results.
D. Inverse Model
Although this is a retrospective study, all the atlas construction work listed aforementioned would be part of the preoperative planning and would be performed prior to surgery. Intraoperatively, the atlas that was built prior to surgery would be used to solve the inverse model, driven by sparse data, i.e., LRS data collected during surgery. Since model solutions are performed preoperatively, the intraoperative compensation is very fast and takes into account the variability within the OR (e.g., uncertain cerebrospinal fluid (CSF) drainage levels, varying head orientations as a patient’s bed is rotated, etc.). For the correction process, two LRS scans need to be acquired: one after opening of the dura and another one after shift has occurred. The scanner is tracked during the acquisition of the textured point clouds, and hence, the two scans can easily be registered in the same physical space. These two surfaces are registered to the preoperative MR images using constrained surface mutual information algorithm discussed in Cao et al. [15]. The schematic of the entire process is shown in Fig. 4. Homologous points are then selected on both the LRS surfaces and these sparse displacements are used to drive the inverse model as described later.
The displacement solutions computed earlier are compiled into an atlas. Since the true deformation over the entire domain is unknown, only sparse comparisons can be evaluated. An inverse solution is obtained by the minimization of least-squared error between the predictions and the measurements. However, this would result in an ill-posed problem since the number of atlas solutions far exceeds the number of sparse homologous points. This can be resolved by constraining the problem as done in [29], resulting in the following equation:
| (3) |
The atlas matrix M consists of 3ns rows and m columns. Here, “ns” is the number of sparse points or previously computed homologous points on the LRS surfaces, where the deformation is known from tracking the pre- and postresection LRS, with each point having a displacement solution in the Cartesian x, y, and z directions. usparse is a 3ns vector of those measured displacements.
This method is different than what was reported by Dumpuri et al. in [20] where no constraints were applied. The first constraint ensures that all the weighting coefficients are positive. Hence, if a solution in an atlas deforms in the incorrect direction, the objective function would weigh that solution lower instead of assigning a higher negative regression coefficient. The second constraint prevents the solutions from being extrapolated, which can cause inaccuracies in the predicted displacements in the far field. The implementation of the method of Lagrange multipliers in the optimization toolbox of MATLAB (Mathworks Inc.) was used to solve this linear optimization problem. This is in contrast to the Dumpuri et al. technique which used a Tikhonov-like regularization approach. While the analysis by Dumpuri et al. using pre- and post-MR data did not reflect far-field inaccuracies in the displacements, this was not found to be the case when using the larger and more considerable dynamic shift data from the intraoperative environment.
III. Results
Shift was measured across seven cases through homologously selected points on registered pre- and postresection LRS images. The average and maximum magnitude of measured shifts for each of the patients at the homologous points are listed in Table II. For completeness, the measurements of shift as provided by the pre- and post-MR study by the Dumpuri et al. study [20] are provided for reference.
TABLE II.
Average and Maximum Measured Intraoperative Displacements
| # | Number of measurement points | Intraoperative LRS: average shift ± standard deviation (maximum) in mm | Postoperative MR: average shift ± standard deviation (maximum) in mm from [20] |
|---|---|---|---|
| 1 | 16 | 22.9±6.3 (28.9) | 8.2±2.2 (12.2) |
| 2 | 22 | 14.3±5.1 (29.1) | 9.2±1.3 (11.6) |
| 3 | 24 | 6.8±2.4 (10.5) | - |
| 4 | 18 | 8.6±0.6 (9.7) | 5.4±0.9 (7.0) |
| 5 | 22 | 13.0±2.1 (15.9) | 5.3±0.8 (6.8) |
| 6 | 17 | 8.6±2.0 (13.2) | 5.3±0.9 (7.1) |
| 7 | 15 | 8.8±2.0 (12.1) | - |
Measured shift from pre- and postoperative MR analysis from [20] is also listed for comparison. The analysis was unavailable for Patients 3 and 7.
Percentage shift correction was measured using the formulation listed in [19].
| (4) |
In (4), shift error is the error in measured and estimated points. The average shift correction for the mesh without the inclusion of the dural septa is 68 ± 17% and for the mesh with the septa is 75 ± 12%. In order to determine if there was a statistically significant difference in the shift corrections predicted by using the mesh with or without the dural septa, paired testing was performed. The expected value and variance were unknown due to the small sample size; hence, the Lilliefors test was used to determine whether the distribution was normal [30]. The test supported the hypothesis that the intraoperative data for both the models, with and without the dural septa, followed a normal distribution (p > 0.05) and hence the student t-test was used for the paired comparison. The results of the student t-test indicated that there was no statistical difference (p > 0.05) between the reconstructed atlas solutions for the mesh with or without dural septa.
For completeness, the shift recoveries obtained from the pre-and postoperative MR analysis [20] are also shown in Fig. 5 for the corresponding patients. That data was available for five of the seven cases. The average shift correction across the five cases was 85 ± 1%. It is evident that larger shift recovery was obtained with the post-operative MR data as compared to the intraoperative data. The variance amongst cases was also smaller for the post-operative MR data.
Fig. 5.
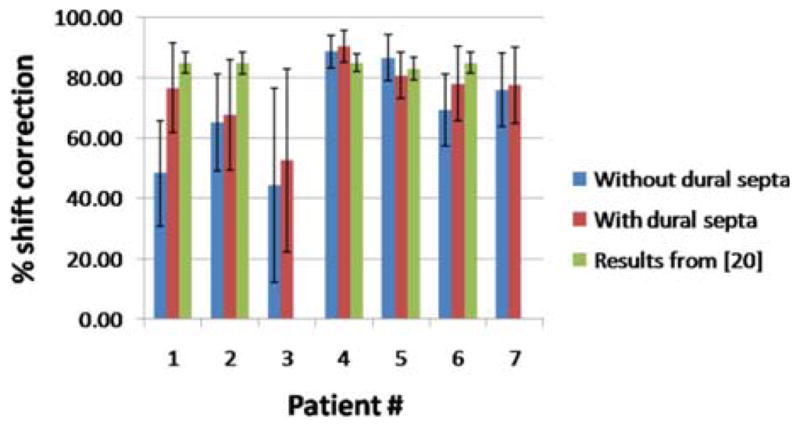
Shift recoveries for seven patient cases for meshes with and without dural septa. Also shown are the shift recoveries obtained for the corresponding pre- and postoperative MR data reported in [20]. That analysis was unavailable for patients 3 and 7.
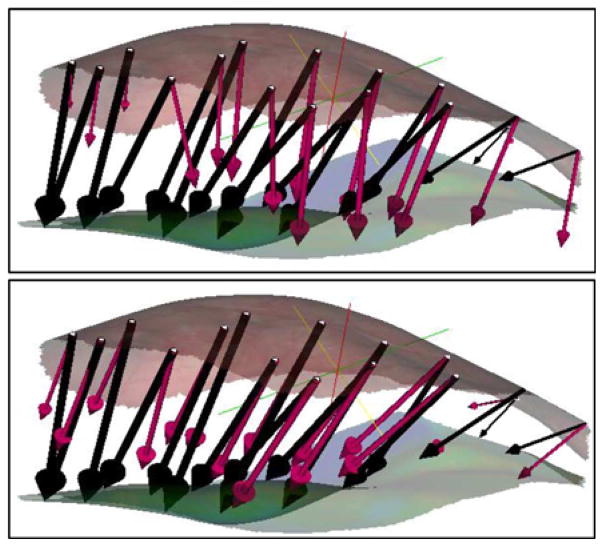
Patients 1 and 3 in Fig. 5 were noteworthy for the large difference in shift correction between the septa and septa-free models and the smallest shift correction overall, respectively. These two patient cases are discussed in greater detail. Whereas the average difference in percent shift correction in the remaining six patient cases for the mesh with and without the dural septa was 5 ± 3%, the difference in shift correction for the Patient 1 was 28%. The average error in magnitude for the measurement points for the mesh without dural septa was 11.5 ± 4.9 mm and for the mesh with the septa was 5.4 ± 3.9 mm. The average angular error was 21.0 ± 11.4° and 7.1 ± 6.2°, respectively. The measurement vectors and the predicted vectors for the two models are shown in Fig. 6. Though deformation magnitudes (as opposed to the magnitude of the error vector) were similar for both cases, the angular error was much larger for the mesh without dural septa.
Fig. 6.
Measured shift vectors (black) and predicted shift vectors (magenta) for the concatenated atlas using the method of constraints for above: model without dural septa and below: model with dural septa. Vectors are overlaid with the preresection (top) and postresection (bottom) LRS surfaces.
Patient 3 had the lowest overall shift correction. The average error in magnitude for the measurement points for the mesh without septa was 3.4 ± 1.9 mm and for the mesh with septa was 3.1 ± 2.2 mm. The average angular error was 31.9 ± 24.9° (maximum of 96.0°) and 25.3 ± 24.8° (maximum of 85.2°), respectively. Fig. 7(a) shows the overlay of the undeformed mesh with the postresection LRS surface and the measured displacement vectors on the selected points. The tumor was located in the parietal lobe and the patient was in prone position in the OR, with their head tilted approximately 45° to the dorsal–ventral axis. The selected points for shift measurement could be divided into three distinct clusters (marked I, II, and III in the figure) based on their location and direction of movement. All three clusters were moving toward the center of the resection hole. In the plane that it is being viewed, region I points slide along the falx, region II points move downwards toward the bottom of the plane, and region III almost moves inward into the plane. Fig. 7(b) shows the predicted vectors for the concatenated atlas for the mesh without septa and Fig. 7(c) shows the same for the mesh with septa. The movement toward the center of the hole was not well modeled with the current boundary conditions and is focus of future work. The average angular and magnitude error for each of the regions for both models are summarized in Table III.
Fig. 7.
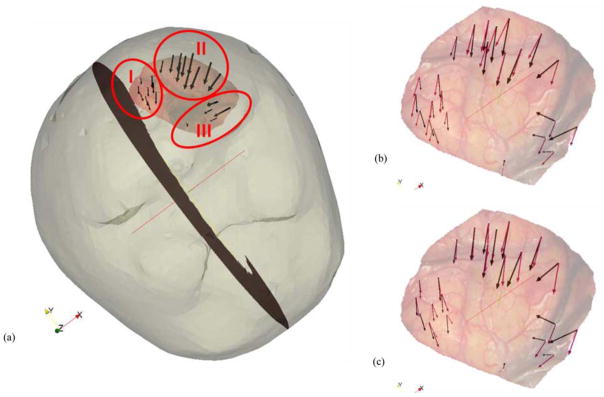
(a) Mesh surface overlaid with the postresection LRS and measurement vectors. The homologous points are divided into three different regions: I, II, and III. Preresection LRS overlaid with the measurement vectors and the predicted vectors for the (b) model without dural septa and (c) model with dural septa for the concatenated atlas.
TABLE III.
Errors in Magnitude and Angle for the Two Models Using the Method of Constraints for the Concatenated Atlas
| Mesh without dural septa | Mesh with dural septa | |||
|---|---|---|---|---|
| Magnitude (mm) | Angle (degrees) | Magnitude (mm) | Angle (degrees) | |
| I | 2.5±0.6 | 29.2±11.1 | 1.8±0.6 | 13.7±8.6 |
| II | 2.9±1.5 | 13.4±9.9 | 2.9±2.0 | 15.1±12.8 |
| III | 6.0±1.9 | 71.0±19.8 | 5.8±2.4 | 66.6±18.9 |
I, II, and III represent the three regions for selected points shown in Fig. 7(a).
In general, in both cases, angular error is highest for region III. The applied forces (pressure gradients or gravity) to the model pull the tissue downward while the resection forces pull the tissue inward. The latter effect is not captured well by the model. There is no statistical difference in the angular error for regions II and III (p > 0.05). However, region I points have considerably less angular error for the mesh with the dural septa than the one without (p < 0.05). Region I points are most proximal to the falx, and the sliding along the falx plane is captured by the mesh where the falx is accounted for in the model. A slice of the model-deformed image for each model for Patients 1 and 3 is shown in Fig. 8. Fig. 8(a) and (b) shows the mesh without and with the septa, respectively, for Patient 1. The hyperintense regions in the center of the image represent the sinus enclosed in the falx cerebri. For the mesh without the septa, there is considerable movement in the position of the falx, whereas the midline remains steady for the mesh with the septa. The overall subsurface shift prediction for the mesh with and without the dural septa is noticeably different for this case. Fig. 8(c) and (d) shows the images updated with the inverse solution for both models, respectively, for Patient 3. Similar to Patient 1, movement is seen along the midline region along falx and the tentorium in the mesh without the septa whereas those regions do not move as much where the dural septa were modeled. The movement in the midline is greater for Patient 1 without dural septa than for Patient 3 without septa because the overall shift is much higher. During surgery, the vicinity of the tumor would be the region of greatest interest for the surgeon and accuracy of the guidance system in that region would be most critical. To examine the difference in subsurface shift caused by the introduction of dural septa in the model, color-coded vector differences in the shift predictions of the tumor boundaries for the two models are shown in Fig. 9. Each row shows two different views for a different patient dataset—Patient 2 in the top row and Patient 4 in the bottom row. As seen in Patient 2, the subsurface differences can be as large as 9 mm. As is the case for comparison presented in Fig. 8, the difference in the magnitude of shift prediction is higher when overall measured shift was larger. Also, in each case, the largest magnitude of difference in shift prediction is seen at the bottom of the tumor cavity, away from the brain surface.
Fig. 8.
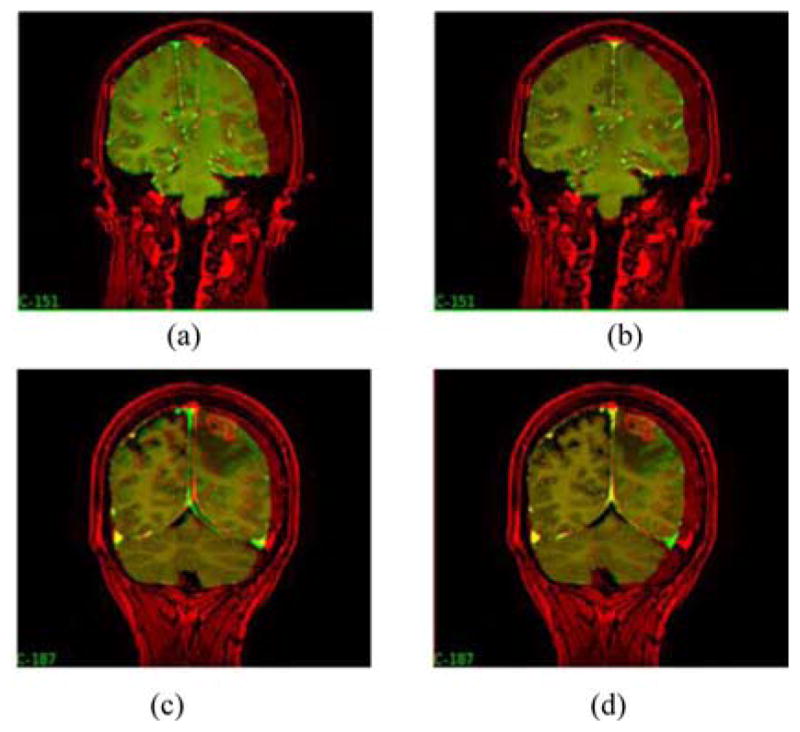
Preoperative image (red) overlaid with model-deformed image (green) for the model without dural septa, (a) and (c), and the model with dural septa, (b) and (d). (a) and (b) Results for Patient 1, and (c) and (d) results for Patient 3.
Fig. 9.
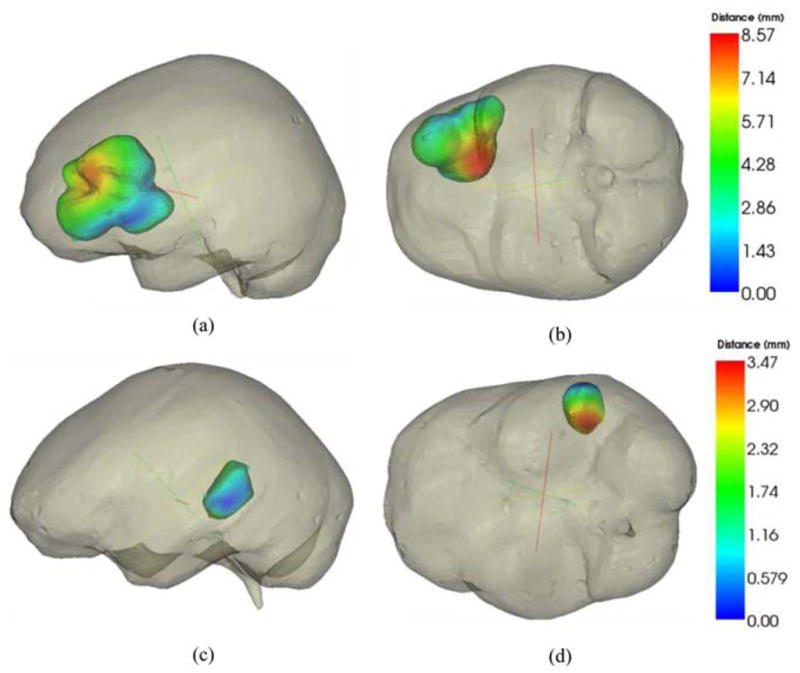
Color-coded vector difference in predicted displacements for model with and without the dural septa. Top row figures are representation for Patient 2 and lower row is representation for Patient 4. Two different camera angles have been shown for each patient for better visual clarity.
IV. Discussion
The fidelity of an intraoperative guidance system in neurosurgery is compromised due to shift in the OR caused by various factors such as gravity, hyperosmolar drugs, and edema. A considerable body of work in the literature has focused on solving this problem through intraoperative imaging or updating pre-operative images with mathematical models. This paper builds upon the earlier work of Dumpuri et al. [19], [20], where an atlas of solutions was used in order to compensate for the inherent uncertainty in the OR. That work was validated using postoperative MR scans and this study explores some differences between postoperative and intraoperative data. A novel model employing the two major dural membranes—falx cerebri and tentorium cerebelli—was described and systematically studied in this paper. No statistical difference was observed in the overall surface shift correction when comparing the results for the mesh with and without the dural septa. However, when the dural septa are accounted for in the model, the subsurface deformations are in greater compliance with the observations made in the previous literature. This point while subtle is quite important. The results of our statistical test comparing percent surface correction in Fig. 5 indicate that the fitting process with or without the septa is statistically the same. This does not state that difference in subsurface shift is negligible, in fact quite the contrary in light of Fig. 9. This emphasizes that for our hypothesis to be true, in practice, accurate modeling is important. Based on the literature, Maurer et al. [21] observed that the deformation was very small in the midline, tentorial, and contralateral hemisphere regions, and Ferrant et al. [8] noted that the largest errors in model predictions were seen in the midline region. Our dural septa models are consistent with these findings. The lack of intraoperative MR data makes it difficult to perform a more quantitative comparison of the subsurface shift across all cases. However, the analyses presented in Fig. 7(b) and (c) and Table III as well as the qualitative results presented in Fig. 9 strongly support the need to account for the septa in the model.
Some interesting differences were observed between the postoperative MR results reported by Dumpuri et al. [20] and the intraoperative results presented in this paper. Dumpuri et al. reported an average shift correction of 85% across eight patient cases (ranging from 83% to 89%). In this work, the average shift correction across seven patient cases was 75% (ranging from 53 to 90%) for the mesh with dural septa. The reason for better shift correction in postoperative MR analysis could be the nature of the data. The postoperative MR images were acquired a day or two after surgery and some shift recovery occurred during that period and thus the measured shift magnitudes presented were smaller when compared to the intraoperative measurements presented in this paper. This can be seen by comparing the magnitude of the measured shift for intraoperative LRS data and postoperative MR data in Table II that demonstrates recovery ranges between 35% and 65%. The correlation between measured deformation magnitude and shift correction was to some extent observed within the intraoperative data as well. The inclusion of dural septa in the model has a larger impact on the predicted results if the observed shift was larger. For instance, in Fig. 8, there was a more dramatic movement along the midsagittal region in the case with the larger measured shift. In Fig. 9, the difference in predicted shift was larger between the model with and without the dural septa for the case with larger measured shift as well. The intraoperative data also reflect more dynamic interactions such as tissue resection. The postoperative data might yield better results because they do not have the irregularities caused by local effects nor the considerably larger extent of shift. The cases with the best shift correction had the smallest variation within the measurement vectors, i.e., they were of similar magnitude, moving uniformly in one direction. Patient 3 had a large variability and performed poorly with shift correction whereas Patient 4 had a smaller variability in measurements and performed quite well with the shift prediction. The results presented suggest that more considerable resection holes affect the angular variability of shift and provide impetus for a more accurate tissue resection model. Our current strategy to simulate tissue resection involves decoupling the tumor nodes in the mesh to reproduce the effect of cavity collapse. However, qualitative results such as those presented in Table III and Fig. 7 indicate the need for a better strategy. In our future work, we plan to explore other strategies to better account for resection forces.
Another interesting difference between the postoperative data and the intraoperative data is the contributions from various mechanisms in the atlas. The concatenated atlas in the work of Dumpuri et al. was formed from three different atlases: 1) tumor being resected and gravity alone causing the shift; 2) tumor being resected and mannitol alone causing the shift; and 3) tumor being present and having a swelling effect, and the rest of the brain parenchyma under the effect of mannitol. The contribution of these atlases to the overall solution was 45%, 46%, and 9%, respectively, with similar distributions being observed across all patients. For the intraoperative data reconstructions presented here, the averaged distributions of the weighting coefficients between the gravity and mannitol solutions across all solutions are 16 and 84%, respectively. Fig. 10 is an example from three patients. For four of the seven cases, the mannitol solutions exclusively contributed to the reconstructed solution. For two cases, mannitol solutions were the major contributors and for the last case, gravity was the major contributor. Intraoperatively, while more variability is illustrated, the reconstructed solutions weigh the mannitol solutions more in six of the seven cases than the analysis in [20]. In addition, the magnitude of the regression coefficients was comparatively smaller in the gravity atlas. In the OR environment, various forces-–gravity, mannitol, edema, tissue resection—act concurrently on the brain and it is difficult to sequester the contribution of each of these forces individually. In some respect, the results presented here agree with intuition. Given that mannitol is administered just prior to opening the dura in significant dosages to decompress the brain, shortly thereafter, tissue manipulation occurs to visualize the tumor, and generation of a resection hole and possible collapsing of surrounding tissue then follows, it is not surprising that mannitol plays a more considerable role in the regression coefficients, and that the variability in these coefficients across patients is much more distributed. The Dumpuri et al. study also reported a contribution from mannitol but not to the degree this study does. In this study, the magnitude of deformations intraoperatively could just not be matched by a model experiencing CSF drainage only. This could be due to the manner in which it is modeled but the results of a more pronounced reliance on mannitol-based regression coefficients for the intraopertive environment are consistent with surgical practice and would seem to speak to its influence in the reconstruction.
Fig. 10.

Distribution of weighting coefficients for the gravity and mannitol solutions for patients 1, 4, and 7 obtained by optimizing the least-squared error in intraoperative data.
V. Conclusion
A retrospective study of correcting brain shift using sparse intraoperative LRS data to drive a finite-element model-based atlas was presented in this paper. The method corrects for an average of 75% of the brain shift caused by various factors in the OR. While intraoperative MR imaging was not available, the results were consistent with a pre- and post-MR validation study conducted previously. When comparisons to a previous study were made, it was found that the intraoperative data contained far more dynamic interactions such as collapse due to tissue resection and considerably larger deformation. It was found that guiding shift compensation with surface data only requires a model that incorporates neuroanatomical subsurface structures such as the dural septa. Lastly, to our knowledge, the apparent need for the modeling of hyperosmotic drugs to account for intraoperative shift is a unique finding by our team. These results were found within the pre- and post-MR analysis by Dumpuri et al. and are further confirmed here for the intraoperative environment.
Acknowledgments
This work was supported in part by the National Institutes of Health (NIH)—National Institute for Neurological Disorders and Stroke under Grant R01 NS049251-01A4.
The authors would like to thank the resident surgeons, the operating room staff, and the Department of Radiology, Vanderbilt University, Nashville, TN, for their help in data collection. Most of the visualization algorithms were developed using Visualization Toolkit (http://www.vtk.org). Some segmentation and calculations were performed using Analyze AVW Version 9.0.
Appendix
The material properties in (1) and (2) are listed as following.
Table IV.
Material Properties
| Symbol | Value | Units |
|---|---|---|
| Ewhite, Egray | 2100 | N/m2 |
| Etumor | 100,000 | N/m2 |
| ν | 0.45 | no units |
| ρt | 1000 | kg/m3 |
| ρt | 1000 | kg/m3 |
| g | 9.81 | m/s2 |
| α | 1.0 | no units |
| I/S | 0.0 | no units |
| kwhite | 1×10⁻¹⁰ | m3s/kg |
| kgray | 5×10⁻¹² | m3s/kg |
| Kc1, white* | 2.3×10⁻⁹ | Pa/s |
| Kc2, white* | 4.6×10⁻⁹ | Pa/s |
| Kc3, white* | 6.9×10⁻⁹ | Pa/s |
| Kc1, gray* | 11.5×10⁻⁹ | Pa/s |
| Kc2, gray* | 23.0×10⁻⁹ | Pa/s |
| Kc3, gray* | 34.5×10⁻⁹ | Pa/s |
| pc | −3633 | Pa |
These values were used to simulate three different capillary permeability values resulting from the administration of mannitol.
Footnotes
Color versions of one or more of the figures in this paper are available online at http://ieeexplore.ieee.org.
Contributor Information
Ishita Chen, Email: ishita.chen@vanderbilt.edu, Department of Biomedical Engineering, Vanderbilt University, Nashville, TN 37235 USA.
Aaron M. Coffey, Email: aaron.coffey@vanderbilt.edu, Vanderbilt University Institute of Imaging Science, Vanderbilt University, Nashville, TN 37232 USA
Siyi Ding, Email: siyi.ding@vanderbilt.edu, Department of Electrical Engineering, Vanderbilt University, Nashville, TN 37232 USA.
Prashanth Dumpuri, Email: prashanthd@pathsurg.com, Pathfinder Therapeutics, Inc., Nashville, TN 37204 USA.
Benoit M. Dawant, Email: benoit.dawant@vanderbilt.edu, Department of Electrical Engineering, Vanderbilt University, Nashville, TN 37232 USA.
Reid C. Thompson, Email: reid.c.thompson@vanderbilt.edu, Department of Neurological Surgery, Vanderbilt University, Nashville, TN 37232 USA
Michael I. Miga, Email: michael.i.miga@vanderbilt.edu, Department of Biomedical Engineering, Vanderbilt University, Nashville, TN 37235 USA.
References
- 1.Nimsky C, Ganslandt O, Cerny S, Hastreiter P, Greiner G, Fahlbusch R. Quantification of, visualization of, and compensation for brain shift using intraoperative magnetic resonance imaging. Neurosurgery. 2000 Nov;47(5):1070–1079. doi: 10.1097/00006123-200011000-00008. [DOI] [PubMed] [Google Scholar]
- 2.Roberts DW, Hartov A, Kennedy FE, Miga MI, Paulsen KD. Intraoperative brain shift and deformation: A quantitative analysis of cortical displacement in 28 cases. Neurosurgery. 1998 Oct;43(4):749–758. doi: 10.1097/00006123-199810000-00010. [DOI] [PubMed] [Google Scholar]
- 3.Kelly PJ. Intraoperative brain shift and deformation: A quantitative analysis of cortical displacement in 28 cases— Comment. Neurosurgery. 1998 Oct;43(4):759–759. doi: 10.1097/00006123-199810000-00010. [DOI] [PubMed] [Google Scholar]
- 4.Butler WE, Piaggio CM, Constantinou C, Nikalson L, Gonzales RG, Cosgrove GR, Zervas NT. A mobile computed tomographic scanner with intraoperative and intensive care unit applications. Neurosurgery. 1998;88(4):1304–1310. doi: 10.1097/00006123-199806000-00064. [DOI] [PubMed] [Google Scholar]
- 5.Letteboer MMJ, Willems PWA, Viergever MA, Niessen WJ. Brain shift estimation in image-guided neurosurgery using 3-D ultrasound. IEEE Trans Biomed Eng. 2005 Feb;52(2):268–276. doi: 10.1109/TBME.2004.840186. [DOI] [PubMed] [Google Scholar]
- 6.Hata N, Dohi T, Warfield S, Wells W, III, Kikinis R, Jolesz FA. Multimodality deformable registration of pre- and intraoperative images for MRI-guided brain surgery. Proc 1st Int Conf Med Image Computing Comput-Assisted Intervention. 1998;1496:1067–1074. [Google Scholar]
- 7.Hagemann A, Rohr K, Stiehl HS, Spetzger U, Gilsbach JM. Biomechanical modeling of the human head for physically based, non-rigid image registration. IEEE Trans Med Imag. 1999 Oct;18(10):875–884. doi: 10.1109/42.811267. [DOI] [PubMed] [Google Scholar]
- 8.Ferrant M, Nabavi A, Macq BT, Jolesz FA, Kikinis R, Warfield SK. Registration of 3-D intraoperative MR images of the brain using a finite-element biomechanical model. IEEE Trans Med Imag. 2001 Dec;20(12):1384–1397. doi: 10.1109/42.974933. [DOI] [PubMed] [Google Scholar]
- 9.Wittek A, Miller K, Kikinis R, Warfield SK. Patient-specific model of brain deformation: Application to medical image registration. J Biomech. 2007;40(4):919–929. doi: 10.1016/j.jbiomech.2006.02.021. [DOI] [PubMed] [Google Scholar]
- 10.Clatz O, Delingette H, Talos IF, Golby AJ, Kikinis R, Jolesz F, Ayache N, Warfield S. Robust non-rigid registration to capture brain shift from intraoperative MRI. IEEE Trans Med Imag. 2005 Nov;24(11):1417–1427. doi: 10.1109/TMI.2005.856734. [DOI] [PMC free article] [PubMed] [Google Scholar]
- 11.Skrinjar O, Nabavi A, Duncan J. Model-driven brain shift compensation. Med Image Anal. 2002 Dec;6(4):361–373. doi: 10.1016/s1361-8415(02)00062-2. [DOI] [PubMed] [Google Scholar]
- 12.Sun H, Roberts DW, Farid H, Wu Z, Hartov A, Paulsen KD. Cortical Surface Tracking Using a Stereoscopic Operating Microscope. Neurosurgery. 2005;56(1):86–97. doi: 10.1227/01.neu.0000146263.98583.cc. [DOI] [PubMed] [Google Scholar]
- 13.Audette MA, Siddiqi K, Ferrie FP, Peters TM. An integrated range-sensing, segmentation and registration framework for the characterization of intra-surgical brain deformations in image-guided surgery. Comput Vision Image Understanding. 2003 Feb-Mar;89(2–3):226–251. [Google Scholar]
- 14.Sinha TK, Miga MI, Cash DM, Weil RJ. Intraoperative cortical surface characterization using laser range scanning: Preliminary results. Neurosurgery. 2006;59(4):368–376. doi: 10.1227/01.NEU.0000222665.40301.D2. [DOI] [PMC free article] [PubMed] [Google Scholar]
- 15.Cao A, Thompson RC, Dumpuri P, Dawant BM, Galloway RL, Ding S, Miga MI. Laser range scanning for image-guided neurosurgery: Investigation of image-to-physical space registrations. Med Phys. 2008;35(4):1593–1605. doi: 10.1118/1.2870216. [DOI] [PMC free article] [PubMed] [Google Scholar]
- 16.Sinha TK, Dawant BM, Duay V, Cash DM, Weil RJ, Miga MI. A method to track cortical surface deformations using a laser range scanner. IEEE Trans Med Imag. 2005 Jun;24(6):767–781. doi: 10.1109/TMI.2005.848373. [DOI] [PMC free article] [PubMed] [Google Scholar]
- 17.Ding S, Miga MI, Noble JH, Cao A, Dumpuri P, Thompson RC, Dawant BM. Semiautomatic registration of pre- and postbrain tumor resection laser range data: method and validation. IEEE Trans Biomed Eng. 2009 Mar;56(3):770–780. doi: 10.1109/TBME.2008.2006758. [DOI] [PMC free article] [PubMed] [Google Scholar]
- 18.Paul P, Morandi X, Jannin P. A surface registration method for quantification of intraoperative brain deformations in image-guided neurosurgery. IEEE Trans Inf Technol Biomed. 2009 Nov;13(6):976–983. doi: 10.1109/TITB.2009.2025373. [DOI] [PubMed] [Google Scholar]
- 19.Dumpuri P, Thompson RC, Dawant BM, Cao A, Miga MI. An atlas-based method to compensate for brain shift: Preliminary results. Med Image Anal. 2006;11(2):128–145. doi: 10.1016/j.media.2006.11.002. [DOI] [PMC free article] [PubMed] [Google Scholar]
- 20.Dumpuri P, Thompson RC, Cao A, Ding S, Garg I, Dawant BM, Miga MI. A fast efficient method to compensate for brain shift for tumor resection therapies measured between preoperative and postoperative tomograms. IEEE Trans Biomed Eng. 2010 Jun;57(6):1285–1296. doi: 10.1109/TBME.2009.2039643. [DOI] [PMC free article] [PubMed] [Google Scholar]
- 21.Maurer CR, Hill DLG, Martin AJ, Liu H, McCue M, Rueckert D, Lloret D, Hall WA, Maxwell RE, Hawkes DJ, Truwit CL. Investigation of intraoperative brain deformation using a 1.5 T interventional MR system: preliminary results. IEEE Trans Med Imag. 1998 Oct;17(5):817–825. doi: 10.1109/42.736050. [DOI] [PubMed] [Google Scholar]
- 22.Miga MI, Paulsen KD, Kennedy FE, Hartov A, Roberts DW. Model-updated image-guided neurosurgery using the finite element method: Incorporation of the falx cerebri. Med Image Comput Comput-Assisted Intervention, Lecture Notes Comput Sci. 1999;1679:900–909. doi: 10.1007/10704282_98. [DOI] [PMC free article] [PubMed] [Google Scholar]
- 23.Garg I, Ding S, Coffey AM, Dumpuri P, Thompson RC, Dawant BM, Miga MI. Enhancement of subsurface brain shift model accuracy: a preliminary study. SPIE Med Imag 2010: Vis, Image-Guided Procedures, Model. 2010;7625:76250 J. [Google Scholar]
- 24.Lorensen WE, Cline HE. Marching cubes: A high resolution 3D surface construction algorithm. Int Conf Comput Graphics Interactive Tech (SIGGRAPH) Comput Graph. 1987;21(4):163–169. [Google Scholar]
- 25.Schroeder WJ, Martin KM, Lorensen WE. Visualization Toolkit: An Object-Oriented Approach to 3D Graphics. 3. Albany, NY: Kitware, Inc; 2003. pp. 331–334. [Google Scholar]
- 26.Sullivan JM, Charron G, Paulsen KD. A three-dimensional mesh generator for arbitrary multiple material domains. Finite Elements Anal Des. 1997;25(3–4):219–241. [Google Scholar]
- 27.Miga MI, Paulsen KD, Kennedy FE, Hoopes PJ, Hartov A, Roberts DW. In vivo analysis of heterogeneous brain deformation computations for model-updated image guidance. Comput Methods Biomech Biomed Eng. 2000;3(2):129–146. doi: 10.1080/10255840008915260. [DOI] [PubMed] [Google Scholar]
- 28.Paulsen KD, Miga MI, Kennedy FE, Hoopes PJ, Hartov A, Roberts DW. A computational model for tracking subsurface tissue deformation during stereotactic neurosurgery. IEEE Trans Biomed Eng. 1999;46(2):213–225. doi: 10.1109/10.740884. [DOI] [PubMed] [Google Scholar]
- 29.Dumpuri P, Chen RC, Miga MI. Model updated image guidance: A statistical approach. Lecture Notes Comput Sci: Med Image Comput Comput-Assisted Intervention (MICCAI) 2003;2879(1):375–382. doi: 10.1007/978-3-540-39899-8_47. [DOI] [PMC free article] [PubMed] [Google Scholar]
- 30.Sheskin DJ. Handbook of Parametric and Nonparametric Statistical Procedures. 2. Boca Raton, FL: CRC Press; 2000. pp. 142–143. [Google Scholar]


