

Abstract
We present a modular, high performance, open-source database system that incorporates popular neuroimaging database features with novel peer-to-peer sharing, and a simple installation. An increasing number of imaging centers have created a massive amount of neuroimaging data since fMRI became popular more than 20 years ago, with much of that data unshared. The Neuroinformatics Database (NiDB) provides a stable platform to store and manipulate neuroimaging data and addresses several of the impediments to data sharing presented by the INCF Task Force on Neuroimaging Datasharing, including 1) motivation to share data, 2) technical issues, and 3) standards development. NiDB solves these problems by 1) minimizing PHI use, providing a cost effective simple locally stored platform, 2) storing and associating all data (including genome) with a subject and creating a peer-to-peer sharing model, and 3) defining a sample, normalized definition of a data storage structure that is used in NiDB. NiDB not only simplifies the local storage and analysis of neuroimaging data, but also enables simple sharing of raw data and analysis methods, which may encourage further sharing.
Keywords: Database, Neuroinformatics, Neuroimaging, Pipeline
Introduction
Since the introduction of functional magnetic resonance imaging (fMRI) as a tool for neuroscience research nearly 20 years ago, numerous hospitals, universities, and small labs have collected fMRI data along with an increasingly diverse set of neuroimaging modalities. These data are sometimes unanalyzed, and often unshared. Until 2005, with the introduction of XNAT, no wide-spread open-source databases were available to the neuroscience community to organize these datasets (Marcus et al. 2005). Many analysis tools were available as open-source software, freely downloadable by users, and possessing an active user and development community, such as SPM, FSL, and AFNI, but this was not the case for data storage systems (Cox 1996; Frackowiak 1997; Jenkinson et al. 2012). The lack of databases was partly due to user focus on analysis methods over the organization of the data, and partly due to the complex and heterogeneous nature of neuroimaging data. Once sample sizes began to increase, the need arose for better storage and automated analysis systems. Most databases were, and still are, homegrown by laboratories needing to manage their own data. These systems are often highly customized to a site's particular data and to the preferences of the labs that built the systems. Multi-site studies needed common databases to manage the data, and these were also often home-grown systems specific to the study under which they were developed. Since XNAT's release, there are now a few large players in the neuroimaging database community such as LORIS, HID, and COINS (Marcus et al. 2005; Das et al. 2011; Marcus et al. 2007; Scott et al. 2011; Keator et al. 2008). Only XNAT, HID and LORIS are open-source, and none are as ubiquitous as the fMRI analysis tools, so while improvements have been made in availability of databases, only a small number of comprehensive open-source systems exist. A large impediment to the adoption of existing databases is the time required to organize and import data into the database. Each system has its strengths and weaknesses, which we will examine in relation to NiDB's features.
We introduce a database and pipeline system with significantly simpler installation and usage, and that is more powerful than existing databases. NiDB was developed at Hartford Hospital for the Olin Neuropsychiatry Research Center to store and manage multiple types of data analyses. NiDB began as a repository to replace a DVD archiving system for MRI data. Prior to the NiDB implementation, data were stored online for 30 days before being archived to DVD, a method which does not facilitate quick or large analysis. The second and third iterations of the database improved performance and increased storage capacity to the point where data and limited quality control (QC) metrics were available for download a few hours after an imaging session was complete, and additionally several years of previously collected data were available and searchable by a number of criteria. The fourth and current iteration of NiDB was rewritten from the ground up to reflect a new storage architecture which is blind to data-type, meaning any imaging modality, or other data, can be stored in the system and all searching, sharing, and pipeline processes are datatype neutral. The process for adding new modalities was simplified, and a new modular backend system was created to allow user-defined modules, but more importantly to ensure that a failure or bottleneck of one module does not impact other modules.
During development of NiDB, we identified several features that an imaging database must possess to address common imaging center needs: 1) association of all, including longitudinal, data modalities with a particular subject, 2) subject-centric storage, 3) real-time QC for MRI series, 4) simple automatic pipeline processing with searchable results, 5) simple design, and 6) simple import/export of data. We fulfilled those requirements and in the process created a powerful database that other laboratories may find useful. We further recognized the role NiDB can play in fostering data sharing by solving several of the issues presented in a paper by the International Neuroinformatics Coordinating Facility (INCF) (Poline et al. 2012). The first issue is one of personal motivation to share data, whereby researchers for several reasons are reluctant to share their hard earned data, especially raw unpublished data. Personal concerns of researchers cannot be mitigated exclusively by a software package, however NiDB may make researchers more comfortable to share data by storing data locally, being extremely cost effective, and allowing researchers to choose when and to whom they share their data. Compared to centralized data repositories, NiDB may be appealing because it allows researchers to share data with only researchers they want to share with instead of an open-ended sharing agreement. The experience of sharing data to a few trusted colleagues may lessen their fears over time and they may be more willing to share with a large consortium. A second concern is of ethical and legal issues, primarily involving institutional review boards (IRB) and their concerns for the well being of research participants. NiDB is designed to store as little protected health information (PHI) or personally identifiable information as possible, and only uses PHI to identify duplicate subjects. The third concern is over technical issues of data sharing, which NiDB solves by making the sharing process as simple as clicking export at the sending site and import at the receiving site. The fourth issue is one of standardized data definitions when sharing. Several data formats address standardization for imaging data, including DICOM and NifTI, but no wide-spread standardized definitions exist for the metadata created by neuroimaging databases which describe collections of diverse data. We present our data definition as a standard format for neuroimaging data sharing and offer it to the neuroimaging community as a starting point for a future standard. Data sharing features are explored in this paper and demonstrated through an implementation of sharing in a sample multi-site project.
Materials and Methods
NiDB Overview
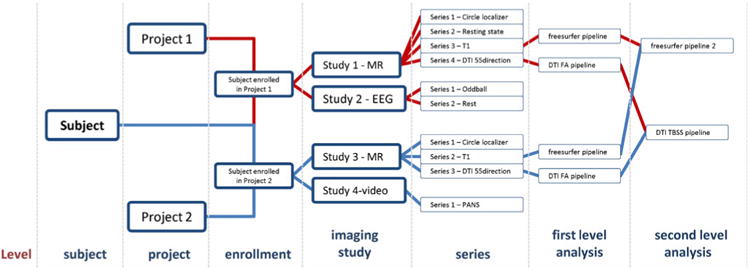
NiDB uses a subject-centric model to organize data. The subject is considered the unique root object and all other data are dependent on the subject. A unique identifier (UID) is assigned to each subject in the database, regardless of what project they are enrolled in. Subjects are then enrolled in projects, and multiple imaging studies are attached to each enrollment. Within each imaging study are attached imaging series. This model is used regardless of modality and can store any subject based research data. The hierarchy for raw data is Subject → Enrollment → Imaging Study → Series, which is similar to the picture archiving and control system (PACS) storage definition (Fig. 1). Individual subjects are defined as a single person and are unique based on name, date of birth, and sex. Projects are defined as Institutional Review Board (IRB) approved protocols and are associated with subjects at the enrollment level. Imaging studies are defined as a period of time during which data is collected from a subject on a piece of equipment. An imaging study may include the collection of an MRI, an EEG, eye-tracking session, or any other data. For example, if a subject comes in to an institution and performs one MRI and EEG in the morning, a blood draw for genetics data at lunch, and an MRI in the afternoon, that would be considered four different “imaging” studies. Within each imaging study, data is contained in ordered series. Single or multiple files can be stored in each series. We found that virtually all modalities of imaging and other binary data associated with any type of neuroimaging research can be stored in the Subject → Enrollment → Imaging Study → Series hierarchy Privacy is incorporated at the presentation level, not at the data storage level. User access control is defined at the user-project level and is checked when displaying subject information. User access is therefore controlled at the project level, similar to authorization of personnel on IRB protocols. An access message listed at the top of each webpage displays the projects through which the user has IRB approval to access PHI listed on that page. Regular users of NiDB interact exclusively with the web based frontend, which is designed using HTML5 and JavaScript so that web pages are viewable on any modern browser. Users login using either an NiDB specific password, or using the credentials of a local network information service (NIS) server.
Fig. 1. Object hierarchy of NiDB, showing the subject-centric model.
NiDB System Architecture
NiDB runs on a LAMP stack (Linux, Apache, MySQL, PHP) and uses a three-tier architecture with a web-based frontend, relational database management system (RDBMS) middle tier, and backend for storage and processing. Other than SQL table definitions, the middle tier is standard and the configuration is similar to many other web-based applications. With minor changes, the MySQL database could be exchanged for any other RDBMS, so focus will be paid to the web-based frontend and scripting and compiled program based backend. The term ‘frontend’ refers to any software with which a user has direct interaction, and ‘backend’ refers to software which the average user does not directly interact with through web pages or command line. PHP is used as the client–server based language to generate web pages viewed by the user. Pages are generated dynamically, with each separated into a header, main page, and footer. Style sheets, common functions, database and site configuration information are contained in the header.
Modularity
All functions of the backend of NiDB are performed by independent modules. Modules are launched from cron, and status is recorded in the modules table in the database. Most modules allow multiple instances to run concurrently to allow better use of multi-core servers. Upon starting and registering its status in the database the module will perform its task and mark itself as complete before exiting. There are seven modules which control the basic functionality of archiving, QC, data requests, and analysis, listed in order of importance: parsedicom, parseincoming, mriqa, dailybackup, datarequests, pipeline, pipelinetest. A brief description of each module is as follows: 1) parsedicom – archives all DICOM files received through the DICOM receiver. It associates images with existing subjects, and creates new subjects, imaging studies, and series if they do not already exist. It also generates thumbnail images and records basic information about the images in the database. 2) parseincoming – archives all non-DICOM files that are placed in the incoming directory. Files include EEG, eye-tracking, or other user-defined files. Files are archived with existing subjects and associated enrollments, or subjects, enrollments, studies, or series created if they do not exist. 3) mriqa – Performs basic QC of MRI data including SNR calculation, motion correction, and motion estimation. Exact procedures are described in the QC section. 4) dailybackup – Runs nightly and copies all files and directories older than 24 h to a backup location from which they can be archived onto tape, online, or other media. Backup can be performed by a server secondary to the main NiDB server. 5) datarequests – processes all data requests submitted via the website. Data is sent to local NFS, local FTP, or remote FTP. Conversion between imaging formats and DICOM anonymization are performed. 6) pipeline – all analysis jobs are created and submitted to a cluster by this module. Based on pipeline criteria, each analysis is performed on all imaging studies that have not already been run through that pipeline. Multiple instances of the pipeline module are run concurrently to submit jobs for multiple pipelines. 7) pipelinetest – processes any pipelines which have a ‘testing’ flag set. It will exit and disable the pipeline after submitting ten jobs successfully. Accessory modules are available such as parsevideo, which converts video files to ogg vorbis (www.vorbis.com) to allow inline viewing in the webpage.
Subject Uniqueness
Subjects are unique in NiDB based on name, date of birth, and gender. In most instances, these criteria will ensure data integrity with limited chance for error because of duplication. Studies on frequency of same-name/same-date of birth are uncommon, however a study by the Brennan Center for Justice found that only 289 of 3.6 million votes cast in New Jersey in the November 2004 elections were likely duplicates based on the same name and date of birth (McDonald 2005). This real-world example shows the probability of same-name same-DOB to be 0.008 % in a sample of 3.6 million. NiDB is primarily an imaging database, so PHI is used as little as possible, and in this case PHI is used solely to ensure data integrity. A 7 character alphanumeric unique identifier (UID) format was chosen to allow large numbers of subjects, but also to make remembering and transcribing easier. The format of 4 numbers followed by 3 letters (ex S1234ABC) is based on the license plate numbering used in several US states. The option exists to use 4 digits and 4 letters as well, though no means is provided to prevent the 3 or 4 letters from forming words in the UIDs.
Importing/Uploading Data
Most neuroimgaging data imported into NiDB will be in DICOM format received from an MRI scanner in real-time, however any modality DICOM data can be imported into NiDB. A DICOM receiver (dcm4che) is provided to run on the NiDB server to receive and store all DICOM images in a directory in preparation for NiDB to archive the images (Zeilinger 2013). The parsedicom module reads through incoming DICOM files using Exiftool (www.sno.phy.queensu.ca/∼phil/exiftool) and groups them by series number using the following DICOM tags to ensure uniqueness: InstitutionName (0008,0080), StationName (0008,1010), Modality (0008,0060), PatientName (0010,0010), PatientBirthDate (0010,0030), PatientSex (0010,0040), StudyDate (0008,0020), StudyTime (0008,0030), SeriesNumber (0020,0011). Project enrollment is also determined by checking the StudyDescription (0008,1030) DICOM tag. Subjects, enrollments, imaging studies, and series are created if they do not exist, otherwise they are archived with existing objects. Files are placed in the archive and the database updated. Basic information is extracted from the DICOM header such as patient weight, series description, series date time, and other modality and image specific parameters and recorded in the database. DICOM images may be manually uploaded in bulk by copying them to the same incoming directory that network-received DICOM images are stored. Manually uploaded images will then be processed in the same way as automatically uploaded images. DICOM images may also be manually uploaded from a study webpage. Non-DICOM data can be uploaded manually on the imaging study webpage or can be placed in the incoming directory for the parseincoming module to pick up. Non-DICOM data requires a customized script to import and relies on either file names and directory names or pre-entered data, such as which project the imported data will be associated with. Scripts have been created to import eye-tracking, EEG (neuroscan), and SNP data. Most fMRI tasks have a behavioral data file recorded during scanning, and these files can be uploaded manually to be associated with existing MR image series. SNP data is a unique case because all subjects in an analysis were sequenced at the same time and all data is contained in a single file, and this file is required to perform any analysis. However, it is possible to extract single subjects from the main SNP file, so these data were separated out and written to individual files to be stored with the specific subject as an imaging study. Subject data can then be recombined into a single file when downloading from NiDB, which allows only selected subjects to be included in the analysis. SNP analysis using plink also requires a common file, which is only on the order of 20MB depending on the number subjects in the sample, so this file is stored along with each subject's SNP data (Purcell et al. 2007).
Searching for and Downloading Data
Data can be queried by using several criteria and results returned can be grouped by subject, imaging study, and series. By default, all searches are cross-project, with the only limitation being access permissions. Search criteria are submitted to the server where an optimized SQL statement is created to perform the query. Depending on search type, results will be displayed as an HTML table, offered as a comma-separated value (csv) file, or displayed with checkboxes to allow downloading of data. Data can be anonymized as well as having the output and directory formats selected during the download. Data requests are recorded in the database and the datarequest module will process requests as they are received. All data can be downloaded in zip format using links on each study webpage. Other result display formats are available including: pipeline results, which shows images or values from pipeline analyses; longitudinal studies, which displays subjects which have had more than one imaging study for the specified search criteria; and debug mode, which displays the SQL statement used for the search without running it. DICOM data can be anonymized by two methods: light and complete. Light anonymization removed patient specific and physician tags, as well as operator. Complete anonymization also removes all of the aforementioned fields and additionally all fields storing any date or time of acquisition and institution location or equipment (site) name. No method currently exists to anonymize non-DICOM data that contains PHI or identifying information, however few research data storage formats other than DICOM have the capability to store such PHI. When downloading any type of data, the directory names by default contain the date and time of the scan, but this can be changed to only the subject UID.
MRI Quality Control
Several MRI QC metrics are computed on data after archiving and are available to view on the website within 5 min after a series completes on the MRI scanner. QC metrics are therefore available before a subject leaves the MRI scanner, allowing series to be re-run if necessary. Motion estimation is computed on 4D data, such as fMRI time series, using FSL's MCFLIRT (Jenkinson et al. 2002). Maximum and minimum values for the 6 parameter motion correction estimations (3 displacement, 3 rotation) are recorded to the database in addition to the complete output file for later use in graphic display of motion estimation parameters. Motion estimation in 3D images is performed by taking the fast Fourier transform (FFT) of each slice, taking the radial average of the FFT, and computing the average linear regression of the radial average plots. Motion in structural images reduces the power of high spatial frequency signal and increased low frequency spatial signal, so the slope of linear regression line of the radial average of the FFT should be steeper in images with motion than those without. For time series data, a mean intensity plot is calculated using FSL's fslstats function, as well as a mean temporal image, and variance of temporal image. Inside-outside (IO) signal to noise ratio (SNR) is calculated in images by dividing the average signal intensity within the brain by the average signal intensity outside the brain. Inside brain voxels are extracted by masking with the output of FSL's brain extraction tool (bet), and compared to the mean noise signal from 8×8 voxel corners of the volume. Per-voxel (PV) SNR is calculated by taking the mean of each voxel in a time-series and dividing it by the voxel's standard deviation. A mask is created using bet, and only the previously calculated value from in-brain voxels are averaged to create a PV SNR.
Pipeline
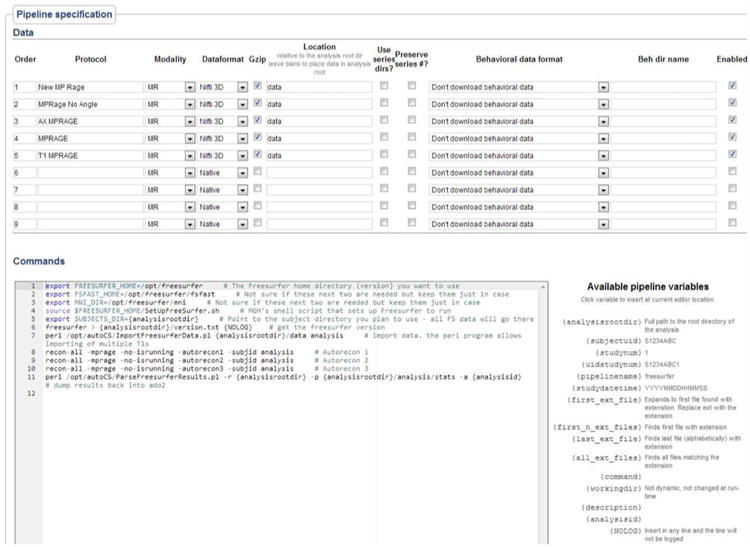
The pipeline module is run once per minute and will launch a new instance of the module for each active pipeline. When first run, the module checks for any new imaging studies which do not have an entry in the analysis table for that particular pipeline and will then run the pipeline on that imaging study. Imaging studies can have multiple analyses run on them, but can only have one of each analysis run. The directory structure of analyzed data is similar to that of the raw data structure, which is subject-centric. Each pipeline, if run, creates a specific directory within the imaging study on which it is being run. This path becomes the ‘analysis root’ directory, with all other analysis directories descendent from that. The pipeline specification on the web interface has three parts: 1) basic information such as pipeline name, and whether it's a first or second level analysis 2) data specification including the exact series protocol names and details about where to store the data, and 3) the pipeline script to run. The pipeline script is a bash style script with pipeline specific variables which are parsed at run-time to reflect the current study's information (Fig. 2). Each time the pipeline is saved, a new version of the pipeline is created, so even if a pipeline changes, the exact commands run on previous analyses will be known.
Fig. 2. Pipeline specification screen. Pipeline variables are filled out with analysis specific information at run time.
Sharing
A decentralized model is used for data sharing, which allows for individual sites to share with other sites without interacting with a central repository. NiDB can act as a central repository or as a node in a data sharing network. Data is shared between NiDB installations using a three step process: 1) export selected data to a compressed file, 2) send the file to the remote site, and 3) import the file at the remote site. For any items which do not exist in the remote site: subjects, studies, and series will be created. For any items which do exist in the remote site: subjects, projects, studies, and series will be amended, updated, or ignored and a conflict report generated. Projects will not be created automatically, if a study has no corresponding project, it will be placed in the Generic Project (999999). If anonymization is selected as an export option, data is de-identified and name and date of birth are replaced with an MD5 hash of the two concatenated fields. To calculate the hash, all spaces and special characters (commas, hyphens, underscores) are removed from the two fields leaving only alphanumeric characters; all alphabetic characters are converted to upper case and the fields joined, name first. No PHI will be received at the receiving site, but the MD5 hash will ensure that if a subject with duplicate name and date of birth exists, this duplicate will be flagged and the user can manually intervene to determine the nature of the duplication. During installation a universally unique identifier is generated using the MySQL uuid function and is exported along with the subject's information to identify the originating site for data. If imported data is re-exported at another site, the origin site information is maintained. Data are packaged into a directory structure similar to that of the data archive and is compressed using tar and gzip. The tarball (.tar.gz file) is then sent to a remote site, unpacked, and the importation process occurs. Specifications for the tarball format are available on the NiDB website (http://nidb.sourceforge.net).
Image Viewing/Previewing
Thumbnail images are generated from the middle slice (or file) of DICOM series using ImageMagick (www.imagemagick.org), and from the orthogonal sections using slicer (www.slicer.org) for NifTI images. Animated GIF files are created from 3D and 4D DICOM volumes using ImageMagick. Both thumbnails are generated for every series, are displayed along with series information on the NiDB website and are provided to give a quick glance at the data so users can see gross motion or artifacts. An interactive viewer is available to view in orthogonal and freely rotatable volume rendered views of 3D data using xtk (Hähn et al. 2012). Interactive 3D viewing of FreeSurfer surfaces can also be viewed using xtk, which offers more display options such as displaying multiple surfaces and changing surface colors.
Installer
An installer is provided to copy the NiDB files to their destinations and to configure and install requisite software. Included in the installer is the current version of NiDB web pages, Perl modules, database definition, and configuration files. Packages installed include PHP version 5.3.3, MySQL version 5.1, Python 2.7, ImageMagick 6.8. Additional software packages include ExifTool 9.2, webmin 1.6, and phpMyAdmin 3.5. FSL is required for MRI QC and instructions are provided for the user to install the package. If performed by an individual with Linux experience, NiDB can be installed and functioning within 1 h.
Server Hardware & Scalability
The development site installation of NiDB runs on mirrored Silicon Mechanics servers, each with sixteen 2.4GHz cores, 12GB RAM, and 40TB disk space in a RAID6 configuration. The MySQL database is replicated with a master/slave configuration and data is mirrored nightly using rsync. All new data written to the archive is simultaneously copied to a backup directory on a separate server. Using the backup module in NiDB, when the directory reaches 750GB in size, it is written to LTO-4 tape in triplicate. While the test site's hardware is large, NiDB can run on any system that can run CentOS 6.x, including desktops or laptops. The virtual machine provided runs well on standard desktop hardware. Based on the UID scheme used (4 digits followed by either 3 or 4 characters) an installation of NiDB can store either 175 million or 4.5 billion subjects with an unlimited number of enrollments, imaging studies, and series. Limitations of scale will arise from the hardware, MySQL version, and optimization for multi-billion row databases.
Results
The primary site for NIDB development has to-date stored 9,123 unique subjects with 19,594 imaging studies, in 139 projects, with 16,243 project enrollments. Six terabytes of raw data is stored on the servers and 2TB of data has been requested for download in the previous 20 months. Data request sizes are frequently on the order of 100MB, but 100GB+downloads have been requested. Data request options such as DICOM anonymization or format conversion may take more time to process. Mean request time is 5 h 42 m, median request time is 48 m, and 3d 20 h of CPU time was used to process requests. To perform QC on 133,531 MRI series, 266d 7 h of CPU time was used. The analysis count from 9 pipelines totaled 14,003, generating 10,134,631 result values and 143,315 result images.
Query performance for searches of approximately 1,000 items at all hierarchy levels (subject, imaging study, series, pipeline analysis) was 1 s or less (Fig. 2). Searches for pipeline results returning 6,500 items took 3.5 s, and a search returning 1.2million results from 439 subjects took 90s. Users report no problems or slowness during normal operation. The most frequent cause of problems for inaccessibility to data are unrelated to NiDB and are often network or power outages, incorrect data entry by users, or user error. No impact to performance is experienced when running the nightly rsync, which often completes within 1 h. Server uptime is on average 6 months, and reboots have only occurred for maintenance reasons.
Since release as an open-source software package, NiDB has been downloaded approximately 290 times. Few support questions have been asked, but questions that have been asked are mainly related to installing NiDB on a non-CentOS 6.x platform. Comments from users are often about usage, which implies little difficulty with setup and that the simple installation, either through virtual machine or installer script, is working for them (Tables 1 and 2).
Table 1. Object definitions.
| Term | Definition | Examples/Notes |
|---|---|---|
| Subject | Unique person or animal on which research is performed | Human, non-human primate, mouse |
| ‘Imaging study’, or ‘Study’ | A procedure that generates data and has a finite time span with a defined completion time | MRI, EEG, SNP, Video, US, CT, Genome, consent |
| Series | A subset of data from a study. Within the time span of the study, a series also has a finite time span and a defined completion time | Resting state, oddball, smooth pursuit |
| Project | A research protocol under which several subjects are collected | User access is controlled at this level |
| Enrollment | A subject has signed a consent for a project and has had data collected under the protocols of that project |
Table 2. Hierarchy details.
| Level | Subject | Project | Enrollment | Imaging study | Series | First level analysis | Second level analysis |
|---|---|---|---|---|---|---|---|
| Searchable? | ✓ | ✓ | ✓ | ✓ | ✓ | ✓ | ✓ |
| Groupable? | ✓ | ✓ | ✓ | ||||
| ID format | S1234ABC | 555555 | S1234ABC1 | S1234ABC1-1 | |||
| Limitations | 175,760,000 (7 char UID) 4,569,760,000 (8 char UID) | 1,000,000(000000-999999) | Unlimited | Unlimited | Unlimited | Unlimited | Unlimited |
| Test site size | 9,104 | 77 | 11,337 | 19,281 | 143,543 | 7,787,441 | 2 |
| Search time for ∼1,000 items | 0.1 s | 0.1 s | 0.1 s | 1.0 s | 1.0 s | 1.0 s | 0.1 s |
Discussion
Comparison to Existing Databases
During development, we investigated other database systems including XNAT and COINS. We found that while both systems offered excellent features, each had some missing features which were required in our institution and felt other sites would benefit from as well. The most important improvements that we sought to address were ease-of-use, including installation, maintenance, and end-user support. While the REST API provided by XNAT is powerful, we found that significant effort would be required to integrate our existing analysis pipelines with XNAT. Searching for and retrieving data was not as granular as anticipated with XNAT as data were not searchable by series, only by subject, project, and imaging study. Data querying was found to be difficult with COINS, but because of performance and reliability reasons rather than granularity of search criteria. Retrieving large queries, on the order of 1,000 subjects, was slow with COINS and the result count inconsistent. Because of the large amount of PHI and IRB related data, and data from multiple sites stored on COINS, user access is tightly controlled with permissions leaning toward restrictive to prevent unintentional loss of PHI.
Performance of NiDB was significantly improved compared to COINS. COINS query times were reported as 5 min for data not included in their caching system, and only data older than 1 day was cached (Scott et al. 2011). Query times otherwise were 3 s. NiDB query times are much shorter, and only approached 3 s for very large query results, the bulk of that time is spent on transferring data over the network to the client and preparing it for display or download.
Design of the databases was another key difference when compared to NiDB. XNAT provides a substantial vetting process for data before making it available to users, and COINS focuses on maintaining a large amount of data from different sites in a central location. NiDB is closer to the LORIS model, where the focus is making available all raw imaging data to local and remote users from a locally maintained database, and allowing the user to decide the criteria for data quality on an individual level. NiDB goes a step further than LORIS by allowing simple sharing with data packages being exported and imported between installations, and integrates a powerful pipeline system. NiDB maintains as little PHI as possible, using only the amount necessary to uniquely identify a subject. COINS, XNAT, and XCEDE are project-centric, meaning the parent object in the hierarchy is a project, while the parent object in NiDB is the subject (Gadde et al. 2012). Cross-project sharing will appear the same to the user in either model, but we found it easier to extend NiDB's pipeline features using a subject-centric model. COINS offers a power-user mode to allow people to run SQL queries to answer questions such “across all projects on the system, which subjects have a particular MR scan sequence”. NiDB does project sharing by default for users that have access to queried projects. If a user does not have access to a project on NiDB and search results belong to that project, the user is notified that their search found data in projects to which they do not have access. Notifying a user that a particular search yields data within a project to which they do have access can be both useful and potentially troublesome for some projects. NiDB also allows projects to be private so they will not show up in search results if they user does not have access.
Installation varied from complex to simple with existing databases. XNAT installation was challenging and a significant knowledge of Apache tomcat was necessary to modify and redeploy the database. LORIS provides an installer for the LORIS code, but requires manual installation of the LAMP stack. COINS contrasts this by offering no installation, since the database is hosted at the Mind Research Network. Setup is much simpler with COINS, however it is not open-source. NiDB is open-source, and freely downloadable, which we felt was important to the dissemination of the database to encourage use.
Pipelining and Simple Data Mining
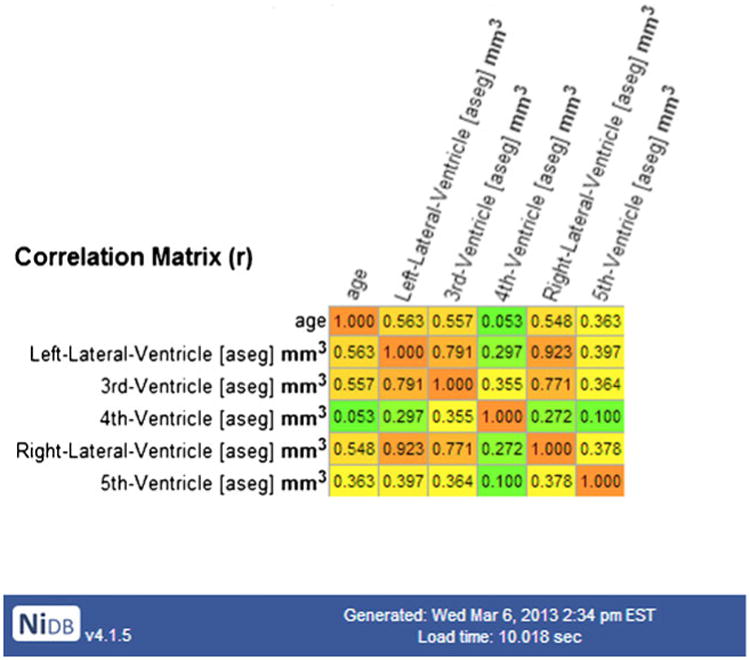
The most novel application of technology in NiDB is coupling of the data repository and the pipeline system. Creating pipeline analyses and analyzing hundreds or thousands of subjects worth of data is extremely simple. This simplicity has allowed massive analyses to take place with a significant reduction in user time required to setup the analysis. On the fly analyses can be performed in minutes using automatically generated pipeline results. An example would be to answer the question, “How do cerebral ventricle sizes correlate with age?” By checking a box on the search page, a correlation matrix is added to the pipeline results display, so that question can be answered immediately (Fig. 3). The answer is that all cortical structures shrink with age, except ventricles that have a positive correlation with age. This answer was returned in 10.02 s, calculated from a sample of 2,799 subjects (31.18 years +/− 18.29, 1,415 female), based on data processed automatically with FreeSurfer. Quick analyses on big data are useful, as many times it becomes necessary to query across studies to ask whether or not certain projects are feasible (e.g., are there enough subjects, is there a gender balance in acquired data, are the simple effects we need to observe present in data that already have undergone extensive, pipeline-driven processing, etc.). The correlation matrix embedded in the search results is provided because it provides a quick glance at the data to see if the results are sensible, however more in-depth analyses would be more appropriate for the second level pipeline. To add other quick analyses, like the correlation matrix, the search.php page could be edited and a function inserted to parse the existing search results prior to display.
Fig. 3. Correlation matrix for ventricle size and age calculated from FreeSurfer analyses from 2,799 subjects.
NiDB's pipeline environment is strictly Linux shell based, so that any software that be called from the command line can be run from the pipeline. For example, LONI pipeline and NiPype provide command line interfaces and will work with NiDB pipelines. Software such as FSL may check for the presence of cluster environment variables (SGE_ROOT, etc.), and will try to submit directly to the cluster. These environment variables should be disabled to allow NiDB to submit the job so that it can be tracked and results returned to the database.
With the ability to share a pipeline between NiDB instances, the benefits for multisite projects are significant such as reduced analysis time, redundant analysis to confirm results, and the need to only share raw data, so that each site can analyze their own data. Instead of the traditional method of having each site analyze a single modality of data, such as site A analyze MRI and site B analyze genetics, each site can analyze their own data or verify data from other sites. Distributed pipelines ensure that identical methods are used when analyses are performed.
Sharing
Data sharing has traditionally been done through personal partnerships, but more recently large consortia such as LONI-IDA, BIRN, INDI, COINS NITRC-IR have sought out sources of data, packaged, and distributed them. Disease specific databases are also popular, such as the Alzheimer's disease neuroimaging initiative (ADNI) and the national database for autism research (NDAR) (Hall et al. 2012; Jack et al. 2008; Mueller et al. 2005). The NIH has undertaken the practice of making raw data available from its funded studies, from which NDAR was created. All federally funded studies related to autism are required to submit their raw data to NDAR which will make the data available to the public. Data fed into any of the aforementioned databases are vetted at the sending and receiving side, which is a good practice to catch errors. These central repositories and consortiums do an excellent job of packaging large volumes of data in a consistent and understandable way. These approaches work well for large organizations with the resources available to transform data into the appropriate format prior to contribution. However, many smaller labs either do not have the necessary resources, large enough sample size, or were perhaps not well-known enough to be included with data releases. A significant amount of work is required to organize diverse sets of data. Another problem with big data is what a user should do once they've downloaded 1,000 subjects worth of imaging data, including all of the corresponding phenotypic data. Filtering, searching, and extracting the subjects of interest can be extremely time consuming. NiDB's approach to sharing is to allow all sites, small and large to share their data with any other site, in a peer to peer manner. With minimal investment in time and resources, this model elevates data shared from a small one-person lab to the same level as data from large centers. When other sites download shared data, they can import it into their own database, examine the raw data, or import it into their own installation of NiDB, from which they can query, aggregate, and perform pipeline analyses. NiDB's peer to peer sharing of data is a novel application of the technique applied to neuroimaging data.
Adoption
NiDB was publically released on NITRC (http://www.nitrc.org/projects/nidb) and on SourceForge (http://nidb.sourceforge.net) in 2012, and to date have had 287 downloads in various formats and versions. Based on forum messages, some users have successfully installed the database the system, but it is unclear whether those users continue to use the system or simply installed it for testing. A publically accessible version of NiDB is available under the Demo link on the main NiDB website (http://nidb.sourceforge.net). The public website hosts the Autism Brain Imaging Data Exchange (ABIDE) data set of 1,076 subjects, with the intent to host more data from the International Neuroimaging Data Initiative (INDI). New versions of NiDB are released periodically and notices of new releases are posted to the NiDB and NITRC websites.
Limitations and Future Considerations
A useful feature of NiDB is the automatic QC of MRI data. In testing, we found the SNR metric to be dependent on body type and scan sequence, so it is not a universal metric like fMRI motion estimation. For motion detection in structural images, spatial frequency is partially dependent on SNR. Therefore, motion estimation in structural images can only be compared with images taken from the same person, preferably during the same imaging session. As new MRI QC metrics are added to NiDB, those metrics are not automatically generated for existing series, only for new series. This necessitates the recreation of all existing QC metrics to create the new metrics. Making the QC system modular would allow new metrics to be created and stored independently.
Queries on NiDB perform well in almost all instances for general work, but performance for massive queries, such as those for analysis results can take time. The example query described earlier searched for all FreeSurfer analysis results from 439 subjects, and generated 1.2million rows, with data returned to the web server in 60s. Reorganizing the rows by subject took an additional 30s on the web server, for a total time of 90s. While a 1.5 min query to return 1.2 million results is not poor performance, the query time will certainly increase as the results table grows from 10.2 million rows into 50 million. So optimization strategies must be determined to continue to allow reasonable query times.
NiDB is built using open-source software and standard web application methodology, but it is closely tied to the operating system, requiring significant OS level configuration. Almost the entire configuration is performed by the installer program, however the 1 h installation program is currently available only for CentOS 6.x. We hope to expand the number of operating systems that the installer can use in the future. Creation of new modalities is not as simple as would be preferred. Information about imaging studies for each modality is stored in its own table. From a data normalization standpoint, this is not ideal, since there is a great deal of common information across all modalities, such as study date, equipment, etc. However, it is possible to add modalities easily, which only involves adding a table, and this process could be automated with a web-based tool. Additionally the frequency of adding modalities is rare. A future addition of alternate login authentication methods such as LDAP, or OpenID would be useful for sites not using NIS.
Real-time communication between instances of NiDB would be an interesting extension, which opens the door to automatic distributed analyses. An example scenario might be that a site has 1,000 FreeSurfer jobs to process, that typically take 20–30 h to complete a single job, the site would need 20,000–30,000 h of processor time. If the site doesn't have the capacity to process all of the data, they can distribute the load to other sites by sending the raw data and the pipeline scripts, in effect parallelizing the capacity of multiple sites to utilize each other's computer resources in a highly optimal manner, provided they use the NiDB data storage and pipeline resources.
Conclusion
In the process of creating a database that satisfies our local needs, we were able to create a database that we believe will satisfy many needs of other researchers and research groups, and solves some of the challenges to data sharing posed by the INCF. We feel NiDB can speed the process of scientific discovery by making data and analyses available to researchers more easily than using other systems. At the basic level, researchers using NiDB are able to spend less time creating the infrastructure necessary to perform their research and more time on analysis. At a higher level, NiDB provides the infrastructure necessary to effectively share data between sites while maintaining all of the meta-data. Many ideas incorporated into NiDB originate from outside the neuroimaging community, but the combination of these ideas into one package is unique and makes the software extremely useful for neuroimaging data management.
Information Sharing Statement
Neuroinformatics Database is licensed under the General Public License (GPL) v3, and complete source code and database schema are available for download with the NiDB installer package from SourceForge (http://nidb.sourceforge. net) or NITRC (http://www.nitrc.org/projects/nidb). Forums, mailing lists, documentation, and support are available from the SourceForge website.
Acknowledgments
Features and ideas for the Neuroinformatics Database were conceived by many individuals over the course of its development. In this way, the entire staff of the Olin Neuropsychiatry Research Center contributed to its development. Development of NiDB was supported by the National Institutes of Health (NIH) from the following grants: R37-MH43775 (NIMH), R01-AA016599 (NIAAA), RC1-AA019036-01 (NIAAA), P50-AA12870-11 (NIAAA), R01-MH077945 (NIMH), R01-MH080956-01 (NIMH), R01-MH081969 (NIMH), R01-MH082022 (NIMH), R03-DA027893 (NHLBI), R01-EB006841 (NIH/NIBIB), R44-MH075481-03A2 (NIMH), R01-AA015615-01 (NIAAA), R01-DA020709 (NIDA), RC1-MH089257 (NIH/NIMH), R01-MH074797-01 (NIMH).
Contributor Information
Gregory A. Book, Email: gbook@harthosp.org, Olin Neuropsychiatry Research Center, Hartford Hospital, Hartford, CT, USA.
Beth M. Anderson, Olin Neuropsychiatry Research Center, Hartford Hospital, Hartford, CT, USA
Michael C. Stevens, Olin Neuropsychiatry Research Center, Hartford Hospital, Hartford, CT, USA; Department of Psychiatry, Yale University School of Medicine, New Haven, CT, USA
David C. Glahn, Olin Neuropsychiatry Research Center, Hartford Hospital, Hartford, CT, USA; Department of Psychiatry, Yale University School of Medicine, New Haven, CT, USA
Michal Assaf, Olin Neuropsychiatry Research Center, Hartford Hospital, Hartford, CT, USA; Department of Psychiatry, Yale University School of Medicine, New Haven, CT, USA; Department of Neurobiology, Yale University School of Medicine, New Haven, CT, USA.
Godfrey D. Pearlson, Olin Neuropsychiatry Research Center, Hartford Hospital, Hartford, CT, USA; Department of Psychiatry, Yale University School of Medicine, New Haven, CT, USA; Department of Neurobiology, Yale University School of Medicine, New Haven, CT, USA
References
- Cox RW. AFNI: software for analysis and visualization of functional magnetic resonance neuroimages. Computers and Biomedical Research. 1996;29(3):162–173. doi: 10.1006/cbmr.1996.0014. [DOI] [PubMed] [Google Scholar]
- Das S, et al. LORIS: a web-based data management system for multi-center studies. Frontiers in Neuroinformatics. 2011;5:37. doi: 10.3389/fninf.2011.00037. [DOI] [PMC free article] [PubMed] [Google Scholar]
- Frackowiak RSJ. Human brain function. xiii. San Diego: Academic; 1997. p. 528. [Google Scholar]
- Gadde S, et al. XCEDE: an extensible schema for biomedical data. Neuroinformatics. 2012;10(1):19–32. doi: 10.1007/s12021-011-9119-9. [DOI] [PMC free article] [PubMed] [Google Scholar]
- Hähn D, et al. neuroinformatics. Munich, Germany: 2012. Neuroimaging in the browser using the X toolkit. [Google Scholar]
- Hall D, et al. Sharing heterogeneous data: the national database for autism research. Neuroinformatics. 2012;10(4):331–339. doi: 10.1007/s12021-012-9151-4. [DOI] [PMC free article] [PubMed] [Google Scholar]
- Jack CR, Jr, et al. The Alzheimer's Disease Neuroimaging Initiative (ADNI): MRI methods. Journal of Magnetic Resonance Imaging. 2008;27(4):685–691. doi: 10.1002/jmri.21049. [DOI] [PMC free article] [PubMed] [Google Scholar]
- Jenkinson M, et al. Improved optimization for the robust and accurate linear registration and motion correction of brain images. NeuroImage. 2002;17(2):825–841. doi: 10.1016/s1053-8119(02)91132-8. [DOI] [PubMed] [Google Scholar]
- Jenkinson M, et al. Fsl. NeuroImage. 2012;62(2):782–790. doi: 10.1016/j.neuroimage.2011.09.015. [DOI] [PubMed] [Google Scholar]
- Keator DB, et al. A national human neuroimaging collaboratory enabled by the Biomedical Informatics Research Network (BIRN) IEEE Transactions on Information Technology in Biomedicine. 2008;12(2):162–172. doi: 10.1109/TITB.2008.917893. [DOI] [PMC free article] [PubMed] [Google Scholar]
- Marcus DS, Olsen T, Ramaratnam M, Buckner RL. XNAT: A software framework for managing neuroimaging laboratory data; organization for human brain mapping annual meeting; Toronto. 2005. [Google Scholar]
- Marcus DS, et al. The extensible neuroimaging archive toolkit: an informatics platform for managing, exploring, and sharing neuroimaging data. Neuroinformatics. 2007;5(1):11–34. doi: 10.1385/ni:5:1:11. [DOI] [PubMed] [Google Scholar]
- McDonald M. Analysis of the September 15, 2005 voter fraud report submitted to the New Jersey Attorney General. New York: NYU School of Law; 2005. [Google Scholar]
- Mueller SG, et al. Ways toward an early diagnosis in Alzheimer's disease: the Alzheimer's Disease Neuroimaging Initiative (ADNI) Alzheimer's & Dementia. 2005;1(1):55–66. doi: 10.1016/j.jalz.2005.06.003. [DOI] [PMC free article] [PubMed] [Google Scholar]
- Poline JB, et al. Data sharing in neuroimaging research. Frontiers in Neuroinformatics. 2012;6:9. doi: 10.3389/fninf.2012.00009. [DOI] [PMC free article] [PubMed] [Google Scholar]
- Purcell S, et al. PLINK: a tool set for whole-genome association and population-based linkage analyses. American Journal of Human Genetics. 2007;81(3):559–575. doi: 10.1086/519795. [DOI] [PMC free article] [PubMed] [Google Scholar]
- Scott A, et al. COINS: an innovative informatics and neuroimaging tool suite built for large heterogeneous datasets. Frontiers in Neuroinformatics. 2011;5:33. doi: 10.3389/fninf.2011.00033. [DOI] [PMC free article] [PubMed] [Google Scholar]
- Zeilinger G. dcm4chee. 2013 Available from: http://www.dcm4che.org.