

Abstract
Accumulating evidence suggests that motor impairments are prevalent in autism spectrum disorder (ASD), relate to the social and communicative deficits at the core of the diagnosis and may reflect abnormal connectivity within brain networks underlying motor control and learning. Parcellation of resting‐state functional connectivity data using spectral clustering approaches has been shown to be an effective means of visualizing functional organization within the brain but has most commonly been applied to explorations of normal brain function. This article presents a parcellation of a key area of the motor network, the primary motor cortex (M1), a key area of the motor control network, in adults, typically developing (TD) children and children with ASD and introduces methods for selecting the number of parcels, matching parcels across groups and testing group differences. The parcellation is based solely on patterns of connectivity between individual M1 voxels and all voxels outside of M1, and within all groups, a gross dorsomedial to ventrolateral organization emerged within M1 which was left–right symmetric. Although this gross organizational scheme was present in both groups of children, statistically significant group differences in the size and segregation of M1 parcels within regions of the motor homunculus corresponding to the upper and lower limbs were observed. Qualitative comparison of the M1 parcellation for children with ASD with that of younger and older TD children suggests that these organizational differences, with a lack of differentiation between lower limb/trunk regions and upper limb/hand regions, may be due, at least in part, to a delay in functional specialization within the motor cortex. Hum Brain Mapp 35:567–580, 2014. © 2012 Wiley Periodicals, Inc.
Keywords: resting state, functional connectivity, clustering, motor cortex, autistic disorder
INTRODUCTION
Autism is a pervasive developmental disorder characterized by deficits in social cognition, disordered communication, restricted interests and repetitive behaviors [American Psychiatric Association, 1994]. In parallel to the social and communicative skill deficits at the core of their diagnosis, children with autism spectrum disorders (ASDs) experience a host of motor impairments, including deficits in basic motor control [Jansiewicz et al., 2006; Noterdaeme et al., 2002; Teitelbaum et al., 1998, 2004] as well as reduced postural stability [Fournier et al., 2010; Minshew et al., 2004]. Children with ASD also experience difficulty performing skilled motor gestures [Jones and Prior, 1985; Mostofsky et al., 2006; Rogers et al., 1996; Williams et al., 2001] and demonstrate abnormal patterns of motor learning [Haswell et al., 2009; Hughes, 1996; Mostofsky et al., 2000; Rinehart et al., 2001].
Social and communicative competence depends on the mastery of skilled behaviors. In a developmental disorder such as autism, mechanisms vital to the acquisition of motor skills through repetition (procedural learning) may also contribute to the impaired development of social and communicative abilities [Mostofsky et al., 2000; Ullman, 2004]. Impaired performance of skilled, goal‐directed movements has been found to correlate with measures of core social and communicative dysfunction in children with ASD [Dowell et al., 2009; Dziuk et al., 2007]. In addition, children with ASD have demonstrated excessive reliance on proprioceptive as opposed to visual input during motor learning, and this proprioceptive bias correlated with motor, as well as social, impairments in these children [Haswell et al., 2009].
Given the link between early motor experiences and the emergence of social behaviors [Libertus and Needham, 2011], it is not surprising that gross and fine motor delays may be among the earliest identifiable signs distinguishing infants with autism from their typically developing (TD) peers [Landa and Garrett‐Mayer, 2006; Zwaigenbaum et al., 2009]. Recent findings also indicate that the clearest predictor of optimal outcomes in toddlers diagnosed with ASD may be motor skill assessment at 2 years of age [Sutera et al., 2007]. As such, careful examination of the neural underpinnings of motor development in children with ASD is critical to furthering our understanding of the disorder as well as to designing effective early interventions.
Emerging empirical evidence suggests that the difficulties with motor execution observed in ASD may reflect structural and functional abnormalities within brain networks underlying motor control and learning. Structural neuroimaging studies have reported an overgrowth of localized cortical connections in children with ASD [Herbert et al., 2004]. Specific to motor function, increased radiate white matter volume within the primary motor cortex (M1) has been shown to correlate with deficits in motor performance [Mostofsky et al., 2007]. Investigations of motor learning in ASD have revealed atypical involvement of components of the motor control network along different stages of learning, with comparatively greater MI recruitment during the later stages of learning in ASD [Muller et al., 2004]. Children with ASD have also demonstrated reduced functional connectivity (FC) compared with TD children within the motor control network during a finger sequencing task [Mostofsky et al., 2009] as well as reduced, intrinsic modulation of activity within the motor cortex [Oberman et al., 2005].
The combined results from these prior studies suggest that autism may be associated with abnormalities in the structure and connectivity of the primary motor cortex; however, no study has examined differences in the functional organization of M1 in children with ASD. Recently, several groups have used patterns of correlations in spontaneous blood oxygenation level–dependent activity, referred to as resting‐state FC, to localize functionally relevant subdivisions of anatomically defined regions [Cohen et al., 2008; Kelly et al., 2010; Kim et al., 2010; van den Heuvel et al., 2008]. Clustering algorithms partition FC data into natural subsets (parcels) such that observations assigned to one parcel are more similar to one another than they are to observations assigned to another parcel. By grouping together functionally coherent brain regions, clustering provides an approach to estimate functional organization within the brain; however, to date, clustering methods have not been used to investigate functional organization differences associated with neurocognitive disorders. Although numerous studies have used resting‐state FC to investigate the motor control network as a whole [Beckmann et al., 2005; Damoiseaux et al., 2006; De Luca et al., 2006; van den Heuvel et al., 2008], few studies have examined FC between subregions of the motor cortex with distinct motor functions, and none has examined this in autism.
Motivated by the utility of clustering methods in establishing functional organization, this study had two aims: (1) to parcellate a key area of the motor network, the precentral gyrus (corresponding to M1) in neurotypical adults and TD children and (2) to apply this approach to children with ASD to determine if the functional organization of M1 differs in children with ASD compared with TD children.
MATERIALS AND METHODS
Participants
The Johns Hopkins Medical Institutional Review Board approved this study, and written informed consent was obtained from all participants or their legal guardians (in the case of children) before examination.
Children
Thirty‐two children with a diagnosis of high‐functioning autism or Asperger's syndrome (26 males) and 52 TD children participated in the study. All children were between 8 and 12 years of age. ASD participants met the Diagnostic and Statistical Manual of Mental Disorders Fourth Edition (DSM‐IV) criteria for ASD [American Psychiatric Association, 1994]; diagnosis was subsequently confirmed using both the Autism Diagnostic Observation Schedule‐Generic (ADOS‐G) [Lord et al., 2000] and the Autism Diagnostic Interview‐Revised (ADI‐R) [Lord et al., 1994]. Children with identifiable causes of autism (e.g., Fragile X syndrome) and known neurological disorders, including epilepsy, were excluded based on responses recorded from a standardized parent interview, the Diagnostic Interview for Children and Adolescents (DICA‐IV) [Welner et al., 1987]. Intellectual functioning and basic reading abilities were assessed using the Wechsler Intelligence Scale for Children (WISC‐IV) [Wechsler, 2003]. The Perceptual Reasoning Index (PRI) from the WISC‐IV was used as the primary measure of intellectual functioning because recent evidence has suggested that perceptually based reasoning measures are more valid measures of intelligence in children with ASD than the more general Full‐Scale IQ [Mottron, 2004]. Handedness was evaluated using the Edinburgh Handedness Inventory [Oldfield, 1971]. Comparisons of FC between TD children and children with ASD were performed using only 33 of the 52 TD children to balance age, gender, handedness, Hollingshead Socioeconomic Status (SES), and perceptual reasoning between diagnostic groups (Table 1).
Table 1.
Demographic information for participants with autism (ASD) and typically developing (TD) children
| Gender | Age mean (SD) | Handedness mean (SD) | SES mean (SD) | PRI mean (SD) | Total ADOS mean (SD) | ||
|---|---|---|---|---|---|---|---|
| M | F | ||||||
| ASP | 13 | 4 | 10.13 (1.69) | 0.77 (0.44) | 54.4 (8.9) | 108.9 (11.4) | 14.5 (3.3) |
| HFA | 13 | 2 | 10.00 (1.38) | 0.56 (0.60) | 53.0 (12.2) | 107.4 (15.4) | 16.1 (4.2) |
| ASD | 26 | 6 | 10.07 (1.53) | 0.67 (0.52) | 53.8 (10.5) | 108.2 (13.2) | 15.0 (3.8) |
| TD | 26 | 7 | 10.28 (1.23) | 0.69 (0.43) | 56.6 (6.0) | 106.9 (12.1) | n/a |
| X 2 = 0.804 | p = 0.54 | p = 0.89 | p = 0.18 | p = 0.68 | |||
Information on the breakdown of the ASD group into subgroups of children with Asperger's (ASP) and high‐functioning autism (HFA) is also included. p Values are for the ASD group as a whole compared with the TD group.
SES, socioeconomic status; ADOS, Autism Diagnostic Observation Schedule; PRI, Perceptual Reasoning Index.
Adult validation participants
Test‐retest reliability imaging data from 20 healthy adult volunteers with no history of neurological conditions (10 males, 22–61 years old, right‐handed) were also used in this study. Data from these adults have been previously reported [Landman et al., 2011] and are available from the Neuroimaging Informatics Tools and Resource Clearinghouse (http://www.nitrc.org).
MRI Data Acquisition
Children
To minimize movement, children performed a mock scan the day before testing in which they were instructed to remain as still as possible. During testing, resting‐state fMRI scans were acquired on a Phillips 3T (Achieva, Philips Healthcare, Best, The Netherlands) using a single‐shot, partially parallel (SENSE) gradient‐recalled echo planar sequence (TR/TE = 2500/30 ms, FA = 70°, 3‐mm axial slices with no slice gap, and 124–156 time points) with an eight‐channel head coil. An ascending slice order was used to minimize motion‐induced artifacts [Landman et al., 2011]. Participants were instructed to relax and fixate on a cross‐hair while remaining as still as possible. A T1‐weighted anatomical image was also acquired to be used as a template for spatial normalization of functional images.
Adults
The imaging parameters for the adults were similar to those used for the children with the following exceptions: (1) TR = 2.0 s, (2) flip angle = 75°, and (3) slice gap = 1 mm. Each adult completed two 7‐min resting‐state scans separated by a short break during which the participant exited the scanner.
fMRI Data Analysis
Image preprocessing
Functional images were adjusted to account for slice acquisition order and participant motion, coregistered with each participant's anatomical image and normalized to Montreal Neurological Institute (MNI) space using unified segmentation. No participant included in these analyses moved more than 3 mm (x, y, and z) or 2° (roll, pitch, and yaw) between any two volume acquisitions. Nuisance covariates from white matter and CSF were estimated separately using CompCor [Behzadi et al., 2007] and were then regressed from the resting state data along with the motion realignment parameters, global mean signal and linear trends. Data were then temporally filtered using a 0.01–0.1 Hz pass band. All preprocessing steps were completed using custom Matlab® (The Mathworks) scripts and SPM 5 (Wellcome Department of Imaging Neuroscience).
Region of interest selection
The M1 region of interest (ROI) was selected from the “Type II Eve Atlas” [Oishi et al., 2009] and was transformed to MNI space using unified segmentation normalization in SPM 5 (Wellcome Department of Imaging Neuroscience); the resulting ROI was downsampled to 4‐mm resolution to reduce computational demands and contained 2,318 voxels. The entire ROI was used for adult participants (Fig. 1). For children, voxels that were not within the brain space of all participants were excluded from analysis.
Figure 1.
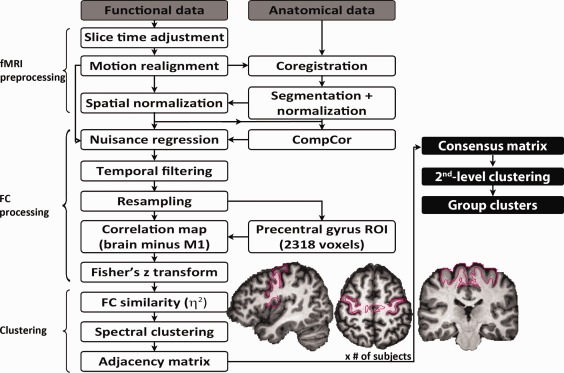
Flowchart of the analysis stream. All participant‐level processing steps are outlined, and the segmentation of the precentral gyrus used as our initial ROI is illustrated. The procedure through which data from individual participants were combined to produce group‐level parcellation maps is also described (steps in filled black boxes). [Color figure can be viewed in the online issue, which is available at http://wileyonlinelibrary.com.]
Functional connectivity analysis
For each voxel within the M1 ROI, an FC map was generated by correlating the time course of the given M1 voxel with the time courses of all voxels within the brain, excluding other M1 voxels. These FC maps were then converted to Z‐scores using the Fisher transform. Similarity of FC maps for every pair of voxels within the ROI was computed using η2 [Barnes et al., 2010, 2012; Cohen et al., 2008; Kelly et al., 2010, 2012; Nelson et al., 2010], resulting in a square η2 matrix. η2 is the fraction of the variance in one FC map accounted for by the variance in a second FC map:
where a i and b i are the values at position i in the FC maps a and b, respectively. m i is the mean value of the two FC maps at position i and is the grand mean across all locations in both correlation maps. As outlined by Cohen et al. 2008, the η2 statistic may be more sensitive to differences in FC maps compared with other commonly used measures of similarity such as Pearson's correlation coefficient, which measures association not agreement. Suppose that the values of one correlation map, a, are a scalar of b (a i = b i × x). For any value of x < 0, the correlation between maps a and b will be −1, and for any x > 0, the correlation will be 1, even though the maps differ from one another at every point and for some x, will have η2 values much less than one. Unlike the scale‐invariant Pearson's correlation, η2 will only equal one if two FC maps are identical at every point. For comparison, we replicated part of our analysis using Pearson's correlation coefficient as our measure of similarity and found that the results were robust to the similarity measure used (see Supporting Information Fig. S1).
Presuming a dimensionality of the number of clusters, k (estimation of k detailed below in section “Estimation of k”), spectral clustering [Zelnik‐Manor and Perona, 2004] was applied to the η2 matrix, which divided the ROI into k clusters. A binary adjacency matrix was then computed using the clustering results; each element of the adjacency matrix was assigned a one if the corresponding pair of voxels belonged to the same cluster and zero otherwise, resulting in a binary square matrix the same size as the η2 matrix. Adjacency matrices were averaged across subjects to generate a consensus matrix for each group [Kelly et al., 2010]. Each element of the consensus matrix corresponded to the proportion of times a given pair of voxels was assigned to the same parcel across participants. Spectral clustering was reapplied to the group consensus matrices to yield group‐level clustering results; this two‐level approach to clustering has been shown to produce group parcels that are more functionally homogeneous than group parcels produced by approaches that bypass participant‐level clustering [Craddock et al., 2012] and minimizes the contribution of spurious individual variability [Kelly et al., 2012]. Figure 1 illustrates all participant‐level processing steps and how data from individual participants were combined to produce group‐level parcellation maps.
Estimation of k
To estimate the optimal number of functional parcels in which to divide the M1 ROI, we relied on scan‐rescan reliability data collected from adults. For each of the two imaging sessions, consensus matrices were computed for a range of values of k (2–11), and then spectral clustering was performed on the consensus matrices to identify M1 partitions. The numbering of parcels by the clustering algorithm was arbitrary for each value of k; the partition labeled as “1” for session 1 did not necessarily correspond to the partition labeled as “1” for session 2. We devised a procedure to match parcels across groups by maximizing the average spatial similarity of all parcels between groups as defined by Dice's coefficient, a measure of set agreement or overlap [Dice, 1945]. After matching parcels across imaging sessions, we assessed the similarity of the cluster solutions generated for sessions 1 and 2 using Dice's coefficient for each value of k. We defined the optimal k to be the nontrivial (i.e., k > 2) clustering solution that demonstrated the highest scan‐rescan Dice's coefficient. To assess the uncertainty in this estimate of the number of M1 partitions, we implemented a jack knife procedure. Group‐level clustering was performed for each value of k 20 times, excluding test‐retest data from one participant each time. Figure 2A illustrates the jack knife estimate and standard error of Dice's coefficient between sessions for each k as well as the observed Dice using test‐retest data from all 20 participants. Although we acknowledge that there is clearly a lot of uncertainty in this estimate, we observed that searching for five parcels within M1 resulted in the highest test‐retest overlap, and Supporting Information Figure S2 illustrates that the functional organization of M1 does not change drastically whether we look for three, four, five, or six parcels (all of which showed a high level of agreement between the two sessions), suggesting that the general organization of M1 is not driven by our choice of k.
Figure 2.
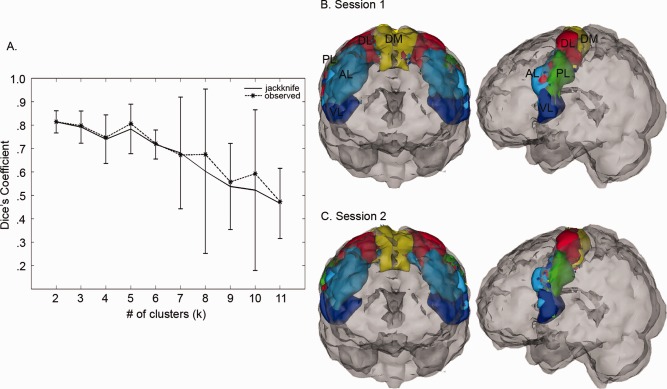
Selection of the optimal number of M1 clusters, k. (A) For each value of k, the similarity of clustering solutions generated from test‐retest resting‐state scans collected from 20 neurotypical adults was assessed using Dice's coefficient (dashed black line). A jack knife procedure was used to estimate the variance (solid black line). Dice coefficients closer to 1 indicate better consistency between solutions computed for each scanning session. (B) 3D illustration of clustering results using the optimal number of clusters (k = 5) for session 1 and (C) session 2. Cluster labels were assigned based on location within M1. DM, dorsomedial; DL, dorsolateral; AL, anterior lateral; PL, posterior lateral; VL, ventrolateral.
TD versus ASD M1 parcellation
For the estimated k of 5, TD and ASD parcels were compared based on spatial overlap as defined by Dice's coefficient and differences in size (the volume of each parcel). The statistical significance of the observed group differences in these spatial patterns was assessed using a permutation procedure. Distributions of these spatial patterns were generated according to the null hypothesis of no difference between groups by randomly permuting diagnostic labels for the 32 ASD and the 33 TD participants balanced according to age, gender, handedness, SES, and PRI. We calculated consensus matrices for the permuted groups, performed spectral clustering on the consensus matrices to identify cluster solutions for the estimated k, and repeated this procedure 10,000 times. The numbering of permuted group clustering solutions was matched across iterations by maximizing the average Dice's coefficient between all parcels, after which spatial overlap and size differences between corresponding parcels from each random group were calculated. For the spatial overlaps of correctly labeled TD and ASD parcels to be considered statistically significant, they had to fall above the 95th percentile of the relevant empirical null distribution, equivalent to a one‐sided test; parcel size differences had to fall above the 97.5th percentile, equivalent to a two‐sided test.
M1 parcellation in younger and older TD children
To investigate the effect of age on M1 organization in children, TD children were divided into two groups: 8‐ to 9‐year olds (n = 22, 17 males) and 11‐ to 12‐year olds (n = 19, 14 males). Children between 10.0 and 10.9 years of age were excluded to establish a distinct gap between the two groups. Consensus matrices were calculated for each age group, and spectral clustering was applied to the consensus matrices for the previously determined optimal k to yield M1 organization maps for each TD age group.
RESULTS
M1 Parcellation in Adults
The optimal number of functional parcels for M1 was estimated to be 5, which was the nontrivial (k > 2) clustering solution that resulted in the highest Dice's coefficient between clustering solutions for the two imaging sessions (Fig. 2A). Figure 2B,C illustrates the functional segregation of M1 using the estimated k for each imaging session. To facilitate discussion, parcels were assigned names based on their location within M1: dorsomedial (DM, yellow areas), dorsolateral (DL, red areas), anterior lateral (AL, cyan areas), posterior lateral (PL, green areas), and ventrolateral (VL, blue areas). Two salient features of the estimated M1 parcellation were observed: (1) the overall dorsomedial to ventrolateral organization and (2) the interhemispheric connectivity present within each parcel that emerged without imposing a spatial constraint on the clustering algorithm. An animation showing a 360° rotation of the functional segregation of M1 using the estimated k for each imaging session is included in the Supporting Information Video 1. A comparison of Figure 2 with Supporting Information Figure S1 demonstrates that similar organization is estimated within M1 regardless of the similarity measure used, and Supporting Information Figure S2 illustrates that the functional organization of M1 does not change drastically whether we look for three, four, five, or six parcels, suggesting that the general organization of M1 is also not driven by our choice of k.
TD Versus ASD M1 Parcellation
Figure 3A,B illustrates the parcellation of M1 using k = 5 for our TD and ASD groups, respectively, and an animation showing a 360° rotation of the functional segregation of M1 using k = 5 for both groups is included in the Supporting Information Video 2. Figure 3C,D summarizes the results of the permutation procedure. Among the five parcels, we observed significant spatial differences between groups in three. The dorsomedial‐most parcel (DM) was significantly larger (+10.6 cm3, P = 0.05) in the ASD group than in the TD group (Fig. 3C). No other significant differences in size were observed; however, spatial overlaps of the two parcels closest to the hand knob of M1 [Yousry et al., 1997], the DL and AL parcels, were worse between groups than predicted by permutation (Fig. 3D). These discrepancies in the functional segregation of M1 emerged despite matching parcels across groups by maximizing the average spatial similarity of all parcels.
Figure 3.
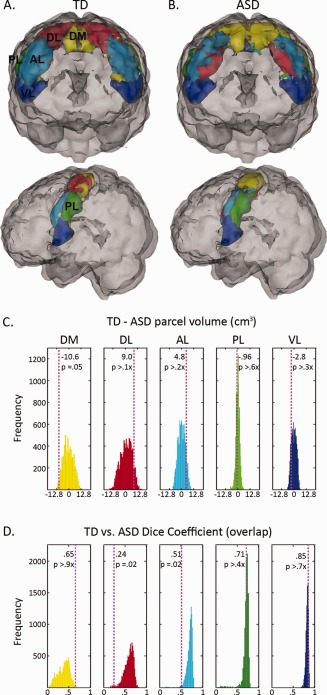
TD versus ASD M1 organization. (A) Illustration of cluster solution using k = 5 for typically developing (TD) children and (B) children with autism (ASD). Panels (C) and (D) report on the results of permutation testing. The histograms illustrate the distribution of (C) volume differences (in cm3) and (D) overlaps as measured by Dice's coefficient when diagnostic labels were randomly assigned. The color of each histogram reflects the color of the corresponding parcel in panels (A) and (B). The dashed, vertical lines indicate (C) the observed size differences and (D) overlaps between correctly labeled TD and ASD parcels. In (C), a positive value indicates that the TD parcel was larger than the corresponding ASD parcel; a negative value indicates that the TD parcel was smaller than the ASD parcel. In (D), a Dice coefficient closer to 1 indicates greater overlap between groups. DM, dorsomedial; DL, dorsolateral; AL, anterior lateral; PL, posterior lateral; VL, ventrolateral.
M1 Parcellation in Younger and Older TD Children
Because we observed significant differences between M1 organization in our TD and ASD groups, we explored the possibility that the observed differences might reflect a developmental delay. To this end, we divided our larger pool of TD within the age range of our ASD participants into two age groups: young (8–9) and old (11–12). Figure 4A,B demonstrates the parcellation of M1 for TD age subgroups within the age range of our ASD group. Qualitatively, M1 organization in the younger TD group (Fig 4A) was similar to M1 organization in the ASD group (Fig 4C) in that the DM parcel appeared to be more extensive compared with the DM parcel in the older TD group (Fig 4B) and in adults (Fig 4D).
Figure 4.
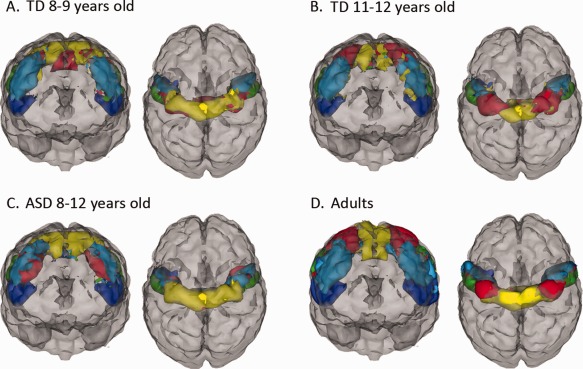
M1 parcellation in younger and older TD children. (A) Illustration of M1 parcellation in 8‐ to 9‐year‐old typically developing (TD) children and (B) in 11‐ to 12‐year‐old TD children compared with (C) children with autism (ASD) and (D) neurotypical adults.
DISCUSSION
The aim of this study was to compare the functional organization of primary motor cortex in children with ASD and TD children by partitioning M1 using resting‐state FC data. Our voxel‐wise clustering approach allowed distinctions between M1 subregions to emerge from the data without the imposition of a priori restrictions on the partitioning, beyond the initial selection of the precentral gyrus ROI. The number of clusters (i.e., five) for the two groups was estimated using test‐retest data from a sample of healthy adults by finding the number of clusters that produced the highest set agreement between clusters for the two imaging sessions. Within adults and both groups of children, clustering M1 into five parcels revealed a dorsomedial to ventrolateral organization (Figs. 2B,C and 3A,B), which extended across both hemispheres in a fairly symmetrical manner. The clusters corresponded to the gross organization of the motor homunculus with the DM cluster representing the legs/trunk and the ventrolateral‐most (VL) cluster representing oro‐facial function. Although this gross organizational scheme was present in both groups of children, significant differences in the size and segregation of the parcels between pediatric groups suggest that basic motor representations may be altered in ASD children. Specifically, the DM cluster was larger in children with ASD (yellow area, Fig. 3B) and encompassed much of the space occupied by the adjacent dorsolateral (DL) cluster in TD children (red area, Fig. 3A), whereas the DL and AL clusters showed significant differences in overlap between the two groups. These differences may suggest that leg/trunk and upper limb/hand representations are less distinct in ASD children, and this anomalous organization may be associated with many of the fine and gross motor deficits observed in children with autism.
Typical M1 Organization
Before examining functional organization differences between TD and ASD children, we needed to establish that the boundaries of the M1 parcels we identified were not arbitrary and in fact reflect functional subdivisions of M1. One method for determining the functional relevance of these parcels would be to collect fMRI data from the same participants while asking them to move various body parts; however, it would be difficult to evoke activity in the motor cortex without coactivating primary somatosensory cortex [Mayka et al., 2006], and asking participants to move proximal body parts without moving their heads is a challenging task even in adults. In the absence of such task activation data, several salient features of the M1 parcels identified in this study lend credibility to their segregation and help to shed light on their potential relevance.
Penfield's pioneering cortical stimulation work demonstrated that motor regions along the precentral gyrus are organized in a somatotopic fashion; regions that control our feet are systematically distinct from regions that control our fingers or other body parts [Penfield and Boldrey, 1937; Penfield and Rasmussen, 1950; Rasmussen, 1977]. Numerous task‐dependent neuroimaging experiments have affirmed the results of Penfield; although some degree of overlap exists among body part representations, the localization of activity within the M1 evoked by a motor task is reflective of the body part involved in the task [Grafton et al., 1991; Meier et al., 2008; Newton et al., 2008], with the ventrolateral‐most region being reserved for oro‐motor function and the dorsomedial‐most region subserving control of the feet.
Consistent with this motor homunculus, we observed that M1 was organized in a generally dorsomedial to ventrolateral fashion in all groups, suggesting that the VL parcels (blue in Figs. 2) represent M1 resources dedicated to controlling the vocal cords, whereas the DM parcels represent M1 resources recruited by the lower limbs/trunk (yellow in Figs. 2). The posterior lateral (PL) parcel (green), with a center of mass (COM) in each hemisphere 52 mm from the midline in adults, covered previously reported activation foci for tongue movements [Alkadhi et al., 2002; Grabski et al., 2011]. In addition, the DL parcel (red in Fig. 2), with a COM in each hemisphere 32 mm from the midline in adults, encompassed previously reported peaks of activation evoked by hand movements [Alkadhi et al., 2002; Plow et al., 2010]; however, the cortical territory of the remaining AL parcel (cyan in Fig. 2) also contained reported activation evoked by hand movements [Mostofsky et al., 2009]. A few reports in both the macaque [Strick and Preston, 1982] and human [Geyer et al., 1996; Kawashima et al., 1995; Meier et al., 2008] neuroimaging literature show that the arm and hand are doubly represented in M1. Furthermore, analysis of cytoarchitecture and distributions of transmitter binding sites have revealed an anterior–posterior division within M1, with the hand being represented in each [Geyer et al., 1996]; similar to the orientation of our DL and AL parcels, the posterior division was located medially to the more lateral anterior division.
In addition to their dorsomedial to ventrolateral organization, all of our M1 parcels turned out to be bilateral. No spatial constraint was incorporated into our clustering algorithm, and this within‐parcel symmetry across brain hemispheres emerged despite the exclusion of M1 from our calculation of the FC similarity between voxels. This symmetry is consistent with previously reported findings of strong interhemispheric FC within the motor control network [Barber et al., 2012; Biswal et al., 1995] but also suggests that in TD children and adults, the right hand is more functionally connected with the left hand than it is with the right foot. Similarly, van den Heuvel and Hulshoff Pol 2010 observed that spontaneous resting‐state fMRI signals from seed regions within M1 were most strongly correlated with the time series of subregions in the contralateral motor cortex that had a near‐mirror spatial orientation with respect to the selected seeds. Because the method used to partition M1 in this study was based on the similarity of whole‐brain FC maps excluding other M1 voxels, the observed interhemispheric connectivity within parcels suggests the presence of functionally linked interhemispheric subnetworks within the motor control network. Several anatomic tracing studies have shown that the specific motor subregions of the right and left hemispheres are one‐to‐one structurally connected by cortico‐cortical white matter pathways [Doron and Gazzaniga, 2008; Schmahmann and Pandya, 2007; Wahl et al., 2007]. However, whether these structural and functional interhemispheric connections between components of the motor control network are inhibitory [Garvey et al., 2005] or facilitatory [Meister et al., 2010] remains unclear.
TD Versus ASD M1 Organization
Pruning of local cortical connections has been implicated in the establishment of functional specialization [Fair et al., 2007; Schroeder and Lakatos, 2009]. The enlarged size of the dorsal‐most M1 parcel (yellow area, Fig. 3B) suggests that in children with ASD, the functional segregation of the upper and lower limbs is reduced compared with TD children. In other words, control of the right hand is less distinct from control of the right foot in ASD, which is consistent with the theory that autism may be characterized by increased local (within hemisphere) connectivity, possibly at the expense of long‐range connectivity [Belmonte et al., 2004; Courchesne, 2004].
The continuity of the enlarged dorsal‐most parcel across hemispheres in ASD also suggests that the right hand is less functionally distinct from the left foot compared with TD children. Houzel and Milelret proposed that the ability of callosal axons from a single area in one hemisphere to terminate on target neurons in the contralateral hemisphere provides a potential mechanism for the grouping of individual neurons into functionally coherent assemblies [Houzel and Milleret, 1999]. Evidence of reduced corpus callosum size [Casanova et al., 2009], in conjunction with smaller cortical minicolumns in patients with ASD [Casanova et al., 2002, 2006], suggests that each callosal terminal should contact more minicolumns in the brains of individuals with ASD compared with neurotypical controls. This potential in ASD for greater divergence of callosal information between hemispheres, as well as increased connectivity within hemispheres, could contribute to the reduced functional separation we observed between the dorsomedial and dorsolateral regions of M1 in children with ASD compared with TD children.
Behaviorally, reduced functional segregation of the hands and feet in M1 is consistent with the findings of Esposito and Venuti 2008 who reported in a recent retrospective study that some of the largest abnormalities observed in the walking patterns of children who were later diagnosed with ASD were in the way that they used their arms. In addition, Jansiewicz et al. reported a range of motor problems in children with ASD, including excessive overflow movements [Jansiewicz et al., 2006], and these unintentional and unnecessary movements that accompany voluntary activity may reflect delayed motor development [Cole, 2008]. Examination of the correlation between individual variability in FC within the dorsal region of M1 and behavioral measures of motor function (e.g., overflow) may help to illuminate the behavioral relevance of the convergence of the DM and DL parcels in children with ASD.
In addition to observing less functional segregation in the dorsal‐most region of M1 in children with ASD, we also observed functional segregation differences between groups in the “middle region” of M1 between the dorsal and ventral extremes. This “middle region,” which included the anterior bank of the central sulcus, was partitioned into two parcels, AL and PL, in the TD group (Fig. 3A). In the ASD group, this region was partitioned into three parcels (Fig. 3B), which resulted in significant differences in the overlap of two of the three parcels between groups (Fig. 3D). We cannot rule out the possibility that the increased number of functional partitions in this area may be an artifact of our decision to look for five parcels in both groups. However, this seems unlikely as the four remaining parcels did not appear to be affected equally by the enlarged size of the DM parcel in the ASD group. The size and shape of the VL parcel appeared to be similar across groups, and significant differences in parcel overlap were only found in this “middle region.”
Evidence from animal studies suggest that this “middle region” of M1 may contribute to dexterity; retrograde tracing in rhesus monkeys identified the anterior bank of the central sulcus as a subdivision of M1 with direct access to an intermingling of motoneurons innervating shoulder, elbow, and finger muscles [Rathelot and Strick, 2009]. This direct connection between the cortex and motoneurons may be critical to manual dexterity [Rathelot and Strick, 2009] by enabling M1 to generate novel patterns of muscle activity on the fly and outside of the constraints imposed by the intrinsic circuitry of the spinal cord. In addition, the overlap of elbow and shoulder cortico‐motoneuronal (CM) cells with finger CM cells suggests that this subregion of M1 may be responsible for generating muscle synergies for multijoint as well as single‐joint movements of the arm/hand [Cheney and Fetz, 1985; McKiernan et al., 2000].
That we observed atypical functional segregation in an area implicated in the coordination of muscle groups suggests that children with ASD may experience difficulty generating complex muscle synergies necessary to perform highly skilled movements. In fact, children with ASD exhibit impairments when asked to imitate or pantomime complex motor gestures [Dowell et al., 2009; Mostofsky et al., 2006]. Children with ASD also demonstrate impairments in letter formation during writing, a highly skilled motor behavior, and motor performance has been shown to correlate with overall handwriting quality in ASD children, suggesting that general difficulties with motor control contribute to poor handwriting [Fuentes et al., 2009]. Again, investigation of the correlation between FC within this region and performance of skilled movements in individual participants could shed light on the functional relevance of these organizational differences.
Delayed Development
This study found that the organization of the primary motor cortex is atypical in children with ASD compared with TD children. We speculated that these M1 organization differences, with a lack of differentiation between lower limb/trunk regions and upper limb/hand regions, may be due, at least in part, to a delay in functional specialization within the motor cortex. In several resting‐state networks, correlated neural ensembles appear to develop locally first, with distributed networks arising in adolescence or early adulthood [Fair et al., 2009], suggesting a neurodevelopmental mechanism of overconnectivity followed by pruning or weakening of short‐range functional connections. Although caution is required when making inferences about developmental processes from cross‐sectional data, qualitative comparison of M1 organization in the ASD group with that of younger and older TD children suggested that M1 organization in 8‐ to 12‐year‐old children with ASD more closely resembled that of 8‐ to 9‐year‐old TD children (Fig. 4A) than it did 11‐ to 12‐year‐old TD children (Fig. 4B). In particular, ASD children show little distinction between the DM cluster representing the legs and trunk and the adjacent DL region, which likely represents the arms and hands. Similarly, younger, 8‐ to 9‐year‐old TD children appeared to have less distinct representations of these two adjacent dorsal regions compared with older TD children. These qualitative findings are consistent with behavioral evidence that motor impairments are due to a developmental delay in autism [Gidley‐Larson and Mostofsky, 2006]; however, it is not known how this developmental delay impacts functional relationships with other brain regions or whether atypical M1 organization resolves itself in adulthood. Although these qualitative comparisons between children with ASD and different age groups of TD children are potentially developmentally interesting, more rigorous statistical examination of the influence of age on M1 functional organization is necessary to validate this observation. Further examination is also needed to determine whether anomalous M1 organization persists in adults with ASD.
Abnormal FC within the subnetworks of the motor control system may lead not only to basic motor impairments but also to anomalous formation of spatial and motor representations of skilled movements and which could then contribute to difficulties with acquisition and performance of complex, skilled gestures. Gestures are tightly linked to communication [Iverson and Fagan, 2004] and early motor experiences have been shown to influence the emergence of social behaviors [Libertus and Needham, 2011], suggesting that the altered functional organization of M1 we observed in children with ASD may affect not only basic motor skills but also social and communicative behavior. Motor control develops relatively early, and the motor control network can be identified in the brain by 6 months of age [Dubois et al., 2009]. The early establishment of altered motor representations in ASD may set the stage for altered representations of motor commands and/or later developing motor skills. The clustering method used in this study relied on the connectivity patterns of voxels within M1 to all other voxels outside of M1; thus, the functionally homologous M1 parcels identified in this study reflect not only relationships between basic motor regions (excluding primary motor cortex) but also relationships with more associative regions critical to skill learning and goal‐directed behavior. Further research is necessary to determine whether this altered M1 connectivity may be due to the early development of atypical motor representations or to other factors influencing network development in ASD.
Limitations
Several important limitations of this study exist. Despite their utility, clustering analyses are subject to the same fundamental limitation as other model‐free approaches, specifically parameter estimation. Because of the lack of a priori knowledge concerning the “true” number of clusters in M1, the current study used test‐retest data collected from healthy adults to estimate the optimal number of functional partitions for M1. There was a lot of uncertainty in our estimate of the number of partitions. Despite this uncertainty, using five clusters resulted in qualitatively similar M1 organization in TD children compared with our adult validation group. We believe in the use of highly reliable test‐retest adult data for parameter estimation because neurotypical adults represent the end result of development.
Another limitation of this study is that resting‐state fMRI does not provide information about the directionality of functional connections. Not knowing whether functional connections are feedforward (ascending) or feedback (descending) should not affect clustering per se, but it does make it difficult to interpret of the observed differences in the functional organization of M1.
M1 parcels at the participant level are considerably noisier than at the group level. By using a two‐stage consensus clustering approach, we attempted to minimize the effect of spurious intragroup variation on our estimates of M1 organization, which made it easier to compare M1 parcels across groups, and the resulting parcels were reliable across imaging sessions. However, not all intragroup variability is spurious, and examination of the influence of nonspurious variation in parcel shape and connectivity on behavioral measures of both motor performance and ASD severity could potentially help to explain the clinical relevance of the observed group differences. Before we can accurately examine these potential brain‐behavior associations, we must first improve our estimates of M1 organization at the participant level, which is a primary goal of future work.
The clinical presentation of ASD is highly heterogeneous, and it has been previously suggested that there might be more variability in ASD samples regarding the localization of functional brain regions [Muller et al., 2004]. We attempted to minimize the influence of this heterogeneity on our results in three ways: (1) by limiting our sample to high‐functioning children in a fairly restricted age range, (2) by closely balancing the demographic characteristics of our two pediatric groups, and (3) by using a two‐stage consensus clustering approach to produce group clusters that were robust to individual variation. Nevertheless, it is unclear how much intragroup variability contributed to the observed differences in M1 functional segregation. It is also unclear whether the observed group differences in M1 functional organization are specific to ASD or are common to other neurodevelopmental conditions involving motor disturbances. Although the influence of interindividual variability on the functional segregation of M1 is of considerable interest, it is beyond the scope of this exploratory study. As we continue to collect data and build upon the methods reported here, we will be able to explore the reproducibility of these findings in independent samples of children with ASD as well as their specificity and clinical relevance.
CONCLUSION
Despite these limitations, this research utilized an innovative methodological approach to explore functional organization differences within the motor cortex in children with ASD compared with TD children. Clustering techniques applied to resting‐state FC data have been shown to be effective at localizing functionally relevant subdivisions of anatomically defined regions [Cohen et al., 2008; Kelly et al., 2010; Kim et al., 2010; van den Heuvel et al., 2008] but have most commonly been applied to investigations of normal brain function. The present results extend these findings in two regards. First, we generated what we believe to be functionally relevant partitions in M1 based solely on the patterns of connectivity between individual M1 voxels and all other voxels outside of M1, and secondly, we devised a simple method for matching these partitions across groups of participants and testing group differences. In so doing, we were able to identify differences in the size and segregation of M1 parcels in children with ASD compared with TD children, suggesting that the functional subnetworks of the motor control system may be altered in autism.
Supporting information
Figure S1. Selection of the optimal number of M1 clusters, k, using a shifted and scaled version of Pearson's correlation coefficient to measure functional connectivity map similarity prior to clustering. (A) For each value of k, the spatial agreement of clustering solutions generated from test‐retest resting state scans collected from 20 neurotypical adults was assessed using Dice's coefficient (dashed black line). A jack knife procedure was used to estimate the variance (solid black line). (B) 3D Illustration of clustering results using the optimal number of clusters (k = 5) for both imaging sessions. A comparison of Figure S1 with Figure 2 demonstrates that similar organization is estimated within M1 regardless of the similarity measure used.
Figure S2. Patterns of functional organization within M1 when searching for different numbers of partitions. Functional organization within M1 is illustrated for (A) test and (B) retest functional connectivity data collected from adults when different numbers of clusters are specified (each row). M1 organization in adults does not change drastically whether we look for three, four, five or six parcels, suggesting that the general organization of M1 is not driven by our choice of k.
Video 1. Animation showing a 360° rotation of the test‐retest similarity of the functional segregation of the primary motor cortex in adults using the estimated k. Session 1 is on the left and session 2 is on the right.
Video 2. Animation showing a 360° rotation of the functional segregation of the primary motor cortex using k=5 for typically developing (TD) children (on the left) and children with autism (ASD, on the right).
Acknowledgments
The authors thank MRI technologists Terri Brawner, Kathleen Kahl, and Ivana Kusevic for assistance with data acquisition as well as Ani Eloyan and Deana Crocetti for comments on the manuscript. Dr. Pekar serves as Manager of the F.M. Kirby Research Center, which receives support from Philips Health Care, which makes the MRI scanners used in this study.
REFERENCES
- Alkadhi H, Crelier GR, Boendermaker SH, Golay X, Hepp‐Reymond MC, Kollias SS (2002): Reproducibility of primary motor cortex somatotopy under controlled conditions. AJNR Am J Neuroradiol 23:1524–1532. [PMC free article] [PubMed] [Google Scholar]
- American Psychiatric Association (1994): Diagnostic and Statistical Manual of Mental Disorders, 4th ed Washington, DC: American Psychiatric Association. [Google Scholar]
- Barber AD, Srinivasan P, Joel SE, Caffo BS, Pekar JJ, Mostofsky SH (2012): Motor “dexterity”?: Evidence that left hemisphere lateralization of motor circuit connectivity is associated with better motor performance in children. Cereb Cortex 22:51–59. [DOI] [PMC free article] [PubMed] [Google Scholar]
- Barnes KA, Cohen AL, Power JD, Nelson SM, Dosenbach YB, Miezin FM, Petersen SE, Schlaggar BL (2010): Identifying basal ganglia divisions in individuals using resting‐state functional connectivity MRI. Front Syst Neurosci 4:18. [DOI] [PMC free article] [PubMed] [Google Scholar]
- Barnes KA, Nelson SM, Cohen AL, Power JD, Coalson RS, Miezin FM, Vogel AC, Dubis JW, Church JA, Petersen SE, Schlagger BL (2012): Parcellation in left lateral parietal cortex is similar in adults and children. Cereb Cortex 22:1148–1158. [DOI] [PMC free article] [PubMed] [Google Scholar]
- Beckmann CF, DeLuca M, Devlin JT, Smith SM (2005): Investigations into resting‐state connectivity using independent component analysis. Philos Trans R Soc Lond B Biol Sci 360:1001–1013. [DOI] [PMC free article] [PubMed] [Google Scholar]
- Behzadi Y, Restom K, Liau J, Liu TT (2007): A component based noise correction method (CompCor) for BOLD and perfusion based fMRI. Neuroimage 37:90–101. [DOI] [PMC free article] [PubMed] [Google Scholar]
- Belmonte MK, Allen G, Beckel‐Mitchener A, Boulanger LM, Carper RA, Webb SJ (2004): Autism and abnormal development of brain connectivity. J Neurosci 24:9228–9231. [DOI] [PMC free article] [PubMed] [Google Scholar]
- Biswal B, Yetkin FZ, Haughton VM, Hyde JS (1995): Functional connectivity in the motor cortex of resting human brain using echo‐planar MRI. Magn Reson Med 34:537–541. [DOI] [PubMed] [Google Scholar]
- Casanova MF, Buxhoeveden DP, Switala AE, Roy E (2002): Minicolumnar pathology in autism. Neurology 58:428–432. [DOI] [PubMed] [Google Scholar]
- Casanova MF, van Kooten IA, Switala AE, van Engeland H, Heinsen H, Steinbusch HW, Hof PR, Trippe J, Stone J, Schmitz C (2006): Minicolumnar abnormalities in autism. Acta Neuropathol 112:287–303. [DOI] [PubMed] [Google Scholar]
- Casanova MF, El‐Baz A, Mott M, Mannheim G, Hassan H, Fahmi R, Giedd J, Rumsey JM, Switala AE, Farag A (2009): Reduced gyral window and corpus callosum size in autism: Possible macroscopic correlates of a minicolumnopathy. J Autism Dev Disord 39:751–764. [DOI] [PMC free article] [PubMed] [Google Scholar]
- Cheney PD, Fetz EE (1985): Comparable patterns of muscle facilitation evoked by individual corticomotoneuronal (CM) cells and by single intracortical microstimuli in primates: Evidence for functional groups of CM cells. J Neurophysiol 53:786–804. [DOI] [PubMed] [Google Scholar]
- Cohen AL, Fair DA, Dosenbach NU, Miezin FM, Dierker D, Van Essen DC, Schlaggar BL, Petersen SE (2008): Defining functional areas in individual human brains using resting functional connectivity MRI. Neuroimage 41:45–57. [DOI] [PMC free article] [PubMed] [Google Scholar]
- Cole LL (2008): Autism in school‐age chidren. A complex collage of development, behavior and communication. Adv Nurse Pract 16:38–47; quiz 47‐48. [PubMed] [Google Scholar]
- Courchesne E (2004): Brain development in autism: Early overgrowth followed by premature arrest of growth. Ment Retard Dev Disabil Res Rev 10:106–111. [DOI] [PubMed] [Google Scholar]
- Craddock RC, James GA, Holtzheimer PEIII, Hu XP, Mayberg HS (2012): A whole brain fMRI atlas generated via spatially constrained spectral clustering. Hum Brain Mapp 33:1914–1928. [DOI] [PMC free article] [PubMed] [Google Scholar]
- Damoiseaux JS, Rombouts SA, Barkhof F, Scheltens P, Stam CJ, Smith SM, Beckmann CF (2006): Consistent resting‐state networks across healthy subjects. Proc Natl Acad Sci USA 103:13848–13853. [DOI] [PMC free article] [PubMed] [Google Scholar]
- De Luca M, Beckmann CF, De Stefano N, Matthews PM, Smith SM (2006): fMRI resting state networks define distinct modes of long‐distance interactions in the human brain. Neuroimage 29:1359–1367. [DOI] [PubMed] [Google Scholar]
- Dice L (1945): Measures of the amount of ecologic association between species. Ecology 26:297–302. [Google Scholar]
- Doron KW, Gazzaniga MS (2008): Neuroimaging techniques offer new perspectives on callosal transfer and interhemispheric communication. Cortex 44:1023–1029. [DOI] [PubMed] [Google Scholar]
- Dowell LR, Mahone EM, Mostofsky SH (2009): Associations of postural knowledge and basic motor skill with dyspraxia in autism: Implication for abnormalities in distributed connectivity and motor learning. Neuropsychology 23:563–570. [DOI] [PMC free article] [PubMed] [Google Scholar]
- Dubois J, Hertz‐Pannier L, Cachia A, Mangin JF, Le Bihan D, Dehaene‐Lambertz G (2009): Structural asymmetries in the infant language and sensori‐motor networks. Cereb Cortex 19:414–423. [DOI] [PubMed] [Google Scholar]
- Dziuk MA, Gidley Larson JC, Apostu A, Mahone EM, Denckla MB, Mostofsky SH (2007): Dyspraxia in autism: Association with motor, social, and communicative deficits. Dev Med Child Neurol 49:734–739. [DOI] [PubMed] [Google Scholar]
- Esposito G, Venuti P (2008): Analysis of toddlers' gait after six months of independent walking to identify autism: A preliminary study. Percept Mot Skills 106:259–269. [DOI] [PubMed] [Google Scholar]
- Fair DA, Dosenbach NU, Church JA, Cohen AL, Brahmbhatt S, Miezin FM, Barch DM, Raichle ME, Petersen SE, Schlaggar BL (2007): Development of distinct control networks through segregation and integration. Proc Natl Acad Sci USA 104:13507–13512.17679691 [Google Scholar]
- Fair DA, Cohen AL, Power JD, Dosenbach NU, Church JA, Miezin FM, Schlaggar BL, Petersen SE (2009): Functional brain networks develop from a “local to distributed” organization. PLoS Comput Biol 5:e1000381. [DOI] [PMC free article] [PubMed] [Google Scholar]
- Fournier KA, Kimberg CI, Radonovich KJ, Tillman MD, Chow JW, Lewis MH, Bodfish JW, Hass CJ (2010): Decreased static and dynamic postural control in children with autism spectrum disorders. Gait Posture 32:6–9. [DOI] [PMC free article] [PubMed] [Google Scholar]
- Fuentes CT, Mostofsky SH, Bastian AJ (2009): Children with autism show specific handwriting impairments. Neurology 73:1532–1537. [DOI] [PMC free article] [PubMed] [Google Scholar]
- Garvey MA, Barker CA, Bartko JJ, Denckla MB, Wassermann EM, Castellanos FX, Dell ML, Ziemann U (2005): The ipsilateral silent period in boys with attention‐deficit/hyperactivity disorder. Clin Neurophysiol 116:1889–1896. [DOI] [PubMed] [Google Scholar]
- Geyer S, Ledberg A, Schleicher A, Kinomura S, Schormann T, Burgel U, Klingberg T, Larsson J, Zilles K, Roland PE (1996): Two different areas within the primary motor cortex of man. Nature 382:805–807. [DOI] [PubMed] [Google Scholar]
- Gidley‐Larson JC, Mostofsky SH (2006): Motor deficits in autism In: Tuchman R, Rapin I, editors. Autism: A Neurobiological Disorder of Early Brain Development. International review of child neurology series. London: MacKeith Press: 231–247. [Google Scholar]
- Grabski K, Lamalle L, Vilain C, Schwartz JL, Vallee N, Tropres I, Baciu M, Le Bas JF, Sato M (2011): Functional MRI assessment of orofacial articulators: Neural correlates of lip, jaw, larynx, and tongue movements. Hum Brain Mapp 33:2306–2321. [DOI] [PMC free article] [PubMed] [Google Scholar]
- Grafton ST, Woods RP, Mazziotta JC, Phelps ME (1991): Somatotopic mapping of the primary motor cortex in humans: Activation studies with cerebral blood flow and positron emission tomography. J Neurophysiol 66:735–743. [DOI] [PubMed] [Google Scholar]
- Haswell CC, Izawa J, Dowell LR, Mostofsky SH, Shadmehr R (2009): Representation of internal models of action in the autistic brain. Nat Neurosci 12:970–972. [DOI] [PMC free article] [PubMed] [Google Scholar]
- Herbert MR, Ziegler DA, Makris N, Filipek PA, Kemper TL, Normandin JJ, Sanders HA, Kennedy DN, Caviness VSJr (2004): Localization of white matter volume increase in autism and developmental language disorder. Ann Neurol 55:530–540. [DOI] [PubMed] [Google Scholar]
- Houzel JC, Milleret C (1999): Visual inter‐hemispheric processing: Constraints and potentialities set by axonal morphology. J Physiol 93:271–284. [DOI] [PubMed] [Google Scholar]
- Hughes C (1996): Brief report: Planning problems in autism at the level of motor control. J Autism Dev Disord 26:99–107. [DOI] [PubMed] [Google Scholar]
- Iverson JM, Fagan MK (2004): Infant vocal‐motor coordination: Precursor to the gesture‐speech system? Child Dev 75:1053–1066. [DOI] [PubMed] [Google Scholar]
- Jansiewicz EM, Goldberg MC, Newschaffer CJ, Denckla MB, Landa R, Mostofsky SH (2006): Motor signs distinguish children with high functioning autism and Asperger's syndrome from controls. J Autism Dev Disord 36:613–621. [DOI] [PubMed] [Google Scholar]
- Jones V, Prior M (1985): Motor imitation abilities and neurological signs in autistic children. J Autism Dev Disord 15:37–46. [DOI] [PubMed] [Google Scholar]
- Kawashima R, Itoh H, Ono S, Satoh K, Furumoto S, Gotoh R, Koyama M, Yoshioka S, Takahashi T, Yanagisawa T (1995): Activity in the human primary motor cortex related to arm and finger movements. Neuroreport 6:238–240. [DOI] [PubMed] [Google Scholar]
- Kelly C, Uddin LQ, Shehzad Z, Margulies DS, Castellanos FX, Milham MP, Petrides M (2010): Broca's region: Linking human brain functional connectivity data and non‐human primate tracing anatomy studies. Eur J Neurosci 32:383–398. [DOI] [PMC free article] [PubMed] [Google Scholar]
- Kelly C, Toro R, Di Martino A, Cox CL, Bellec P, Castellanos FX, Milham MP (2012): A convergent functional architecture of the insula emerges across imaging modalities. Neuroimage 61:1129–1142. [DOI] [PMC free article] [PubMed] [Google Scholar]
- Kim JH, Lee JM, Jo HJ, Kim SH, Lee JH, Kim ST, Seo SW, Cox RW, Na DL, Kim SI, Saad ZS (2010): Defining functional SMA and pre‐SMA subregions in human MFC using resting state fMRI: Functional connectivity‐based parcellation method. Neuroimage 49:2375–2386. [DOI] [PMC free article] [PubMed] [Google Scholar]
- Landa R, Garrett‐Mayer E (2006): Development in infants with autism spectrum disorders: A prospective study. J Child Psychol Psychiatry 47:629–638. [DOI] [PubMed] [Google Scholar]
- Landman BA, Huang AJ, Gifford A, Vikram DS, Lim IA, Farrell JA, Bogovic JA, Hua J, Chen M, Jarso S, Smith SA, Joel SE, Mori S, Pekar JJ, Barker PB, Prince JL, van Zijl PC (2011): Multi‐parametric neuroimaging reproducibility: A 3‐T resource study. Neuroimage 54:2854–2866. [DOI] [PMC free article] [PubMed] [Google Scholar]
- Libertus K, Needham A (2011): Reaching experience increases face preference in 3‐month‐old infants. Dev Sci 14:1355–1364. [DOI] [PMC free article] [PubMed] [Google Scholar]
- Lord C, Rutter M, Le Couteur A (1994): Autism diagnostic interview‐revised: A revised version of a diagnostic interview for caregivers of individuals with possible pervasive developmental disorders. J Autism Dev Disord 24:659–685. [DOI] [PubMed] [Google Scholar]
- Lord C, Risi S, Lambrecht L, Cook EHJr, Leventhal BL, DiLavore PC, Pickles A, Rutter M (2000): The autism diagnostic observation schedule‐generic: A standard measure of social and communication deficits associated with the spectrum of autism. J Autism Dev Disord 30:205–223. [PubMed] [Google Scholar]
- Mayka MA, Corcos DM, Leurgans SE, Vaillancourt DE (2006): Three‐dimensional locations and boundaries of motor and premotor cortices as defined by functional brain imaging: A meta‐analysis. Neuroimage 31:1453–1474. [DOI] [PMC free article] [PubMed] [Google Scholar]
- McKiernan BJ, Marcario JK, Karrer JH, Cheney PD (2000): Correlations between corticomotoneuronal (CM) cell postspike effects and cell‐target muscle covariation. J Neurophysiol 83:99–115. [DOI] [PubMed] [Google Scholar]
- Meier JD, Aflalo TN, Kastner S, Graziano MS (2008): Complex organization of human primary motor cortex: A high‐resolution fMRI study. J Neurophysiol 100:1800–1812. [DOI] [PMC free article] [PubMed] [Google Scholar]
- Meister IG, Foltys H, Gallea C, Hallett M (2010): How the brain handles temporally uncoupled bimanual movements. Cereb Cortex 20:2996–3004. [DOI] [PMC free article] [PubMed] [Google Scholar]
- Minshew NJ, Sung K, Jones BL, Furman JM (2004): Underdevelopment of the postural control system in autism. Neurology 63:2056–2061. [DOI] [PubMed] [Google Scholar]
- Mostofsky SH, Goldberg MC, Landa RJ, Denckla MB (2000): Evidence for a deficit in procedural learning in children and adolescents with autism: Implications for cerebellar contribution. J Int Neuropsychol Soc 6:752–759. [DOI] [PubMed] [Google Scholar]
- Mostofsky SH, Dubey P, Jerath VK, Jansiewicz EM, Goldberg MC, Denckla MB (2006): Developmental dyspraxia is not limited to imitation in children with autism spectrum disorders. J Int Neuropsychol Soc 12:314–326. [DOI] [PubMed] [Google Scholar]
- Mostofsky SH, Burgess MP, Gidley Larson JC (2007): Increased motor cortex white matter volume predicts motor impairment in autism. Brain 130 (Part 8):2117–2122. [DOI] [PubMed] [Google Scholar]
- Mostofsky SH, Powell SK, Simmonds DJ, Goldberg MC, Caffo B, Pekar JJ (2009): Decreased connectivity and cerebellar activity in autism during motor task performance. Brain 132 (Part 9):2413–2425. [DOI] [PMC free article] [PubMed] [Google Scholar]
- Mottron L (2004): Matching strategies in cognitive research with individuals with high‐functioning autism: Current practices, instrument biases, and recommendations. J Autism Dev Disord 34:19–27. [DOI] [PubMed] [Google Scholar]
- Muller RA, Cauich C, Rubio MA, Mizuno A, Courchesne E (2004): Abnormal activity patterns in premotor cortex during sequence learning in autistic patients. Biol Psychiatry 56:323–332. [DOI] [PubMed] [Google Scholar]
- Nelson SM, Cohen AL, Power JD, Wig GS, Miezin FM, Wheeler ME, Velanova K, Donaldson DI, Phillips JS, Schlaggar BL, Petersen SE (2010): A parcellation scheme for human left lateral parietal cortex. Neuron 67:156–170. [DOI] [PMC free article] [PubMed] [Google Scholar]
- Newton JM, Dong Y, Hidler J, Plummer‐D'Amato P, Marehbian J, Albistegui‐Dubois RM, Woods RP, Dobkin BH (2008): Reliable assessment of lower limb motor representations with fMRI: Use of a novel MR compatible device for real‐time monitoring of ankle, knee and hip torques. Neuroimage 43:136–146. [DOI] [PMC free article] [PubMed] [Google Scholar]
- Noterdaeme M, Mildenberger K, Minow F, Amorosa H (2002): Evaluation of neuromotor deficits in children with autism and children with a specific speech and language disorder. Eur Child Adolesc Psychiatry 11:219–225. [DOI] [PubMed] [Google Scholar]
- Oberman LM, Hubbard EM, McCleery JP, Altschuler EL, Ramachandran VS, Pineda JA (2005): EEG evidence for mirror neuron dysfunction in autism spectrum disorders. Brain Res Cogn Brain Res 24:190–198. [DOI] [PubMed] [Google Scholar]
- Oishi K, Faria A, Jiang H, Li X, Akhter K, Zhang J, Hsu JT, Miller MI, van Zijl PC, Albert M, Lyketsos CG, Woods R, Toga AW, Pike GB, Rosa‐Neto P, Evans A, Mazziotta J, Mori S (2009): Atlas‐based whole brain white matter analysis using large deformation diffeomorphic metric mapping: Application to normal elderly and Alzheimer's disease participants. Neuroimage 46:486–499. [DOI] [PMC free article] [PubMed] [Google Scholar]
- Oldfield RC (1971): The assessment and analysis of handedness: The Edinburgh inventory. Neuropsychologia 9:97–113. [DOI] [PubMed] [Google Scholar]
- Penfield W, Boldrey E (1937): Somatic motor and sensory representation in the cerebral cortex of man as studied by electrical stimulation. Brain 60:389–443. [Google Scholar]
- Penfield W, Rasmussen TB (1950): The Cerebral Cortex of Man: A Clinical Study of Localization of Function. New York: Macmillan. [Google Scholar]
- Plow EB, Arora P, Pline MA, Binenstock MT, Carey JR (2010): Within‐limb somatotopy in primary motor cortex—Revealed using fMRI. Cortex 46:310–321. [DOI] [PubMed] [Google Scholar]
- Rasmussen TB (1977): Wilder Penfield: His legacy to neurology. Surgical treatment of epilepsy. Can Med Assoc J 116:1369–1370. [PMC free article] [PubMed] [Google Scholar]
- Rathelot JA, Strick PL (2009): Subdivisions of primary motor cortex based on cortico‐motoneuronal cells. Proc Natl Acad Sci USA 106:918–923. [DOI] [PMC free article] [PubMed] [Google Scholar]
- Rinehart NJ, Bradshaw JL, Brereton AV, Tonge BJ (2001): Movement preparation in high‐functioning autism and Asperger disorder: A serial choice reaction time task involving motor reprogramming. J Autism Dev Disord 31:79–88. [DOI] [PubMed] [Google Scholar]
- Rogers SJ, Bennetto L, McEvoy R, Pennington BF (1996): Imitation and pantomime in high‐functioning adolescents with autism spectrum disorders. Child Dev 67:2060–2073. [PubMed] [Google Scholar]
- Schmahmann JD, Pandya DN (2007): The complex history of the fronto‐occipital fasciculus. J Hist Neurosci 16:362–377. [DOI] [PubMed] [Google Scholar]
- Schroeder CE, Lakatos P (2009): The gamma oscillation: Master or slave? Brain Topogr 22:24–26. [DOI] [PMC free article] [PubMed] [Google Scholar]
- Strick PL, Preston JB (1982): Two representations of the hand in area 4 of a primate. I. motor output organization. J Neurophysiol 48:139–149. [DOI] [PubMed] [Google Scholar]
- Sutera S, Pandey J, Esser EL, Rosenthal MA, Wilson LB, Barton M, Green J, Hodgson S, Robins DL, Dumont‐Mathieu T, Fein D (2007): Predictors of optimal outcome in toddlers diagnosed with autism spectrum disorders. J Autism Dev Disord 37:98–107. [DOI] [PubMed] [Google Scholar]
- Teitelbaum P, Teitelbaum O, Nye J, Fryman J, Maurer RG (1998): Movement analysis in infancy may be useful for early diagnosis of autism. Proc Natl Acad Sci USA 95:13982–13987. [DOI] [PMC free article] [PubMed] [Google Scholar]
- Teitelbaum O, Benton T, Shah PK, Prince A, Kelly JL, Teitelbaum P (2004): Eshkol‐Wachman movement notation in diagnosis: The early detection of Asperger's syndrome. Proc Natl Acad Sci USA 101:11909–11914. [DOI] [PMC free article] [PubMed] [Google Scholar]
- Ullman MT (2004): Contributions of memory circuits to language: The declarative/procedural model. Cognition 92:231–270. [DOI] [PubMed] [Google Scholar]
- van den Heuvel MP, Hulshoff Pol HE (2010): Specific somatotopic organization of functional connections of the primary motor network during resting state. Hum Brain Mapp 31:631–644. [DOI] [PMC free article] [PubMed] [Google Scholar]
- van den Heuvel M, Mandl R, Hulshoff Pol H (2008): Normalized cut group clustering of resting‐state FMRI data. PLoS One 3:e2001. [DOI] [PMC free article] [PubMed] [Google Scholar]
- Wahl M, Lauterbach‐Soon B, Hattingen E, Jung P, Singer O, Volz S, Klein JC, Steinmetz H, Ziemann U (2007): Human motor corpus callosum: Topography, somatotopy, and link between microstructure and function. J Neurosci 27:12132–12138. [DOI] [PMC free article] [PubMed] [Google Scholar]
- Wechsler D (2003): Wechsler Intelligence Scale for Children, 4th ed San Antonio, TX: The Psychological Corporation. [Google Scholar]
- Welner Z, Reich W, Herjanic B, Jung KG, Amado H (1987): Reliability, validity, and parent‐child agreement studies of the diagnostic interview for children and adolescents (DICA). J Am Acad Child Adolesc Psychiatry 26:649–653. [DOI] [PubMed] [Google Scholar]
- Williams JH, Whiten A, Suddendorf T, Perrett DI (2001): Imitation, mirror neurons and autism. Neurosci Biobehav Rev 25:287–295. [DOI] [PubMed] [Google Scholar]
- Yousry TA, Schmid UD, Alkadhi H, Schmidt D, Peraud A, Buettner A, Winkler P (1997): Localization of the motor hand area to a knob on the precentral gyrus. A new landmark. Brain 120 (Part 1):141–157. [DOI] [PubMed] [Google Scholar]
- Zelnik‐Manor L, Perona P (2004): Self‐tuning spectral clustering In: Saul L, Weiss Y, Bottou L, editors. Advances in Neural Information Processing Systems, 17th ed Cambridge, MA: MIT Press; pp1601–1608. [Google Scholar]
- Zwaigenbaum L, Bryson S, Lord C, Rogers S, Carter A, Carver L, Chawarska K, Constantino J, Dawson G, Dobkins K, Fein D, Iverson J, Klin A, Landa R, Messinger D, Ozonoff S, Sigman M, Stone W, Tager‐Flusberg H, Yirmiya N (2009): Clinical assessment and management of toddlers with suspected autism spectrum disorder: Insights from studies of high‐risk infants. Pediatrics 123:1383–1391. [DOI] [PMC free article] [PubMed] [Google Scholar]
Associated Data
This section collects any data citations, data availability statements, or supplementary materials included in this article.
Supplementary Materials
Figure S1. Selection of the optimal number of M1 clusters, k, using a shifted and scaled version of Pearson's correlation coefficient to measure functional connectivity map similarity prior to clustering. (A) For each value of k, the spatial agreement of clustering solutions generated from test‐retest resting state scans collected from 20 neurotypical adults was assessed using Dice's coefficient (dashed black line). A jack knife procedure was used to estimate the variance (solid black line). (B) 3D Illustration of clustering results using the optimal number of clusters (k = 5) for both imaging sessions. A comparison of Figure S1 with Figure 2 demonstrates that similar organization is estimated within M1 regardless of the similarity measure used.
Figure S2. Patterns of functional organization within M1 when searching for different numbers of partitions. Functional organization within M1 is illustrated for (A) test and (B) retest functional connectivity data collected from adults when different numbers of clusters are specified (each row). M1 organization in adults does not change drastically whether we look for three, four, five or six parcels, suggesting that the general organization of M1 is not driven by our choice of k.
Video 1. Animation showing a 360° rotation of the test‐retest similarity of the functional segregation of the primary motor cortex in adults using the estimated k. Session 1 is on the left and session 2 is on the right.
Video 2. Animation showing a 360° rotation of the functional segregation of the primary motor cortex using k=5 for typically developing (TD) children (on the left) and children with autism (ASD, on the right).