

Significance
This paper presents a high-resolution map of nucleosome positions of Schizosaccharomyces pombe. Comparison with the high-resolution map of Saccharomyces cerevisiae has provided important insights into nucleosome–DNA interaction and mechanistic variation in nucleosome positioning. The map shows a preponderance of linker lengths centered on 4/5 bp, placing adjacent nucleosomes on opposite faces of the DNA. The dinucleotide signature for nucleosome positioning is equally strong in exons as in introns. Unexpectedly, S. pombe nucleosomes have a preference for A/T residues surrounding the nucleosome dyad, and nucleosome occupancy is very mildly affected by poly (dA-dT) tracts. The preference for A/T residues around the dyad and its role in nucleosome phasing suggest a coevolution of genomes with the DNA binding preferences of nucleosomes across species.
Keywords: chromatin structure, heterochromatin, gene regulation
Abstract
Using a recently developed chemical approach, we have generated a genome-wide map of nucleosomes in vivo in Schizosaccharomyces pombe (S. pombe) at base pair resolution. The shorter linker length previously identified in S. pombe is due to a preponderance of nucleosomes separated by ∼4/5 bp, placing nucleosomes on opposite faces of the DNA. The periodic dinucleotide feature thought to position nucleosomes is equally strong in exons as in introns, demonstrating that nucleosome positioning information can be superimposed on coding information. Unlike the case in Saccharomyces cerevisiae, A/T-rich sequences are enriched in S. pombe nucleosomes, particularly at ±20 bp around the dyad. This difference in nucleosome binding preference gives rise to a major distinction downstream of the transcription start site, where nucleosome phasing is highly predictable by A/T frequency in S. pombe but not in S. cerevisiae, suggesting that the genomes and DNA binding preferences of nucleosomes have coevolved in different species. The poly (dA-dT) tracts affect but do not deplete nucleosomes in S. pombe, and they prefer special rotational positions within the nucleosome, with longer tracts enriched in the 10- to 30-bp region from the dyad. S. pombe does not have a well-defined nucleosome-depleted region immediately upstream of most transcription start sites; instead, the −1 nucleosome is positioned with the expected spacing relative to the +1 nucleosome, and its occupancy is negatively correlated with gene expression. Although there is generally very good agreement between nucleosome maps generated by chemical cleavage and micrococcal nuclease digestion, the chemical map shows consistently higher nucleosome occupancy on DNA with high A/T content.
Eukaryotic DNA is organized into nucleosome arrays that facilitate proper genome compaction and regulation of the genetic information. Genome-wide nucleosome maps from different organisms have provided important insights into how nucleosome positioning regulates chromosome functions (1–6). It is commonly accepted that the DNA sequence itself plays a major role in the exact positions where histone octamers bind DNA to form nucleosomes (7–9). Most remarkably, nucleosomes prefer special dinucleotide motifs at specific rotational angles within the nucleosome core (10, 11) and disfavor poly (dA-dT) tracts (12–15). Although the ability of DNA to interact with the histone core is important, nucleosome occupancy is influenced by additional extrinsic factors, including species-specific DNA binding proteins (16), ATP-dependent remodeling complexes (17, 18), and the transcription machinery (19–22).
The underlying mechanisms for the species- or cell type-specific nucleosome positioning features have not been well understood. The fission yeast Schizosaccharomyces pombe and the budding yeast Saccharomyces cerevisiae are two highly diverged model organisms widely used to study basic biological processes in eukaryotes (23). Although similar in size, S. pombe is distinguished from S. cerevisiae by sharing important characteristics of chromosome structure with metazoans, including relatively large chromosomes, numerous introns, large repetitive centromeres, low-complexity replication origins, the composition of chromatin remodeling complexes, and siRNA-regulated heterochromatin (24–27). Recent micrococcal nuclease (MNase) mapping studies (16, 28, 29) revealed substantial differences between the two species in nucleosomal DNA sequence features and chromatin organization, including how histone–DNA sequence preferences affect nucleosome positioning and nucleosome occupancy patterns around transcription start sites (TSSs) and DNA replication origins. To address these questions at higher resolution and to control for potential sequence-specificity bias due to different MNase digestion extent (30–32), the in vivo chemical mapping approach of Brogaard et al. (33) was used to map nucleosome centers directly in S. pombe in this study. This map achieved unprecedented accuracy, leading to a number of discoveries regarding nucleosome positioning and chromatin structure, which provide additional insights from an evolutionary perspective into our understanding of the intrinsic and extrinsic mechanisms in nucleosome positioning.
Results
Overview of the Map.
We engineered the H4S48C S. pombe strain by mutating the serine at position 48 to cysteine in two of three copies of histone H4 genes. Normal growth of the H4S48C S. pombe strain was observed at 30 °C on rich medium. The chemical approach utilized by Brogaard et al. (33, 34) was then used to map nucleosome center positions for S. pombe in two independent experiments. Briefly, cells were lysed and a copper chelator was covalently attached to C48 of the modified H4, followed by the addition of copper and H2O2 to induce symmetrical DNA cleavage events closely flanking the nucleosome center. The DNA band of the lowest molecular weight corresponding to cleavages in adjacent nucleosomes (Fig. 1A) was sequenced with Applied Biosystems Sequencing by Oligonucleotide Ligation and Detection (SOLiD) platform, producing a map of 95 million cleavages on each strand genome-wide (Fig. S1A). Two independent experiments yielded highly consistent nucleosome maps (Fig. S1B); therefore, we combined the two datasets and created a unique map consisting of 73,945 nucleosomes (Dataset S1) and a redundant map of 411,590 nucleosome centers (Dataset S2). The general consistency between the chemical map and published MNase map (16) confirms that the chemical experiments are mapping the in vivo nucleosome center positions (Fig. S1 A and C). The redundant map of S. pombe reveals that overlapping nucleosomes are predominantly spaced by multiples of helical repeat length, similar to that observed in S. cerevisiae (33) (Fig. 1B).
Fig. 1.

Overview of the chemical map for S. pombe. (A) Ethidium bromide-stained agarose gel of chemical cleavage products shows that a band pattern only forms with the presence of the H4S48C mutation and the N-(1,10-phenanthroline-5-yl)iodoacetamide label. (B) Plot of the distance between centers of redundant nucleosomes. (C) Linker length distribution of S. pombe (blue) shows a periodic pattern similar to S. cerevisiae (red). (D) S. pombe shows an enriched shorter linker length in the gene body regions (black) relative to the intergenic regions (red).
S. pombe Has a Linker Length Distribution of 10n + 4/5 bp.
The S. pombe genome is known to have a shorter nucleosome repeat length than S. cerevisiae (28, 29, 35). The chemical map displays additional fine details. S. pombe shares a similar periodic linker length pattern with S. cerevisiae (Fig. 1C) but with significant enrichment at short linker lengths, particularly at a nominal value equal to 3 bp. This enrichment is even more pronounced in the gene body regions than in the intergenic regions (Fig. 1D). Considering a 1- to 2-bp overstretching effect of nucleosome DNA (33, 36), the S. pombe genome displays a preferential linker length form of ∼10n + 4/5 bp. Because linker length is closely related to the high-order chromatin structure (37, 38), this implies that these two genomes may share some similar aspects in high-order chromatin structure, regardless of the evolutionary divergence and distinctions in nucleosome formation between the species.
Rotational Preference of Mono/Dinucleotides in S. pombe.
Our chemically derived nucleosome map uncovers distinct fine-scale DNA sequence features of S. pombe that were previously unappreciated. The S. pombe map shows a stunning 10-bp periodicity of the AA/TT/AT/TA dinucleotide signal in both unique and redundant nucleosomes (Fig. S2 A and B). Interestingly the nucleosomes in exons, which are subject to coding constraints, show a slightly stronger periodicity than those in introns (Fig. 2A), demonstrating a multiplexing of genetic code and nucleosome positioning code. The nucleosomes in both S. pombe and S. cerevisiae share a similar base composition pattern (smoothed by a ±10-bp window), including enriched A/T in the central ±10 bp of the dyad compared with the genome average, local A/T peaks positioned around the nucleosome edges, and an A/T-disfavored region about 40 bp from the dyad (Fig. 2B). However, relative to S. cerevisiae, the enrichment of A/T around the dyad in S. pombe is far more pronounced and the A/T fraction at the nucleosome edges and linker regions of S. pombe is lower than the genome average. Intriguingly, the nucleosome positioning strength, measured by the nucleosome center positioning (NCP) score-to-noise ratio, is positively correlated with both A/T and AA/TT/AT/TA frequency at rotational positions, where the DNA backbone faces inward toward the histone core in both species (Fig. S2 C–F). Nevertheless, S. pombe shows a distinction in the central ±20-bp region, where both the A/T and AA/TT/AT/TA baseline levels are also positively correlated with the strength of the positioning signal.
Fig. 2.
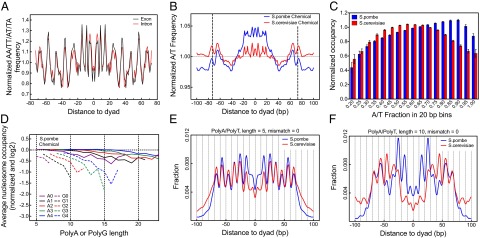
Distinct sequence features of S. pombe nucleosomes. (A) AA/TT/AT/TA frequency in nucleosomes of coding regions vs. intronic regions in S. pombe after normalization by respective average frequency. (B) A/T base composition in the nucleosome and its flanking regions normalized by the genome average (smoothed by ±10-bp moving average). (C) Average nucleosome occupancy measured in 20-bp bins genome-wide as a function of A/T fraction within each bin. (D) Normalized nucleosome occupancy over poly (dA-dT) and poly (dG-dC) tracts in a log2 scale as a function of polymer length from a chemical map of S. pombe. The zero line is the genome average occupancy. The A0/G0 curve stands for poly (dA-dT)/poly (dG-dC) with no mismatch, the A1/G1 curve stands for one internal mismatch, etc. (E and F) Distance between the nucleosome dyad and centers of poly (dA-dT) with lengths of 5 and 10 nt, respectively.
A/T-Rich Sequences Associated with High Occupancy in S. pombe.
Numerous studies have suggested that G/C-rich sequences have a higher propensity of nucleosome forming than A/T-rich sequences in S. cerevisiae and other eukaryotes (39–41). The observed pattern in Fig. 2B suggests the opposite in S. pombe. To test this finding further, we divided the entire genome into 20-bp bins and calculated the average occupancy level in each bin as a function of A/T fraction. For S. cerevisiae, the average occupancy is maximized over bins with an A/T fraction of ∼0.55, which is lower than the genome average base composition (0.62), whereas the S. pombe curve reaches the maximum at an A/T fraction of ∼0.9, which is far beyond the genome average (0.64) (Fig. 2C). More importantly, as the A/T fraction increases, these bins tend to be positioned closer to the nucleosome dyad (Fig. S2G), suggesting the dyad region is more accommodating in harboring A/T-rich sequences.
Poly (dA-dT) Affects but Does Not Deplete Nucleosomes in S. pombe.
Published MNase maps have suggested that nucleosomes are depleted by poly (dA-dT) tracts in S. cerevisiae and some other eukaryotes (1, 6, 7, 10, 20, 39, 42). For S. pombe, a recent tiled microarray study (28) suggested that poly (dA-dT) tracts are not enriched in nucleosome-depleted regions (NDRs), whereas another MNase-sequencing study (16) showed that nucleosomes are significantly depleted by poly (dA-dT) tracts. In S. pombe, the chemical map suggests that poly (dA-dT) tracts do reduce nucleosome occupancy but only mildly, with a slow increasing rate as a function of the tract length. For example, a 10-bp poly (dA-dT) tract only reduces the occupancy by 12% compared with the genome average in S. pombe in contrast to 51% depletion in S. cerevisiae by the chemical map (33) (A0 curve in Fig. 2D and Fig. S2H). For poly (dG-dC) tracts, which are rare in both genomes, the chemical map suggests a fast occupancy decay rate (Dataset S3). In contrast, the MNase maps from published studies (16, 43) do not show a pronounced between-species difference in the occupancy pattern over these polymers (Fig. S2 I and J). Both suggested fast depletion of nucleosome over poly (dA-dT) tracts but no significant depletion over poly (dG-dC) tracts. Because MNase preferentially degrades A/T-rich nucleosomes (32), which are more common in S. pombe than in S. cerevisiae (Fig. 2 B and C), we speculate that the observed high depletion rate over poly (dA-dT) tracts from the S. pombe MNase maps may be inflated.
Longer Poly (dA-dT) Tracts Enriched Around the Dyad in S. pombe.
The chemical maps reveal distinctive features regarding the exact preferential positioning of polymer tracks within nucleosomes between S. cerevisiae and S. pombe. The poly (dA-dT) tracts in both species are preferentially centered at rotational positions, where DNA backbone (minor groove) faces inward toward the histone core (Fig. 2 E and F), that is, where AA/TT/TA/AT dinucleotide motifs are preferred. S. pombe shows a strong preference of poly (dA-dT) tracts in the ±30-bp of the dyad, and this preference, particularly in the region of 10–30 bp from the dyad, is even stronger as the tract length increases. In contrast, in S. cerevisiae, short poly (dA-dT) tracts (e.g., 5-mer) are less favored in the center ±30-bp region and long tracts are further depleted in the ±20-bp region (Fig. 2F). Poly (dG-dC) tracts prefer antiphase positions relative to poly (dA-dT) tracts for both species, and the difference between the two species is less pronounced (Fig. S2K).
Special Features of Nucleosome Positioning at TSS in S. pombe.
The high-resolution chemical map allows more accurate analysis of nucleosome occupancy at genetic landmarks. We defined the nucleosome occupancy as the total NCP score in the ±60 bp of every genomic location based on the redundant map (SI Materials and Methods). The chemical map reveals a strong ordering of nucleosome array downstream of 4,013 TSSs (28) and a weak ordering upstream of TSSs (Fig. 3A). Compared with S. cerevisiae, the NDR immediately upstream of the TSS in S. pombe is less “depleted” or not obvious. The NCP score plot (equivalent to dyad occupancy) suggests that −1 and +1 nucleosomes have a regular distance in S. pombe, whereas in S. cerevisiae, a much wider NDR is clearly observed (Fig. 3B). The chemical map suggests a very mild decay of nucleosome occupancy in the gene body region as gene expression increases (gene expression data are taken from ref. 44) (Fig. S3A and Dataset S4). Different from a published MNase study (28), however, we found the least active genes tend to have higher nucleosome occupancy in both the gene body and NDR relative to the most active genes, and both groups show nucleosome phasing downstream of the TSS (Fig. 3C). We postulate that the observed higher occupancy in the most active genes from the MNase map could be an artificial fact due to MNase bias because of the relatively lower A/T content compared with the least active genes (0.60 vs. 0.63).
Fig. 3.
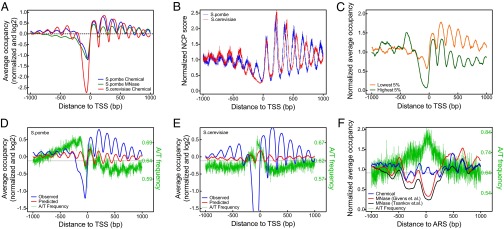
Nucleosome occupancy at genetic landmarks. (A) Nucleosome occupancy pattern around the TSS of S. pombe. (B) NCP score occupancy (or dyad occupancy) around the TSS of S. pombe and S. cerevisiae. (C) Nucleosome occupancy downstream of the TSS for the most and least active genes. (D) Nucleosome phasing downstream of the TSS coincides with the A/T base composition in S. pombe and can be roughly predicted using an intrinsic DNA model (45). The horizontal line is the genome average A/T composition. (E) Same as in D but for S. cerevisiae. (F) Chemical map suggests that DNA replication origins are not as nucleosome-depleted as suggested by previous MNase maps (16, 29). The low reads occupancy from MNase maps is highly correlated with high A/T composition.
Published studies have concluded that the DNA sequence is not the main determinant of nucleosome positioning downstream of the TSS; thus, its phasing pattern cannot be predicted well by a DNA model (22). Surprisingly, the S. pombe genome has a strong base-composition phasing pattern around the TSS, particularly downstream (Fig. 3D), and the A/T fraction peaks are in phase with the nucleosome occupancy peaks. In addition, the NDR has relatively lower A/T composition compared with neighboring regions (Fig. 3D). Therefore, the phasing pattern of nucleosome occupancy can be roughly predicted using a nucleosome-linker DNA model based on a duration hidden Markov model (dHMM) (45) (Fig. 3D). In contrast, S. cerevisiae has a relatively higher A/T composition in the NDR (which is more favored by linker DNAs; Fig. 3E), but lacks a phasing pattern of A/T around the TSS. The nucleosome phasing is less well predicted by the dHMM model. These results suggest that the genomic sequences likely play a more influential role in nucleosome positioning in S. pombe than in S. cerevisiae.
Nucleosome Positioning at Other Genomic Landmarks.
The nucleosome occupancy at the ORF end or transcription termination sites of S. pombe shows weak ordering of nucleosomes with no depletion (Fig. S3 B and C), whereas S. cerevisiae does not show ordering and has substantial depletion instead (33). The tRNA genes, which are highly transcribed by RNA polymerase III and have promoters inside the gene body, are nucleosome-depleted in the gene body and the immediate upstream ∼70-bp regions (Fig. S3D). For DNA replication origins, which were suggested to be nucleosome-depleted by MNase maps (16, 29), the occupancy from the chemical map only shows a slight reduction compared with the genome average (Fig. 3F). Because the replication origins are A/T-rich, the MNase occupancy could be substantially biased downward due to MNase’s sequence specificity, as demonstrated by the strong reverse correlation of occupancy value and A/T fraction (Fig. 3F).
Nucleosome in Heterochromatin Regions.
The S. pombe genome distinguishes itself from S. cerevisiae in forming extensive stretches of heterochromatin in the centromere, telomere, and mating type regions. Heterochromatin is richer in A/T and is tightly packed inside the nucleus, and it has important functions ranging from gene regulation to maintaining the integrity of chromosomes (46). Most of the sequencing tags from the centromere and telomere regions are not uniquely mappable because of the presence of repetitive elements and other highly conserved sequences. We defined the mappability weight of each sequencing tag as the reciprocal of the number of mapped distinct genomic locations. Nucleosomes are called based on a mappability-weighted cleavage frequency genome-wide. The AA/TT/AT/TA dinucleotide signature from nucleosomes defined in heterochromatic regions has a higher frequency than the genome average due to richer A/T content, whereas the periodicity is comparably strong (Fig. S4A). This suggests that the accuracy of the defined nucleosome map using the weighted cleavages is not notably affected by possible misalignment due to the mappability issue.
For centromeric regions, about 16% of the tags were uniquely mappable and 90% of the nonunique tags were mapped to multiple locations within centromeric regions (Dataset S5). Therefore, the weighted cleavage frequency defined for the centromere region should roughly reflect the actual level of nucleosome occupancy. We found that the centromere regions are overall nucleosome-sparse, and different functional domains display distinct nucleosome occupancy patterns (Fig. 4A). The central domain is composed of the nonrepetitive central core (cnt) and surrounding inner repeats, which require the centromere-specific H3 histone variant, namely, CenH3, to form nucleosomes. Interestingly the chemical map reveals fuzzy positioning of nucleosomes in the cnt with low occupancy (Fig. 4 and Fig. S4 B and C; average fuzziness score of 3.38 compared with the genome average score of 2.98; SI Materials and Methods). This is in contrast to two strong nucleosome positions in the cnt region observed in S. cerevisiae (33). The fuzziness is also reflected in the noisiness and breadth of the occupancy peaks from the published MNase maps (16, 29) (Fig. 4B). Several earlier studies have suggested that the cnt region may be mostly devoid of positioned nucleosomes (47, 48). The fuzziness is potentially due to the high A/T content (0.714) in the entire cnt region, which may result in less discrimination between many local positions with similar abundance. Alternatively, the low observed occupancy could be due to the decreased mapping efficiency of CenH3-containing centromeric nucleosomes, which may wrap DNA in a fundamentally different manner (49). Future studies are needed to resolve this discrepancy.
Fig. 4.
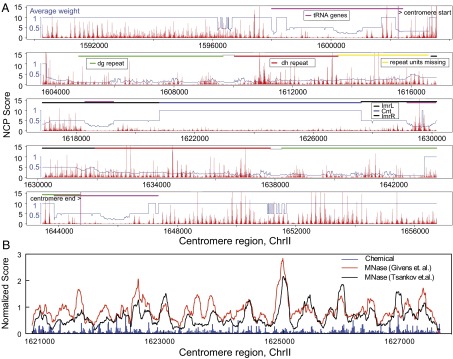
Nucleosome positioning in heterochromatic regions. NCP score plot in the centromere region of chromosome II (A) and a close-up plot of the normalized NCP score in the cnt of centromere 2 superimposed with the reads occupancy score from the published MNase maps (16, 29) (B). Value 1 in the y axis indicates the genome average occupancy for MNase maps and the average NCP score in the redundant nucleosomes for the chemical map. The average weight is the smoothed mappability score, and its reciprocal measures the average number of locations to which each read was mapped in the genome. Chr, chromosome; dg and dh, two outer repeat elements; imrL/R, inner repeat left/right.
Unlike euchromatic regions, where nucleosomes tend to display continuous arrays with comparable occupancy, nucleosomes in centromere regions vary drastically in occupancy. Well-positioned nucleosomes often exist in clusters, frequently separated by big gaps or nucleosome-free regions (Fig. 4A). For the mating type regions, we observe well-positioned nucleosomes throughout the entire ∼8,000-bp region, whereas the beginning and ending ∼300-bp regions are nucleosome-depleted (Fig. S4D). For telomere regions, about 24% of tags were uniquely mappable (Dataset S5) and 71% of nonunique tags were mapped to multiple locations in the telomere regions. Both left and right telomeres show a mixture of well-positioned and fuzzily positioned nucleosomes, also suggesting a relatively sparser nucleosome organization (Fig. S4 E–I).
Discussion
The high-resolution S. pombe map confirms several aspects of nucleosome positioning observed in S. cerevisiae. The S. pombe map demonstrates that the strong periodic dinucleotide motifs are the universal intrinsic factor for the fine positions of nucleosomes in different organisms. This signature is comparably strong in exons and introns, demonstrating that nucleosome positioning information can be seamlessly integrated with coding information. The shorter linker length in S. pombe is a consequence of a preponderance of nucleosomes with a linker length of 4 or 5 bp. This is in keeping with the preferred orientation of adjacent nucleosomes observed in S. cerevisiae and implies the existence of some common higher order structural aspects in chromatin fibers.
The chemical mapping of nucleosomes was performed with two of the three H4 genes substituted with S48C. As can be seen in Fig. S5, substitution of only one H4 gene does not generate a ladder of nucleosome repeat length fragments, but the pattern with two of the three genes substituted is equivalent to that with all three H4 genes replaced with S48C. In S. pombe, mutating of two H4 genes with the third H4 gene intact or mutating all three H4 genes did not result in a noticeable growth defect. This suggests that the chemical mapping approach will be applicable to metazoans with multiple copies of H4, where it may not be possible to remove all WT H4 completely.
The conclusions drawn in this paper for nucleosome occupancy analyses were implicitly based on the assumption that H4 mutants can be uniformly incorporated into nucleosomes genome-wide. It is possible that different genomic regions could vary in their affinity to bind H4 mutants, which consequently causes bias in the nucleosome occupancy analysis. Arguing against such a bias is the very good agreement between the MNase and chemical maps in nucleosome positions. Where differences in occupancy were observed, such as at origins of replication, poly (dA-dT) tracts, or the least (vs. most) active genes, they can be explained by the relatively high AT content of these features and the sequence preferences of MNase.
The S. pombe map presents several unique aspects regarding intrinsic and extrinsic factors that affect nucleosome positioning and chromatin structure in eukaryotes. In contrast to S. cerevisiae, there is a preference for higher A/T surrounding the nucleosome dyad in S. pombe. As a consequence, repeating oscillations in A/T frequency are in phase with positioned nucleosomes downstream of the TSS. The poly (dA-dT) tracts, which have been regarded as an important determinant of nucleosome positioning in budding yeast and worms, do not deplete nucleosomes in S. pombe to the same extent, and longer tracts are preferentially positioned near the dyad. Likewise, the A/T richer sequences are favored in the nucleosome core region in S. pombe rather than in the linker region, which is the opposite of what is observed in other organisms. These distinctions suggest that sequence preferences observed in S. cerevisiae and other eukaryotes, previously thought as universal and intrinsic, may vary substantially between organisms and be subject to evolutionary pressure.
The cause of the difference in the nucleosome positioning code, and the shorter linker length of S. pombe, remains to be determined. Among the possible explanations are subtle differences in the sequences of the histone octamer between S. pombe and S. cerevisiae, potential differences in histone modifications between these species, or lack of the linker histone H1 in S. pombe. The linker histone H1 is known to seal the nucleosome entry/exit and to be associated with linker DNA (50–53), and it prefers to bind A/T-rich DNA sequences (54, 55). The nonclassical histone H1 gene in S. cerevisiae, Hho1p, plays a similar role in chromosome compaction and chromatin structure (56, 57). Thus, intuitively, the presence of histone H1 as in S. cerevisiae may help to position A/T-rich regions in the nucleosome edges or linker regions. Additional studies have shown that the amount of linker histone H1 in vivo is positively correlated with nucleosome repeat length (58, 59). Interestingly when the genomic DNA from S. pombe was inserted into the mouse genome, nucleosomes arrays with a nucleosome repeat length similar to the WT mouse genome (60) were formed again, suggesting that extrinsic factors must play a major role in determination of linker length distribution.
Materials and Methods
The H4S48C S. pombe strain was engineered in the KGY425 (American Type Culture Collection 96155) (h- his3-D1 leu1-32 ura4-D18 ade6-M210) background. The HHF1 and HHF2 genes encoding two of the three copies of H4 were mutated from serine to cysteine at position 48 by a standard pop-in/pop-out two-step method using linear PCR-generated cassettes targeted to endogenous loci through homologous recombination and selected for a gain/loss of ura4 marker. The third copy of the H4 gene (HHF3) was not altered. The H4S48C S. pombe strain demonstrated normal growth at 30 °C on rich medium. Details about sequencing and data analysis are presented in SI Materials and Methods.
Supplementary Material
Acknowledgments
Research reported in this paper was supported by the National Institutes of Health under Awards R01GM058617 and U54CA143869. We acknowledge Northwestern University Genomics Core for Sequencing by Oligonucleotide Ligation and Detection.
Footnotes
The authors declare no conflict of interest.
This article is a PNAS Direct Submission.
Data deposition: The sequence reported in this paper has been deposited in the Gene Expression Omnibus (GEO) database, www.ncbi.nlm.nih.gov/geo (accession no. GSE46975).
This article contains supporting information online at www.pnas.org/lookup/suppl/doi:10.1073/pnas.1315809110/-/DCSupplemental.
References
- 1.Ozsolak F, Song JS, Liu XS, Fisher DE. High-throughput mapping of the chromatin structure of human promoters. Nat Biotechnol. 2007;25(2):244–248. doi: 10.1038/nbt1279. [DOI] [PubMed] [Google Scholar]
- 2.Valouev A, et al. A high-resolution, nucleosome position map of C. elegans reveals a lack of universal sequence-dictated positioning. Genome Res. 2008;18(7):1051–1063. doi: 10.1101/gr.076463.108. [DOI] [PMC free article] [PubMed] [Google Scholar]
- 3.Kaplan N, et al. The DNA-encoded nucleosome organization of a eukaryotic genome. Nature. 2009;458(7236):362–366. doi: 10.1038/nature07667. [DOI] [PMC free article] [PubMed] [Google Scholar]
- 4.Mavrich TN, et al. Nucleosome organization in the Drosophila genome. Nature. 2008;453(7193):358–362. doi: 10.1038/nature06929. [DOI] [PMC free article] [PubMed] [Google Scholar]
- 5.Schones DE, et al. Dynamic regulation of nucleosome positioning in the human genome. Cell. 2008;132(5):887–898. doi: 10.1016/j.cell.2008.02.022. [DOI] [PMC free article] [PubMed] [Google Scholar]
- 6.Yuan GC, et al. Genome-scale identification of nucleosome positions in S. cerevisiae. Science. 2005;309(5734):626–630. doi: 10.1126/science.1112178. [DOI] [PubMed] [Google Scholar]
- 7.Drew HR, Travers AA. DNA bending and its relation to nucleosome positioning. J Mol Biol. 1985;186(4):773–790. doi: 10.1016/0022-2836(85)90396-1. [DOI] [PubMed] [Google Scholar]
- 8.Anselmi C, Bocchinfuso G, De Santis P, Savino M, Scipioni A. Dual role of DNA intrinsic curvature and flexibility in determining nucleosome stability. J Mol Biol. 1999;286(5):1293–1301. doi: 10.1006/jmbi.1998.2575. [DOI] [PubMed] [Google Scholar]
- 9.Widom J. Role of DNA sequence in nucleosome stability and dynamics. Q Rev Biophys. 2001;34(3):269–324. doi: 10.1017/s0033583501003699. [DOI] [PubMed] [Google Scholar]
- 10.Satchwell SC, Drew HR, Travers AA. Sequence periodicities in chicken nucleosome core DNA. J Mol Biol. 1986;191(4):659–675. doi: 10.1016/0022-2836(86)90452-3. [DOI] [PubMed] [Google Scholar]
- 11.Segal E, et al. A genomic code for nucleosome positioning. Nature. 2006;442(7104):772–778. doi: 10.1038/nature04979. [DOI] [PMC free article] [PubMed] [Google Scholar]
- 12.Struhl K. Naturally occurring poly(dA-dT) sequences are upstream promoter elements for constitutive transcription in yeast. Proc Natl Acad Sci USA. 1985;82(24):8419–8423. doi: 10.1073/pnas.82.24.8419. [DOI] [PMC free article] [PubMed] [Google Scholar]
- 13.Nelson HC, Finch JT, Luisi BF, Klug A. The structure of an oligo(dA).oligo(dT) tract and its biological implications. Nature. 1987;330(6145):221–226. doi: 10.1038/330221a0. [DOI] [PubMed] [Google Scholar]
- 14.Iyer V, Struhl K. Poly(dA:dT), a ubiquitous promoter element that stimulates transcription via its intrinsic DNA structure. EMBO J. 1995;14(11):2570–2579. doi: 10.1002/j.1460-2075.1995.tb07255.x. [DOI] [PMC free article] [PubMed] [Google Scholar]
- 15.Segal E, Widom J. Poly(dA:dT) tracts: Major determinants of nucleosome organization. Curr Opin Struct Biol. 2009;19(1):65–71. doi: 10.1016/j.sbi.2009.01.004. [DOI] [PMC free article] [PubMed] [Google Scholar]
- 16.Tsankov A, Yanagisawa Y, Rhind N, Regev A, Rando OJ. Evolutionary divergence of intrinsic and trans-regulated nucleosome positioning sequences reveals plastic rules for chromatin organization. Genome Res. 2011;21(11):1851–1862. doi: 10.1101/gr.122267.111. [DOI] [PMC free article] [PubMed] [Google Scholar]
- 17.Rippe K, et al. DNA sequence- and conformation-directed positioning of nucleosomes by chromatin-remodeling complexes. Proc Natl Acad Sci USA. 2007;104(40):15635–15640. doi: 10.1073/pnas.0702430104. [DOI] [PMC free article] [PubMed] [Google Scholar]
- 18.Zhang Z, et al. A packing mechanism for nucleosome organization reconstituted across a eukaryotic genome. Science. 2011;332(6032):977–980. doi: 10.1126/science.1200508. [DOI] [PMC free article] [PubMed] [Google Scholar]
- 19.Längst G, Becker PB, Grummt I. TTF-I determines the chromatin architecture of the active rDNA promoter. EMBO J. 1998;17(11):3135–3145. doi: 10.1093/emboj/17.11.3135. [DOI] [PMC free article] [PubMed] [Google Scholar]
- 20.Segal E, Widom J. What controls nucleosome positions? Trends Genet. 2009;25(8):335–343. doi: 10.1016/j.tig.2009.06.002. [DOI] [PMC free article] [PubMed] [Google Scholar]
- 21.Hughes AL, Jin Y, Rando OJ, Struhl K. A functional evolutionary approach to identify determinants of nucleosome positioning:A unifying model for establishing the genome-wide pattern. Mol Cell. 2012;48(1):5–15. doi: 10.1016/j.molcel.2012.07.003. [DOI] [PMC free article] [PubMed] [Google Scholar]
- 22.Struhl K, Segal E. Determinants of nucleosome positioning. Nat Struct Mol Biol. 2013;20(3):267–273. doi: 10.1038/nsmb.2506. [DOI] [PMC free article] [PubMed] [Google Scholar]
- 23.Forsburg SL. The yeasts Saccharomyces cerevisiae and Schizosaccharomyces pombe: Models for cell biology research. Gravit Space Biol Bull. 2005;18(2):3–9. [PubMed] [Google Scholar]
- 24.Monahan BJ, et al. Fission yeast SWI/SNF and RSC complexes show compositional and functional differences from budding yeast. Nat Struct Mol Biol. 2008;15(8):873–880. doi: 10.1038/nsmb.1452. [DOI] [PMC free article] [PubMed] [Google Scholar]
- 25.Reyes-Turcu FE, Grewal SI. Different means, same end-heterochromatin formation by RNAi and RNAi-independent RNA processing factors in fission yeast. Curr Opin Genet Dev. 2012;22(2):156–163. doi: 10.1016/j.gde.2011.12.004. [DOI] [PMC free article] [PubMed] [Google Scholar]
- 26.Clarke L. Centromeres of budding and fission yeasts. Trends Genet. 1990;6(5):150–154. doi: 10.1016/0168-9525(90)90149-z. [DOI] [PubMed] [Google Scholar]
- 27.Xu J, et al. Genome-wide identification and characterization of replication origins by deep sequencing. Genome Biol. 2012;13(4):R27. doi: 10.1186/gb-2012-13-4-r27. [DOI] [PMC free article] [PubMed] [Google Scholar]
- 28.Lantermann AB, et al. Schizosaccharomyces pombe genome-wide nucleosome mapping reveals positioning mechanisms distinct from those of Saccharomyces cerevisiae. Nat Struct Mol Biol. 2010;17(2):251–257. doi: 10.1038/nsmb.1741. [DOI] [PubMed] [Google Scholar]
- 29.Givens RM, et al. Chromatin architectures at fission yeast transcriptional promoters and replication origins. Nucleic Acids Res. 2012;40(15):7176–7189. doi: 10.1093/nar/gks351. [DOI] [PMC free article] [PubMed] [Google Scholar]
- 30.Dingwall C, Lomonossoff GP, Laskey RA. High sequence specificity of micrococcal nuclease. Nucleic Acids Res. 1981;9(12):2659–2673. doi: 10.1093/nar/9.12.2659. [DOI] [PMC free article] [PubMed] [Google Scholar]
- 31.Hörz W, Altenburger W. Sequence specific cleavage of DNA by micrococcal nuclease. Nucleic Acids Res. 1981;9(12):2643–2658. doi: 10.1093/nar/9.12.2643. [DOI] [PMC free article] [PubMed] [Google Scholar]
- 32.Chung HR, et al. The effect of micrococcal nuclease digestion on nucleosome positioning data. PLoS ONE. 2010;5(12):e15754. doi: 10.1371/journal.pone.0015754. [DOI] [PMC free article] [PubMed] [Google Scholar]
- 33.Brogaard K, Xi L, Wang JP, Widom J. A map of nucleosome positions in yeast at base-pair resolution. Nature. 2012;486(7404):496–501. doi: 10.1038/nature11142. [DOI] [PMC free article] [PubMed] [Google Scholar]
- 34.Brogaard KR, Xi L, Wang JP, Widom J. A chemical approach to mapping nucleosomes at base pair resolution in yeast. Methods Enzymol. 2012;513:315–334. doi: 10.1016/B978-0-12-391938-0.00014-8. [DOI] [PMC free article] [PubMed] [Google Scholar]
- 35.Godde JS, Widom J. Chromatin structure of Schizosaccharomyces pombe. A nucleosome repeat length that is shorter than the chromatosomal DNA length. J Mol Biol. 1992;226(4):1009–1025. doi: 10.1016/0022-2836(92)91049-u. [DOI] [PubMed] [Google Scholar]
- 36.Richmond TJ, Davey CA. The structure of DNA in the nucleosome core. Nature. 2003;423(6936):145–150. doi: 10.1038/nature01595. [DOI] [PubMed] [Google Scholar]
- 37.Koslover EF, Fuller CJ, Straight AF, Spakowitz AJ. Local geometry and elasticity in compact chromatin structure. Biophys J. 2010;99(12):3941–3950. doi: 10.1016/j.bpj.2010.10.024. [DOI] [PMC free article] [PubMed] [Google Scholar]
- 38.Lohr D, Van Holde KE. Organization of spacer DNA in chromatin. Proc Natl Acad Sci USA. 1979;76(12):6326–6330. doi: 10.1073/pnas.76.12.6326. [DOI] [PMC free article] [PubMed] [Google Scholar]
- 39.Lee W, et al. A high-resolution atlas of nucleosome occupancy in yeast. Nat Genet. 2007;39(10):1235–1244. doi: 10.1038/ng2117. [DOI] [PubMed] [Google Scholar]
- 40.Peckham HE, et al. Nucleosome positioning signals in genomic DNA. Genome Res. 2007;17(8):1170–1177. doi: 10.1101/gr.6101007. [DOI] [PMC free article] [PubMed] [Google Scholar]
- 41.Tillo D, Hughes TR. G+C content dominates intrinsic nucleosome occupancy. BMC Bioinformatics. 2009;10:442. doi: 10.1186/1471-2105-10-442. [DOI] [PMC free article] [PubMed] [Google Scholar]
- 42.Field Y, et al. Distinct modes of regulation by chromatin encoded through nucleosome positioning signals. PLoS Comput Biol. 2008;4(11):e1000216. doi: 10.1371/journal.pcbi.1000216. [DOI] [PMC free article] [PubMed] [Google Scholar]
- 43.Floer M, et al. A RSC/nucleosome complex determines chromatin architecture and facilitates activator binding. Cell. 2010;141(3):407–418. doi: 10.1016/j.cell.2010.03.048. [DOI] [PMC free article] [PubMed] [Google Scholar]
- 44.Wilhelm BT, et al. Dynamic repertoire of a eukaryotic transcriptome surveyed at single-nucleotide resolution. Nature. 2008;453(7199):1239–1243. doi: 10.1038/nature07002. [DOI] [PubMed] [Google Scholar]
- 45.Xi L, et al. Predicting nucleosome positioning using a duration Hidden Markov Model. BMC Bioinformatics. 2010;11:346. doi: 10.1186/1471-2105-11-346. [DOI] [PMC free article] [PubMed] [Google Scholar]
- 46.Pidoux AL, Allshire RC. Kinetochore and heterochromatin domains of the fission yeast centromere. Chromosome Res. 2004;12(6):521–534. doi: 10.1023/B:CHRO.0000036586.81775.8b. [DOI] [PubMed] [Google Scholar]
- 47.Polizzi C, Clarke L. The chromatin structure of centromeres from fission yeast: Differentiation of the central core that correlates with function. J Cell Biol. 1991;112(2):191–201. doi: 10.1083/jcb.112.2.191. [DOI] [PMC free article] [PubMed] [Google Scholar]
- 48.Takahashi K, et al. A low copy number central sequence with strict symmetry and unusual chromatin structure in fission yeast centromere. Mol Biol Cell. 1992;3(7):819–835. doi: 10.1091/mbc.3.7.819. [DOI] [PMC free article] [PubMed] [Google Scholar]
- 49.Dalal Y, Furuyama T, Vermaak D, Henikoff S. Structure, dynamics, and evolution of centromeric nucleosomes. Proc Natl Acad Sci USA. 2007;104(41):15974–15981. doi: 10.1073/pnas.0707648104. [DOI] [PMC free article] [PubMed] [Google Scholar]
- 50.Widom J. Chromatin structure: Linking structure to function with histone H1. Curr Biol. 1998;8(22):R788–R791. doi: 10.1016/s0960-9822(07)00500-3. [DOI] [PubMed] [Google Scholar]
- 51.Brown DT, Izard T, Misteli T. Mapping the interaction surface of linker histone H1(0) with the nucleosome of native chromatin in vivo. Nat Struct Mol Biol. 2006;13(3):250–255. doi: 10.1038/nsmb1050. [DOI] [PMC free article] [PubMed] [Google Scholar]
- 52.Staynov DZ, Crane-Robinson C. Footprinting of linker histones H5 and H1 on the nucleosome. EMBO J. 1988;7(12):3685–3691. doi: 10.1002/j.1460-2075.1988.tb03250.x. [DOI] [PMC free article] [PubMed] [Google Scholar]
- 53.Allan J, Hartman PG, Crane-Robinson C, Aviles FX. The structure of histone H1 and its location in chromatin. Nature. 1980;288(5792):675–679. doi: 10.1038/288675a0. [DOI] [PubMed] [Google Scholar]
- 54.Cui F, Zhurkin VB. Distinctive sequence patterns in metazoan and yeast nucleosomes: Implications for linker histone binding to AT-rich and methylated DNA. Nucleic Acids Res. 2009;37(9):2818–2829. doi: 10.1093/nar/gkp113. [DOI] [PMC free article] [PubMed] [Google Scholar]
- 55.Zlatanova J, van Holde K. The linker histones and chromatin structure: New twists. Prog Nucleic Acid Res Mol Biol. 1996;52:217–259. doi: 10.1016/s0079-6603(08)60968-x. [DOI] [PubMed] [Google Scholar]
- 56.Schäfer G, McEvoy CR, Patterton HG. The Saccharomyces cerevisiae linker histone Hho1p is essential for chromatin compaction in stationary phase and is displaced by transcription. Proc Natl Acad Sci USA. 2008;105(39):14838–14843. doi: 10.1073/pnas.0806337105. [DOI] [PMC free article] [PubMed] [Google Scholar]
- 57.Georgieva M, Roguev A, Balashev K, Zlatanova J, Miloshev G. Hho1p, the linker histone of Saccharomyces cerevisiae, is important for the proper chromatin organization in vivo. Biochim Biophys Acta. 2012;1819(5):366–374. doi: 10.1016/j.bbagrm.2011.12.003. [DOI] [PubMed] [Google Scholar]
- 58.Woodcock CL, Skoultchi AI, Fan Y. Role of linker histone in chromatin structure and function: H1 stoichiometry and nucleosome repeat length. Chromosome Res. 2006;14(1):17–25. doi: 10.1007/s10577-005-1024-3. [DOI] [PubMed] [Google Scholar]
- 59.Fan Y, et al. Histone H1 depletion in mammals alters global chromatin structure but causes specific changes in gene regulation. Cell. 2005;123(7):1199–1212. doi: 10.1016/j.cell.2005.10.028. [DOI] [PubMed] [Google Scholar]
- 60.McManus J, et al. Unusual chromosome structure of fission yeast DNA in mouse cells. J Cell Sci. 1994;107(Pt 3):469–486. doi: 10.1242/jcs.107.3.469. [DOI] [PubMed] [Google Scholar]
Associated Data
This section collects any data citations, data availability statements, or supplementary materials included in this article.