Abstract
The remediation of ammonium-containing groundwater discharged from uranium mill tailing sites is a difficult problem facing the mining industry. The Monument Valley site is a former uranium mining site in the southwest US with both ammonium and nitrate contamination of groundwater. In this study, samples collected from 14 selected wells were analyzed for major cations and anions, trace elements, and isotopic composition of ammonium and nitrate. In addition, geochemical data from the U.S. Department of Energy (DOE) database were analyzed. Results showing oxic redox conditions and correspondence of isotopic compositions of ammonium and nitrate confirmed the natural attenuation of ammonium via nitrification. Moreover, it was observed that ammonium concentration within the plume area is closely related to concentrations of uranium and a series of other trace elements including chromium, selenium, vanadium, iron, and manganese. It is hypothesized that ammonium-nitrate transformation processes influence the disposition of the trace elements through mediation of redox potential, pH, and possibly aqueous complexation and solid-phase sorption. Despite the generally relatively low concentrations of trace elements present in groundwater, their transport and fate may be influenced by remediation of ammonium or nitrate at the site.
Keywords: Nitrification, nitrate, heavy metals, natural attenuation
Introduction
A large number of uranium mines were operated from the 1940s through the 1970s in the United States (OECD/IAEA, 2011). Due to a lack of waste-management protocols, extensive contamination has resulted at these sites. As of 1999, the US Department of Energy (DOE) has completed surface remediation projects for 24 uranium mill processing sites under the Uranium Mill Tailings Remedial Action (UMTRA) program, with a total cost close to 1.5 billion dollars (Rael et al., 1999). However, the US Environmental Protection Agency (EPA) estimates that there are 4000 mines with documented uranium production, and another 15,000 locations with uranium occurrences in 14 western states (US EPA, 2012). The Navajo Nation alone has more than 500 abandoned uranium mines (US EPA, 2008).
Ammonium, nitrate, and sulfate are common groundwater contaminants observed at uranium mining sites. Ammonia is used in large quantities for the precipitation of uranium as “yellowcakes” (ammonium diuranate) during ore processing. Nitrate-containing reagents are generally used in limited quantities, yet extensive nitrate contamination in groundwater has often been observed at uranium mining sites (Landa, 2004). This nitrate appears in many cases to have formed via a microbial nitrification process in the subsurface (e.g., Ivanova et al., 2000). Conversely, denitrification has also been observed at uranium mining sites (e.g., Longmire and Thomson, 1992; Carroll et al., 2009). Sulfate typically originates from the use of sulfuric acid, and in some cases also from the oxidation of sulfide minerals associated with waste rock and mine tailings.
In addition to ammonium, nitrate, and sulfate, uranium and a host of other heavy metals and metalloids (termed trace elements henceforth) are often present at uranium mining sites. Management of groundwater contamination at such sites has focused primarily on the remediation of NH4 and/or NO3 (e.g., Johnson and Humenick, 1980; Ivanova et al., 2000). In contrast, potential geochemical interactions between different nitrogen species (ammonium and nitrate) and trace elements (including uranium) have received minimal attention. In fact, ammonium and nitrate have several important geochemical properties that may have significant implications for the transport and fate of uranium and other trace elements.
First, ammonium and nitrate are redox regulators (e.g., Christensen et al., 2001). Aerobic oxidation of ammonium consumes oxygen, and hence helps to maintain less-oxidative redox conditions (e.g., Christensen et al., 2000). Conversely, nitrate is a relatively strong oxidant in the redox ladder. Therefore, the presence of ammonium or nitrate has implications for the mobilization/immobilization of certain redox-sensitive elements such as uranium, chromium, and arsenic. For example, the results of a recent pilot-scale injection test showed that the introduction of nitrate to a reducing zone where reduced, immobilized U(IV) resided caused remobilization of the uranium (Wu et al., 2010). Furthermore, the control of ammonium and nitrate on redox conditions also has great influence on the concentration of dissolved organic carbon (DOC). DOC is an excellent ligand for certain heavy metals, and has potential significant implications for their stabilization and facilitated transport.
A second means by which ammonium can influence trace elements is through mediation of pH. Ammonium is a weak acid (NH4+ → NH3 + H+, Ka = 5.6 × 10⁻¹⁰), consequently its presence lowers the pH. In addition, the oxidation of ammonium to nitrate produces protons (NH4+ + 2O2 → NO3− + H2O + 2H+), producing additional acidity in the groundwater. The pH not only affects the speciation (e.g. pH/Eh) of metals in solution, but also affects the adsorption of many metals on solid surfaces through its impact on solid-phase surface charge.
Third, ammonium is a surface sorption competitor, and thus can compete for cation exchange sites on solid surfaces with trace metals. The following series of relative selectivity has been presented in order of decreasing affinity for cation exchange sites (e.g., Domenico & Schwartz 1998): Al3+ > Ca2+ > Mg2+ > NH4+ > K+ > H+ > Na+. Fourth, ammonia and nitrate are ligands for aqueous metal complexation.
The Monument Valley site is a former uranium mill tailing site where groundwater is contaminated by both ammonium and nitrate. The objective of this study is to use stable isotopes of ammonium and nitrate in conjunction with geochemical data to characterize the transformation of ammonium and nitrate. The role of ammonium and nitrate on the disposition of trace elements is then evaluated by assessing the relationships between their respective concentrations obtained from a survey of 14 wells distributed across the contaminant plume.
Site Background
The Monument Valley site is located within the Navajo Nation in northeastern Arizona, 24 km south of Mexican Hat, Utah. Uranium mining at the site occurred from 1943 to 1968, after which the mill closed (Dawson, 1992). During that time the site was one of the largest producers of uranium in the state of Arizona (with a production of 767,166 tons of uranium and vanadium ore). From 1964 to 1968, batch leaching and heap leaching were used to process an estimated 1.1 million tons of tailings and low-grade ore at the site (DOE, 2005). Sulfuric acid solution was used for both leaching processes. After leaching, ammonia and quicklime (calcium oxide) were used to produce a bulk precipitate of concentrated uranium and vanadium. Mill tailings were deposited in unlined tailing piles on site.
The US DOE completed surface remediation at this site in 1994 under the UMTRA program. Surface remediation involved excavation of the tailings piles, heap-leach area, and evaporation pond. A total volume of 720,000 cubic meters of contaminated material was removed from a total area of approximately 0.34 km2. After remediation, the site was transferred to the Long-Term Surveillance Plan (LTSP). Under the LTSP, long-term inspections and groundwater monitoring are conducted periodically at the disposal sites. Analysis of subpile soil samples (samples collected from beneath the “footprint” of the former tailings piles) indicates that these soils may be a continuing source of ground water contamination, with ammonium in the subpile soil apparently contributing to nitrate contamination in ground water (DOE, 2005).
The shallow alluvial aquifer is comprised of well-sorted fine to medium sand deposits interspersed with finer silts and clays. Generally, the alluvial deposits range from 1 to 35 meters in thickness, with the greatest depths observed in the center of the valley. Depth to groundwater is approximately 11 meters. The screened intervals for most monitoring wells span approximately 15 to 25 m below ground surface. The mean hydraulic gradient is approximately 0.01, with a northeastward direction. Hydraulic conductivities range from 0.1 to 5.6 m/day for the alluvial aquifer (DOE, 1999). The sediments have relatively low iron (~ 1500 mg/kg) and manganese oxide content (~ 30 mg/kg), and low clay and organic-carbon contents.
Groundwater geochemistry within the contaminated plume is Ca-Mg-Na-SO4-CO3 type. Ca, Mg, and Na concentrations are comparable, with values ca. 105, 86, and 89 mg/L, respectively. Sulfate concentration is high, with a median value of 575 mg/L. Alkalinity as CaCO3 is approximately 220 mg/L on average. Nitrate and ammonium concentrations are also high and comparable, with median values of 101 and 75 mg/L as N, respectively.
Materials and Methods
In this study, 14 wells across the entire contaminant plume were selected for detailed geochemical and isotopic analyses of groundwater samples. Two rounds of sample collection were conducted, one in September 2009 and another during January 2010. Multiple individual subsamples were collected for each well, as enumerated in the following paragraph. The results obtained for the two sampling events were consistent. In addition, the DOE has for many years periodically monitored groundwater at the site for various geochemical parameters. These data were used to supplement the investigation reported herein. Review of the historic DOE data indicates stable conditions for many chemical parameters and constituents (except as will be discussed).
Groundwater samples were collected using dedicated bladder pumps and a QED Micropurge controller. Sampling began once field parameters (pH and dissolved oxygen) stabilized. Samples were first collected for measurement of basic field parameters (dissolved oxygen, pH, oxidation-reduction potential, and temperature), then for analyses of nitrogen species, major cations and anions (Na, Mg, K, Ca, Mn, Fe, Cl, and SO4), a suit of trace elements (V, Cr, Mn, Fe, Co, Ni, Cu, Zn, As, Se, Mo, Ag, Cd, Sn, Sb, Ba, and Pb), N and O isotopes of nitrate, and N isotopes of ammonium (only a few isotope samples were collected for ammonium). Samples for nitrogen species were collected in 500-mL HDPE bottles. Samples for cations and anions were filtered (0.45 μm) and collected in separate 250-mL HDPE bottles. Cation analysis samples were preserved with 1 mL of 1:1 hydrochloric acid (HCl). Both sample sets were stored on ice at 4°C. Finally, samples were collected for isotope analysis. These samples were filtered (0.45 μm) and collected in separate HDPE bottles of various sizes depending on the concentration. For ammonium and sulfate isotope samples, hydrochloric acid was added to pH < 2 for preservation. All samples were stored on ice in the field then frozen upon returning to the lab to curtail any additional fractionation.
Major cations and trace elements were analyzed using a Perkin Elmer ELAN DRC-II ICP-MS (inductively coupled plasma mass spectrometry), following US EPA Method 6020. Quantification limits for major cations (Na, K, Ca, Mg, Al) are mostly better than 10 μg/L. Quantification limits are 1 μg/L for Zn and Se, 0.5 for Fe, 0.2 for Mn, and approximately 0.1 μg/L for the others. Major anions (nitrate, nitrite, bromide, and sulfate) were analyzed using a Dionex ICS-1000, following EPA standard method 300.0. NH4+ analysis was done using a Hach colorimetric kit and analyzed using a Hitachi U-2000 Spectrophotometer. Quantification limits are 0.1 mg/L for NO3, NO2, F, Br and NH4 and 0.5 mg/L for Cl and SO4. A low range calibration curve was used for very low NH4 concentrations, which allowed concentration as low as 0.01 mg/L to be quantified.
The DOE routinely analyzes groundwater samples collected from most of the wells on site for ammonium, nitrate, sulfate, other major cations and anions, DO, oxidation-reduction potential (ORP), pH, radionuclides, uranium, and selected other metals. Some of the DOE data (especially uranium data) were used where current analysis was not available or incomplete. The reported quantification limit for uranium is less than 0.1 μg/L.
Stable isotope analysis of ammonium and nitrate has been demonstrated to be very useful for characterizing the occurrence of nitrification or denitrification (e.g., Kendall and Aravena, 2000) and was used in this study. Both nitrification and denitrification induce significant fractionation such that the reactant will become enriched in the heavier isotope whereas the product is enriched in the lighter isotope. Nitrification can be differentiated from denitrification by comparing N isotopes of NH4 and NO3 given that nitrification affects the isotopic composition of NH4, but denitrification does not. Analysis of nitrate isotope samples was conducted at the University of Waterloo Environmental Isotope Laboratory. Ammonium isotopes were analyzed at the Boston University Stable Isotope Laboratory. Nitrogen (15N/14N) and oxygen (18O/16O) isotope ratios are reported in delta (δ) per mil (‰) units relative to the international reference materials atmospheric nitrogen and V-SMOW, respectively, as: . Analytical precision was 0.5 ‰ for δ15N in NO3 or NH4 and 0.6 ‰ for δ18O in NO3.
Results and Discussion
Ammonium and Nitrate Transformation
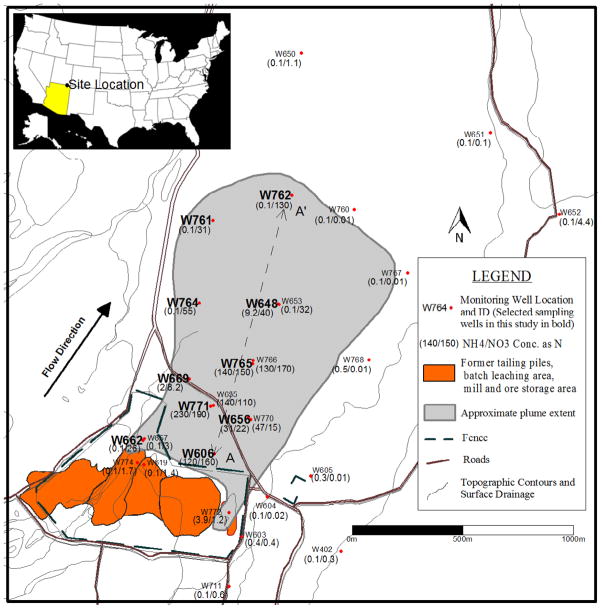
Ammonia was used during ore processing, which caused ammonium contamination in groundwater (ammonia is converted to ammonium following acidification). Nitrate (in the form of ammonium nitrate) was also used in the milling process. However, the quantity used is much smaller compared to ammonia (DOE, 2005). Both contaminants occur at high concentrations in groundwater. Ammonium and nitrate concentrations range between 0 to 230 and 0 to 190 mg/L as N, respectively. The distributions of ammonium and nitrate are shown in Figure 1. Concentrations within the source zone are low (within a few mg/L), reflecting the effectiveness of the surface remediation.
Figure 1.
Site map showing source zone (the fenced area), well locations, and NH4 and NO3 concentrations at each well. Note that wells 728 through 731, which are not shown, are very close (within several meters) to well 765.
The ammonium plume extends only to the center of the plume (defined by well 648, concentration = 9.2 mg/L as N), whereas nitrate occurs throughout the plume (e.g., well 762 concentration = 130 mg/L as N) (Figure 1). Furthermore, a general trend of decreasing NH4/NO3 ratio is observed along the cross-section AA′ (Figure 2), which represents a longitudinal transect in the center of the plume (Figure 1). One exception is the first data point (well 606), which is closest to the source zone and for which the NH4/NO3 ratio is probably influenced by the prior surface remediation. This difference in spatial distributions of ammonium and nitrate can be attributed to either retardation or nitrification of ammonium, or some combination of the two. It is difficult to distinguish between the effects of retardation and nitrification based solely on the ammonium and nitrate concentration data.
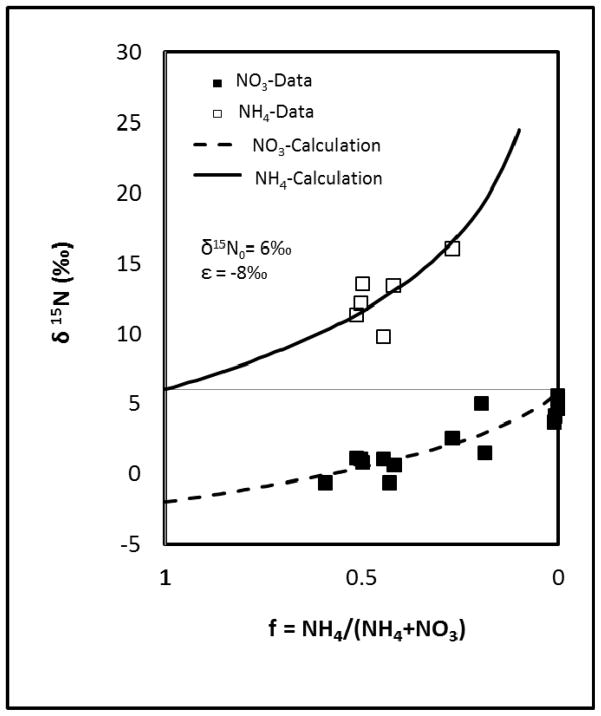
Figure 2.
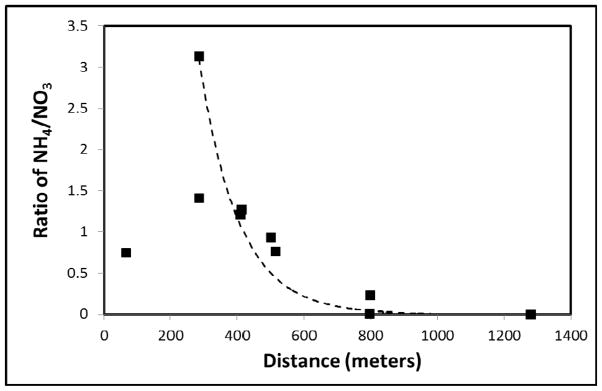
Change of NH4/NO3 ratio relative to the distance from the source zone along the cross-section AA′.
Stable isotopes of ammonium and nitrate were used to further investigate the fate of ammonium. The N isotope compositions of NH4 and NO3 plotted relative to the ratio of ammonium to total nitrogen (NH4 + NO3) are shown in Figure 3. First of all, the delta;15N of NH4 is approximately 12‰ greater than the δ15N of NO3. Second, both δ15N of NH4 and δ15N of NO3 increase as the ratio of ammonium decreases. This is consistent with the isotopic effect of a nitrification process (e.g., Aravena and Mayer, 2009). The data matches well with the regression based on Rayleigh fractionation, with optimized values of 6‰ for initial δ15N and −8‰ for the enrichment factor (Figure 3). The enrichment factor, which is a measure of the difference between the δ values of the product and the reactant, is consistent with values reported in the literature ranging between −5 and −35‰ (Aravena and Mayer, 2009).
Figure 3.
δ15N of ammonium and nitrate vs the ratio of remaining ammonium. Data are represented by square symbols and calculation results are represented by curves. The calculation used an initial δ15N of ammonium equals to 6‰ and an enrichment factor of −8‰.
The good fit produced by the Rayleigh equation does not necessarily indicate that nitrification is the sole process influencing the fate of ammonium. For example, there may be uncertainties in the two underlying assumptions for the Rayleigh fractionation analysis: 1) retardation of ammonium has not influenced the inherent concentration distribution between ammonium and nitrate, 2) nitrate is produced solely through nitrification (i.e. nitrate applied during mill operation is negligible). However, the assumptions may be relatively robust given the existing conditions at the site. The sediments are relatively homogeneous sands with low metal-oxide, clay, and organic-carbon contents. Furthermore, the aqueous concentrations of cation-exchange competitors, Ca, Mg, and Na, are relatively high (Table 1). Therefore, retardation of ammonium is most likely relatively small. In addition, the quantity of nitrate used during mill operation was relatively small, and it is likely that this nitrate entered the subsurface during the early stages of plume development (thus residing in the leading edge of the plume). Therefore, nitrate within the major part of the plume most likely was generated from nitrification. It is difficult to fully evaluate the validity of these assumptions. However, the fact that the δ15N of NH4 is more enriched than the δ15N of NO3, along with the observed trend of increasing δ15N for NH4 with decreasing NH4 ratio (i.e., depletion of NH4 is resulting in its enrichment in 15N) are strong lines of evidence for nitrification.
Table 1.
General geochemistry and trace element concentrations for groundwater collected from the 14 sampled wells. Element concentrations are all μg/L. Concentrations of other constituents are mg/L. NH4 and NO3 are as N. Alkalinity is as CaCO3. U and alkalinity are from the DOE database. ND means non-detected and “−“ means not analyzed.
| Cations
| ||||||||||||||||
|---|---|---|---|---|---|---|---|---|---|---|---|---|---|---|---|---|
| Well ID | Na | K | Ca | Mg | Al | Mn | Fe | U | Cr | Se | V | Ni | Co | Zn | As | Ba |
| 606 | 71042 | 6398 | 138837 | 93194 | 11.6 | 61.88 | 10.43 | 8 | 0.08 | 0.98 | 4.82 | 9.03 | 19.85 | 44.40 | 4.16 | 45.10 |
| 648 | 125562 | 6814 | 115857 | 115857 | 10.4 | 1.03 | 2.24 | 10 | 0.14 | 1.28 | 12.70 | 6.51 | 16.15 | 38.00 | 3.59 | 17.30 |
| 656 | 67773 | 6413 | 25693 | 20838 | 13.4 | 1.84 | 8.26 | 5 | 0.14 | 1.88 | 5.63 | 1.20 | 2.73 | 48.20 | 3.62 | 27.50 |
| 662 | 27040 | 1704 | 108774 | 58996 | 14.2 | 0.22 | 0.92 | 85 | 2.49 | 10.90 | 26.50 | 4.97 | 12.55 | 47.30 | 3.61 | 17.30 |
| 669 | 30814 | 3446 | 51694 | 36085 | 11.5 | 2.44 | 1.25 | 7 | 0.30 | 3.09 | 45.50 | 2.16 | 5.30 | 41.80 | 3.17 | 34.20 |
| 728 | 85165 | 16491 | 98221 | 94405 | 14.3 | 67.08 | 1.50 | - | 0.04 | 0.43 | 7.64 | 6.31 | 13.55 | 41.50 | 3.57 | 27.00 |
| 729 | 81913 | 15913 | 111237 | 90905 | 16.2 | 7.99 | 53.70 | - | 0.07 | 0.43 | 9.72 | 4.82 | 11.15 | 38.00 | 3.56 | 20.40 |
| 730 | 84010 | 16333 | 103992 | 92778 | 16.7 | 17.78 | 9.26 | - | 0.07 | 0.61 | 9.38 | 4.98 | 10.95 | 39.90 | 3.55 | 21.00 |
| 731 | 83241 | 15968 | 110254 | 91845 | 14.6 | 74.18 | 144.10 | - | 0.04 | 0.43 | 7.50 | 5.70 | 11.05 | 36.40 | 2.78 | 24.10 |
| 761 | 52546 | 553 | 100714 | 89170 | 7.6 | 0.16 | 0.96 | 30 | 0.74 | 3.32 | 3.81 | 5.08 | 11.75 | 23.00 | 1.85 | 26.30 |
| 762 | 366262 | 3621 | 157410 | 151649 | 12.5 | 2.31 | 1.38 | 11 | 1.06 | 7.90 | 9.30 | 7.58 | 17.15 | 33.50 | 4.32 | 13.50 |
| 764 | 41162 | 1090 | 101274 | 78655 | 13.5 | 0.18 | 0.50 | 13 | 0.36 | 1.94 | 14.10 | 3.05 | 8.47 | 41.40 | 3.57 | 24.40 |
| 765 | 44781 | 6253 | 68988 | 45588 | 6.0 | 3.81 | 0.99 | 10 | 0.02 | 0.46 | 5.03 | 2.91 | 5.80 | 21.10 | 1.67 | 10.20 |
| 771 | 85175 | 47835 | 177414 | 137450 | 6.9 | 1.76 | 33.30 | 14 | 0.05 | 0.36 | 7.94 | 8.41 | 19.05 | 24.80 | 2.93 | 16.50 |
| N species and others
| |||||||||||
|---|---|---|---|---|---|---|---|---|---|---|---|
| NH4 | NO3 | NO2 | SO4 | Alkalinity | F | Cl | PO4 | TOC | DO | pH | |
| 606 | 116.1 | 223.83 | ND | 361.34 | 209 | 0.50 | 19.47 | 4.59 | 1.20 | 1.02 | 7.08 |
| 648 | 6.3 | 52.99 | ND | 811.74 | 215 | 0.23 | 20.51 | 5.38 | 1.33 | 0.95 | 7.49 |
| 656 | 40.8 | 56.93 | ND | 161.37 | 253 | 0.39 | 14.11 | 0.64 | 6.47 | 2.30 | 7.82 |
| 662 | 0.0 | 22.47 | ND | 273.55 | 205 | 0.17 | 14.00 | 2.08 | 0.71 | 7.45 | 7.41 |
| 669 | 2.6 | 10.86 | ND | 101.39 | 190 | 0.20 | 6.38 | ND | 0.23 | 2.01 | 7.59 |
| 728 | 105.8 | 130.55 | ND | 574.59 | - | 0.18 | 23.71 | 3.51 | 9.06 | 2.87 | 7.65 |
| 729 | 127.2 | 143.14 | ND | 581.28 | - | 0.27 | 19.62 | 3.16 | 6.67 | 3.59 | 7.37 |
| 730 | 134.9 | 112.71 | ND | 525.65 | - | 0.19 | 16.36 | ND | 6.55 | 3.31 | 7.40 |
| 731 | 127.0 | 122.68 | ND | 572.60 | - | 0.17 | 15.83 | 1.71 | 6.46 | 2.25 | 7.20 |
| 761 | 0.3 | 31.60 | ND | 478.68 | 182 | 0.21 | 15.08 | 5.38 | 0.60 | 5.35 | 7.39 |
| 762 | 0.1 | 107.23 | ND | 1450.19 | 225 | 0.11 | 63.57 | 5.08 | 1.68 | 3.22 | 7.56 |
| 764 | 0.4 | 42.15 | ND | 279.99 | 188 | 0.26 | 11.93 | ND | 0.35 | 6.37 | 7.66 |
| 765 | 107.8 | 170.58 | ND | 586.22 | 253 | 0.17 | 16.68 | 5.26 | 2.74 | 2.34 | 7.40 |
| 771 | 276.2 | 198.19 | ND | 1287.75 | 287 | 0.09 | 17.26 | 4.01 | 11.58 | 1.83 | 7.22 |
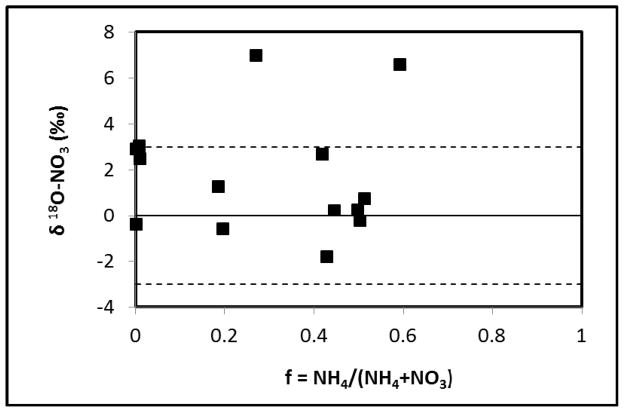
The oxygen isotope composition of nitrate was also examined (Figure 4). Values range from −1.81 to 6.96‰, with most of the values within ±3‰. No general trend was observed when the oxygen isotope signature is plotted against the remaining ammonium fraction. Oxygen isotope fractionation for nitrate is controlled by the isotopic composition of the oxygen sources involved in the process. Traditional theory states that the nitrification of ammonium to nitrate involves incorporation of a total of three oxygen atoms, i.e. two atoms from H2O and one atom from atmospheric oxygen. Atmospheric oxygen has a δ18O value of +23.5‰ (Kroopnick and Craig 1972), whereas most groundwater has a δ18O value of approximately −10‰ (e.g., Clark and Fritz, 1997). Thus, the resultant nitrate should have a δ18O value close to 0‰. However, field values slightly higher than the theoretical value have been reported and have been attributed to 18O enrichment in H2O due to evaporation (Wassenaar, 1995; Kendall and McDonnell, 1998). In this study, the tailing solution was stored in open impoundments under arid conditions, and severe evaporation is expected. The observation that most of the δ18O values of nitrate are within ±3‰ is consistent with nitrification of ammonium.
Figure 4.
δ18O of nitrate relative to ratio of remaining ammonium. Dashed lines delineate the range of ±3 ‰.
Major local-scale spatial variability in parameters such as DO and ORP appear to be absent within the plume. There is however a general trend of lower values of these parameters in the core of the plume and higher values near the plume perimeter, as would be expected. The redox conditions of the aquifer are generally suitable for nitrification, with DO levels typically slightly more than 1 mg/L. However, values below 1 mg/L occur within localized zones, and are probably associated with areas of greater microbial activity. The results of previous studies, employing stable-isotope analysis, reactive-transport modeling, and laboratory microcosm experiments, indicated that denitrification was occurring at this site at a slow rate, particularly in the downgradient portion of the plume (Carroll et al., 2009; Jordan et al., 2008). In light of the evidence presented, it is concluded that nitrification of ammonium is the primary process influencing the fate of ammonium in the subsurface, and that nitrification and denitrification are jointly impacting nitrate fate.
Relationships between Ammonium and Trace Elements
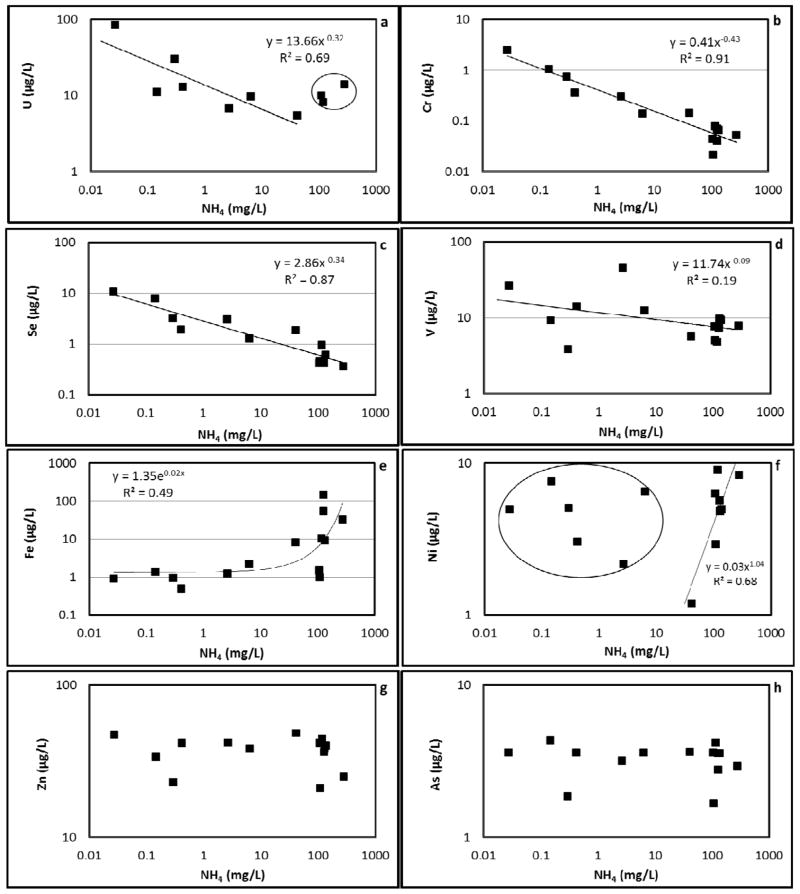
Trace element concentrations in the groundwater contaminant plume are relatively low. Trace elements evaluated include uranium (U), chromium (Cr), selenium (Se), vanadium (V), iron (Fe), manganese (Mn), nickel (Ni), cobalt (Co), zinc (Zn), arsenic (As), and barium (Ba) (Table 1). Figure 5 shows the observed relationships between trace element concentrations and ammonium. The relationships will be discussed by classifying them into three types of behavior.
Figure 5.
Trace element concentrations relative to ammonium concentration. The regressions for plots a and f excluded the circled data.
The first type of behavior is an inverse relationship between trace-element and ammonium concentrations. Such a relationship was observed for uranium, chromium, selenium, and vanadium (Figure 5, a, b, c, and d). Uranium concentrations ranged from 5–85 μg/L (MCL = 30 μg/L). The highest uranium concentrations were observed for the cases wherein ammonium concentrations were very low. It is well known that microbial reduction of U(VI), the soluble, mobile, oxidized form of uranium, to relatively insoluble U(IV) is an important mechanism for immobilization of uranium in the subsurface (e.g., Lovley et al., 1991). In this case, it is hypothesized that ammonium, a reducing agent, sustains the reducing condition in the aquifer, and keeps uranium immobilized. The impact of ammonium on the redox condition is manifested by the relationship between ammonium and dissolved oxygen (Figure 6a). Dissolved oxygen is observed to be inversely related to ammonium, which implies that the consumption of oxygen by nitrification is the primary mechanism that controls the redox status. In addition, natural organic carbon (measured by TOC), which can be an indicator for reducing conditions, also exhibits a direct relationship with ammonium (Figure 6b). This relationship is attributed to the typical observation that organic carbon is significantly less labile under reducing conditions and is therefore expected to be present at higher concentrations, coupled with the impact of ammonium oxidation on maintaining reducing conditions at the site. In the complex subsurface environment, there are other processes such as aqueous complexation (with CO32−, SO42−, OH− and organic matter) and sorption that can influence the mobility of uranium (Bernhard et al., 1998). However, the influence of redox conditions appears to have the greatest impact on uranium disposition for the study site.
Figure 6.
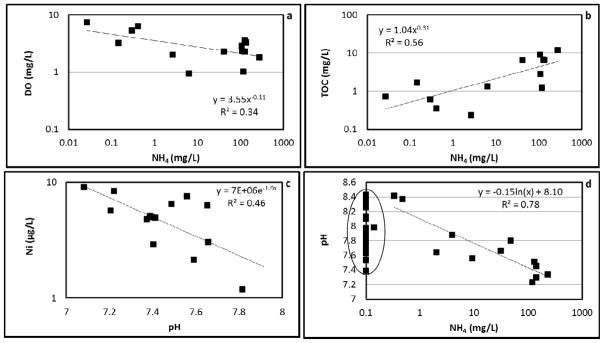
DO, TOC, and pH vs ammonium concentration and Ni concentration vs pH.
Chromium, selenium, and vanadium also exhibited inverse correlations with ammonium (Figure 5, b, c, and d). The common property among these elements, which form anions in solution, is that their oxidation state is sensitive to redox conditions, and they all have higher mobility in their higher oxidation state, similar to uranium. For example, Cr(VI) compounds are highly soluble, mobile, and bioavailable compared to the sparingly soluble Cr(III) compounds. Similarly, selenates (SeO42−) are more soluble compared to selenite (SeO32−), and vanadium exists primarily in oxidation states 3–5 and the higher the oxidation state, the more soluble they are (Cornelis, 2005).
It is worth noting that stronger linear relationships are observed for Cr and Se compared to U and V (Figure 5, a, b, c, and d). However, the relationship for U is improved significantly by excluding the three data points that have the highest ammonium concentrations (> 100 mg/L as N). This might indicate an enhanced metal mobility, possibly through aqueous complexation with organic carbon (e.g., Markich, 2002; Ranville et al., 2007), at high ammonium concentration. For V, the relationship is impaired by the two data points associated with the highest and lowest V concentrations. The potential sensitivity of the relationships for Cr, Se, and U concentrations is suggested by the linearity observed even at lower concentrations (0.01–1 mg/L) of NH4.
The second type of behavior is a direct correlation between trace-element and ammonium concentration. Such behavior was observed for iron (Figure 5e) and manganese (similar to Fe, data not shown), which are commonly used for assessing groundwater redox conditions. They are also sensitive to redox conditions, but in contrast to U, Cr, Se, and V, they speciate from solid-phase oxides to aqueous-phase cations under reducing conditions. Their concentrations are hypothesized to be related to ammonium concentration through the impact of ammonium on redox status. In addition, studies have shown that ammonium can serve as an electron donor for direct oxidation by manganese oxides (Hulth et al., 1999), the net result of which would increase the aqueous concentration of Mn. In both cases (ammonium maintaining a reducing condition or direct oxidation of ammonium), an overall increased elemental concentration with increased ammonium concentration is expected.
The third type of behavior is a slight or no apparent correlation between elemental and ammonium concentrations. This class includes Ni, Co, Zn, As, and Ba (Figure 5f, g, and h). Unlike those trace elements mentioned in the first two classes, all of the elements in this class except As have relatively stable oxidation states. Therefore, their concentrations are not affected by redox conditions, and they are not influenced by ammonium concentrations in the manner discussed above.
It is known that the aqueous concentration of Ni is dependent on pH in the presence of metal-oxide surfaces, whose adsorption capacity is mediated by pH (e.g., Cornelis, 2005). Figure 6c shows the relationship between Ni and pH, which is consistent with the observed increase in sorption with increasing pH typically reported in the literature (e.g., Cornelis, 2005). Interestingly, it is observed that pH may correlate negatively to ammonium concentration for concentrations greater than 0.1 mg/L (Figure 6d), most likely because NH4 acts as a weak acid. Thus, a positive correlation between Ni and ammonium can be established excluding the points with relatively small ammonium concentrations (Figure 5f). Cobalt exhibits behavior similar to that of nickel (data not shown). Zn, which may be expected to exhibit similar behavior as Ni and Co, however, showed no such correlation to ammonium (Figure 5g).
The distribution of arsenic between the solution and solid phases is expected to be dependent on redox condition, given that the solubility of its reduced form is higher. However, arsenic is present as an oxyanion in aqueous solution, which means that its sorption would typically increase with decreasing pH. As shown above, higher ammonium concentration is associated with lower pH (enhanced sorption for As), and stronger reducing conditions (higher solubility for As). It is hypothesized that the two competing processes rendered the arsenic concentration in effect uncorrelated to ammonium concentration (Figure 5h). Finally, barium concentration (data not shown) is controlled by sulfate, according to the saturation indices of barium sulfate (close to saturation). Thus, its behavior is not influenced by ammonium concentration.
Implications for Groundwater Remediation
In-situ remediation of ammonium- or nitrate-contaminated groundwater typically involves an oxidation step (ammonium to nitrate) and/or a reducing step (nitrate to nitrogen gas) (e.g., Patterson et al., 2004; Nooten et al., 2008). The potential impact of changes in redox conditions on the mobility of certain trace elements should be considered when such a remediation strategy is used. A brief discussion of a recent pilot test will be presented to illustrate this point.
A pilot-scale test was recently conducted at the Monument Valley site to investigate the efficacy of nitrate remediation by biostimulation (Borden et al., 2012). Specifically, groundwater containing a few percent of ethanol was injected to induce reducing conditions and promote denitrification. Several lines of evidence indicated that the injection caused denitrification, which resulted in a very large decrease in concentrations of nitrate in groundwater. It was observed that after the injection, the concentration of uranium in groundwater collected from the injection well decreased by a factor of 30 over time (Figure 7). Conversely, arsenic concentration increased more than fivefold. Both changes are suggested to be a result of the change in redox condition induced by addition of the electron donor and concomitant increase in microbial activity (enhanced denitrification). These results illustrate the impact that changes in redox conditions can have on the disposition of trace elements.
Figure 7.
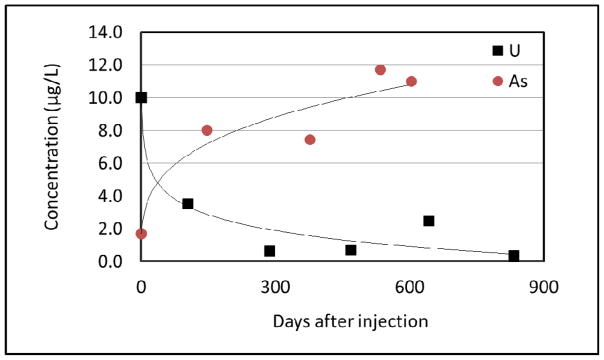
Change of uranium and arsenic concentrations over time after biostimulation.
Conclusions
Nitrification was confirmed to be occurring at this site. The consumption of oxygen by ammonium oxidation has led to reducing conditions in the aquifer. It is hypothesized that this impact on redox conditions influences the fate of several trace elements, specifically uranium, chromium, selenium, vanadium, iron, and manganese. Ammonium also appears to have a small impact on pH, and consequently is speculated to influence the adsorption capacity of solid-phase metal oxides, and thus the distribution of nickel and cobalt.
The exhaustion of ammonium (complete conversion to nitrate) will eventually result in oxic conditions within the aquifer. In addition to the nitrification process, the distribution of ammonium is also influenced by plume migration. Such transitions in ammonium and nitrate distributions will fundamentally alter subsurface conditions (redox, pH) and may influence the distribution of certain trace elements. For example, such a transition in redox status to more oxidizing conditions could result in the mobilization of trace elements in the first class (U, Cr, Se, and V). This potential behavior should be considered when evaluating the application of remedial technologies that alter redox conditions.
Table 2.
NO3 and NH4 concentrations (in mg/L as N) and corresponding δ15N and δ18O values (“−“ means not analyzed).
| Wells | NO3 Conc. | NH4 Conc. | f=NH4/(NH4+NO3) | δ15N-NO3 (‰) | δ18O-NO3 (‰) | δ15N-NH4 (‰) |
|---|---|---|---|---|---|---|
| 606 | 160 | 120 | 0.43 | −0.65 | −1.81 | 9.76 |
| 648 | 40 | 9 | 0.19 | 1.50 | 1.26 | - |
| 656 | 110 | 41 | 0.27 | 2.53 | 6.96 | 16.01 |
| 662 | 26 | 0 | 0.00 | 4.64 | 2.9 | - |
| 669 | 8.2 | 2 | 0.20 | 5.02 | −0.58 | - |
| 761 | 31 | 0 | 0.01 | 3.64 | 2.5 | - |
| 762 | 130 | 0 | 0.00 | 5.57 | −0.39 | - |
| 764 | 55 | 0 | 0.01 | 4.10 | 3.03 | - |
| 765 | 150 | 108 | 0.42 | 0.59 | 2.69 | 13.38 |
| 771 | 190 | 276 | 0.59 | −0.64 | 6.58 | - |
| 728 | 132 | 106 | 0.44 | 1.07 | 0.21 | - |
| 729 | 126 | 127 | 0.50 | 1.07 | −0.22 | 12.11 |
| 730 | 128 | 135 | 0.51 | 1.12 | 0.74 | 11.30 |
| 731 | 128 | 127 | 0.50 | 0.80 | 0.26 | 13.50 |
Highlights.
Nitrification of ammonium evidenced by stable isotopes of nitrate at a mining site
Concentrations of uranium and other trace elements related to ammonium conc.
Observed impact of ammonium on redox, pH, and possibly complexation
Proposed impact of transformation of NO3 and NH4 on trace elements
Acknowledgments
This research was supported by the University of Arizona TRIF Water Sustainability Program through the Center for Environmentally Sustainable Mining, and the NIEHS Superfund Research Program (P42 ES04940). We thank members of the contaminant transport lab of the University of Arizona for assisting the field work. We also thank the reviewers for their constructive comments.
Footnotes
Publisher's Disclaimer: This is a PDF file of an unedited manuscript that has been saccepted for publication. As a service to our customers we are providing this early version of the manuscript. The manuscript will undergo copyediting, typesetting, and review of the resulting proof before it is published in its final citable form. Please note that during the production process errors may be discovered which could affect the content, and all legal disclaimers that apply to the journal pertain.
References
- Aravena R, Mayer B. Isotopes and processes in the nitrogen and sulfur cycles. In: Aelion CM, Höhener P, Hunkeler D, Aravena R, editors. Environmental isotopes in biodegradation and bioremediation. Boca Raton: CRC Press; 2009. pp. 203–246. [Google Scholar]
- Bernhard G, Geipel G, Brendler V, Nitsche H. Uranium speciation in waters of different uranium mining areas. Journal of Alloys and Compounds. 1998;271–273(0):201–205. [Google Scholar]
- Carroll KC, Jordan FL, Glenn EP, Jody Waugh W, Brusseau ML. Comparison of nitrate attenuation characterization methods at the Uranium mill tailing site in Monument Valley, Arizona. Journal of Hydrology. 2009;378(1–2):72–81. [Google Scholar]
- Christensen TH, Bjerg PL, Banwart SA, Jakobsen R, Heron G, Albrechtsen HJ. Characterization of redox conditions in groundwater contaminant plumes. Journal of Contaminant Hydrology. 2000;45(3–4):165–241. [Google Scholar]
- Christensen TH, Kjeldsen P, Bjerg PL, Jensen DL, Christensen JB, Baun A, Albrechtsen HJ, Heron C. Biogeochemistry of landfill leachate plumes. Applied Geochemistry. 2001;16(7–8):659–718. [Google Scholar]
- Clark ID, Fritz P. Environmental isotopes in hydrogeology. CRC Press. Lewis Publishers; Boca Raton, FL: 1997. p. 328. [Google Scholar]
- Clark I, Timlin R, Bourbonnais A, Jones K, Lafleur D, Wickens K. Origin and fate of industrial ammonium in anoxic ground water - (15)N evidence for anaerobic oxidation (anammox) Ground Water Monitoring and Remediation. 2008;28(3):73–82. [Google Scholar]
- Cornelis Rita. In: Handbook of elemental speciation II: species in the environment, food, medicine and occupational Health. Caruso Joe, Crews Helen, Heumann Klaus., editors. J. Wiley; 2005. [Google Scholar]
- Dawson S. Navajo Uranium Workers and the Effects of Occupational Illnesses: A Case Study. Human Organization. 1992;51(4):389–397. [Google Scholar]
- DOE. Final site observational work plan for the UMTRA project site at the Monument Valley, Arizona. US Department of Energy, Office of Legacy Management; 1999. Document: U0018101. [Google Scholar]
- DOE. Environmental Assessment of Ground Water Compliance at the Monument Valley, Arizona, Uranium Mill Tailings Site. 2005. DOE/EA-1313. [Google Scholar]
- Domenico PA, Schwartz FW. Physical andChemical Hydrogeology. 2. Wiley; New York: 1998. [Google Scholar]
- Hulth S, Aller RC, Gilbert F. Coupled anoxic nitrification manganese reduction in marine sediments. Geochimica Et Cosmochimica Acta. 1999;63(1):49–66. [Google Scholar]
- IAEA (International Atomic Energy Agency) The Long Term Stabilization of Uranium Mill Tailings–IAEA TECDOC-1403. Vienna: 2004. [Google Scholar]
- Ivanova IA, Stephen JR, Chang YJ, Bruggemann J, Long PE, McKinley JP, Kowalchuk GA, White DC, Macnaughton SJ. A survey of 16S rRNA and amoA genes related to autotrophic ammonia-oxidizing bacteria of the beta-subdivision of the class proteobacteria in contaminated groundwater. Canadian Journal of Microbiology. 2000;46(11):1012–1020. doi: 10.1139/w00-099. [DOI] [PubMed] [Google Scholar]
- Johnson D, Humenick M. Nitrification and In-Situ Uranium Solution Mining. Old SPE Journal. 1980;20(5):415–422. [Google Scholar]
- Jordan F, Jody Waugh W, Glenn EP, Sam L, Thompson T, Lewis Thompson T. Natural bioremediation of a nitrate-contaminated soil-and-aquifer system in a desert environment. Journal of Arid Environments. 2008;72(5):748–763. [Google Scholar]
- Kendall C, Aravena R. Nitrate isotopes in groundwater systems. In: Cook P, Herczeg AL, editors. Environmental Tracers in Subsurface Hydrology. Chapter 9. Kluwer Academic Publishers; 2000. pp. 261–297. [Google Scholar]
- Kendall C, McDonnell JJ. Isotope tracers in catchment hydrology. Elsevier Science Limited; 1998. [Google Scholar]
- Landa ER. Uranium mill tailings: nuclear waste and natural laboratory for geochemical and radioecological investigations. Journal of Environmental Radioactivity. 2004;77(1):1–27. doi: 10.1016/j.jenvrad.2004.01.030. [DOI] [PubMed] [Google Scholar]
- Longmire P, Thomson BM. Evidence for denitrification at a uranium-mill tailings site, Maybell, Colorado, USA (in Proceedings of the 7th international symposium on water-rock interaction; Volume 1, Low temperature environments). Proceedings - International Symposium on Water-Rock Interaction; 1992. pp. 295–300. [Google Scholar]
- Lovley DR, Phillips EJP, Gorby YA, Landa ER. Microbial Reduction of Uranium. Nature. 1991;350(6317):413–416. [Google Scholar]
- Markich SJ. Uranium speciation and bioavailability in aquatic systems: an overview. Scientific World J. 2002;2:707–729. doi: 10.1100/tsw.2002.130. [DOI] [PMC free article] [PubMed] [Google Scholar]
- Nooten TV, Diels L, Bastiaens L. Design of a Multifunctional Permeable Reactive Barrier for the Treatment of Landfill Leachate Contamination: Laboratory Column Evaluation. Environmental Science & Technology. 2008;42(23):8890–8895. doi: 10.1021/es801704t. [DOI] [PubMed] [Google Scholar]
- OECD/IAEA. Uranium 2011. OECD Publishing; 2011. [Google Scholar]
- Patterson BM, Grassi ME, Robertson BS, Davis GB, Smith AJ, Mckinley AJ. Use of polymer mats in series for sequential reactive barrier remediation of ammonium-contaminated groundwater: Field evaluation. Environmental Science & Technology. 2004;38(24):6846–6854. doi: 10.1021/es0497781. [DOI] [PubMed] [Google Scholar]
- Rael G, Pinkel L, Artiglia E, Johnson K, Zeurcher D, Cox S, Harrison R, Fahy L, Mathes D. UMTRA management approach, honoring commitments. WM’99 Conference, Feb 28–Mar. 1999;4:1999. [Google Scholar]
- Ranville JF, Hendry MJ, Reszat TN, Xie Q, Honeyman BD. Quantifying uranium complexation by groundwater dissolved organic carbon using asymmetrical flow field-flow fractionation. J Contamin Hydrol. 2007;91:233–246. doi: 10.1016/j.jconhyd.2006.11.002. [DOI] [PubMed] [Google Scholar]
- US EPA. Radiation Protection, “Uranium Mining Waste”. 2012 http://www.epa.gov/radiation/tenorm/uranium.html.
- US EPA. Health and Environmental Impacts of Uranium Contamination in the Navajo Nation: Five-Year Plan. US Environmental Protection Agency (EPA), the Bureau of Indian Affairs (BIA), the Nuclear Regulatory Commission (NRC), the Department of Energy (DOE), and the Indian Health Service (IHS); 2008. Jun 9, [Google Scholar]
- Wassenaar LI. Evaluation of the Origin and Fate of Nitrate in the Abbotsford Aquifer Using the Isotopes of N-15 and O-18 in NO3−. Applied Geochemistry. 1995;10(4):391–405. [Google Scholar]
- Wu WM, Carley J, Green SJ, Luo J, Kelly SD, Van Nostrand J, Lowe K, Mehlhorn T, Carroll S, Boonchayanant B, Lofller FE, Watson D, Kemner KM, Zhou JZ, Kitanidis PK, Kostka JE, Jardine PM, Criddle CS. Effects of Nitrate on the Stability of Uranium in a Bioreduced Region of the Subsurface. Environmental Science & Technology. 2010;44(13):5104–5111. doi: 10.1021/es1000837. [DOI] [PubMed] [Google Scholar]


