Abstract
The aim of this study was to derive land cover products with a 300-m pixel resolution of Envisat MERIS (Medium Resolution Imaging Spectrometer) to quantify net primary productivity (NPP) of conifer forests of Taurus Mountain range along the Eastern Mediterranean coast of Turkey. The Carnegie-Ames-Stanford approach (CASA) was used to predict annual and monthly regional NPP as modified by temperature, precipitation, solar radiation, soil texture, fractional tree cover, land cover type, and normalized difference vegetation index (NDVI). Fractional tree cover was estimated using continuous training data and multi-temporal metrics of 47 Envisat MERIS images of March 2003 to September 2005 and was derived by aggregating tree cover estimates made from high-resolution IKONOS imagery to coarser Landsat ETM imagery. A regression tree algorithm was used to estimate response variables of fractional tree cover based on the multi-temporal metrics. This study showed that Envisat MERIS data yield a greater spatial detail in the quantification of NPP over a topographically complex terrain at the regional scale than those used at the global scale such as AVHRR.
Keywords: NPP, Envisat MERIS, CASA, Mediterranean conifer forest
1. Introduction
Vegetation plays an important role in the energy, matter and heat exchange between the land surface and atmosphere. Through the process of photosynthesis, plants assimilate carbon (C) from the atmosphere, incorporate into organic matter and emit some of C back as CO2 into the atmosphere through plant respiration in a given space and time scale, called net primary productivity (NPP). NPP is an important component of the global carbon budget and a key indicator of ecosystem function [1]. Improved methodologies and remote sensing technologies to account for carbon sources and sinks in different land uses and land covers (e.g. agriculture, forest, grassland, mining lands, and urban areas) are essential to a better understanding and quantification of the global carbon cycle and devising mitigative and preventive measures towards the stabilization of atmospheric CO2 concentration. Forest ecosystems as major terrestrial carbon sinks are particularly important to the global carbon cycle and are being destructed increasingly by local human activities [2]. This necessitates bottom-up approach for monitoring and quantification of rate, extent, and magnitude of local human-induced disturbances inflicted on forests (e.g. deforestation, over-harvesting, biomass burning, and outbreaks). However, interpolations from the global and continental scales and extrapolations from the site scales may result in inadequate representation and information loss about changes in ecosystem structure and function, particularly, over complex terrains, and therefore, need to be bridged by meso-scale models [29-31].
There are many biogeochemical models developed to quantify and map global NPP using NDVI images as a function of absorbed photosynthetically active radiation (APAR) (400 to 700 nm) and biome- or plant functional group-specific light use efficiency (LUE) (ε) [3-6]. Running et al. [7] pointed to the importance of variations in three factors in the context of using remote sensing to derive spatial estimates of NPP: (1) spatial resolution; (2) land cover classification; and (3) LUE estimates. Envisat MERIS (Medium Resolution Imaging Spectrometer) is a potentially valuable sensor for the measurement and monitoring of terrestrial ecosystems at the regional-to-global scales [8]. Envisat MERIS is one of the radiometrically most accurate imaging spectrometers and measures solar radiation reflected by the Earth, at a ground spatial resolution of 300 m, with 15 spectral bands in visible and near infra-red, and global coverage of the Earth every 3 days [9].
The objective of this paper was to quantify conifer forest NPP of Taurus Mountain range along the eastern Mediterranean coast of Turkey using the Carnegie-Ames-Stanford approach (CASA) [3] and land cover products of Envisat MERIS dataset.
2. Study Area and Data
2.1. Study Area
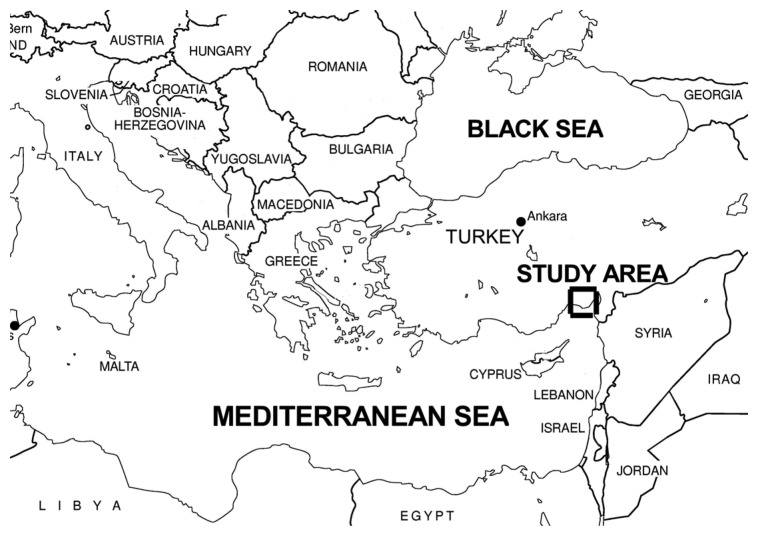
The study area is located on the Taurus Mountain chain in the eastern Mediterranean region of Turkey (Figure 1) and covers the entire Seyhan watershed of ca. 21,000 km2 in the region. Altitude in the study region ranges from sea level to 3679 m, with a mean altitude of 1271 m above sea level. Forests in the study region are old-growth Mediterranean evergreen needleleaf forests with dominant tree species of Crimean pine (Pinus nigra), Lebanese cedar (Cedrus libani), Taurus fir (Abies cilicica), Turkish pine (Pinus brutia), and juniper (Juniperus excelsa) in pure and mixed stands [10, 11]. The prevailing Mediterranean climate is characterized by mild and rainy winters and hot and dry summers with a mean annual precipitation of ca. 800 mm 75% of which falls mainly during the autumn (September to November) and winter (December to March) seasons. Mean annual temperature is 19°C, with mean minimum and maximum air temperatures of 8°C in January and 30°C in July, respectively. Dominant soils of the forest stands are Lithic Xerorthent of Entisol developed on fluvial and lacustrine materials during the Oligocene Epoch [12].
Figure 1.
Location of the study area.
2.2. Envisat MERIS data
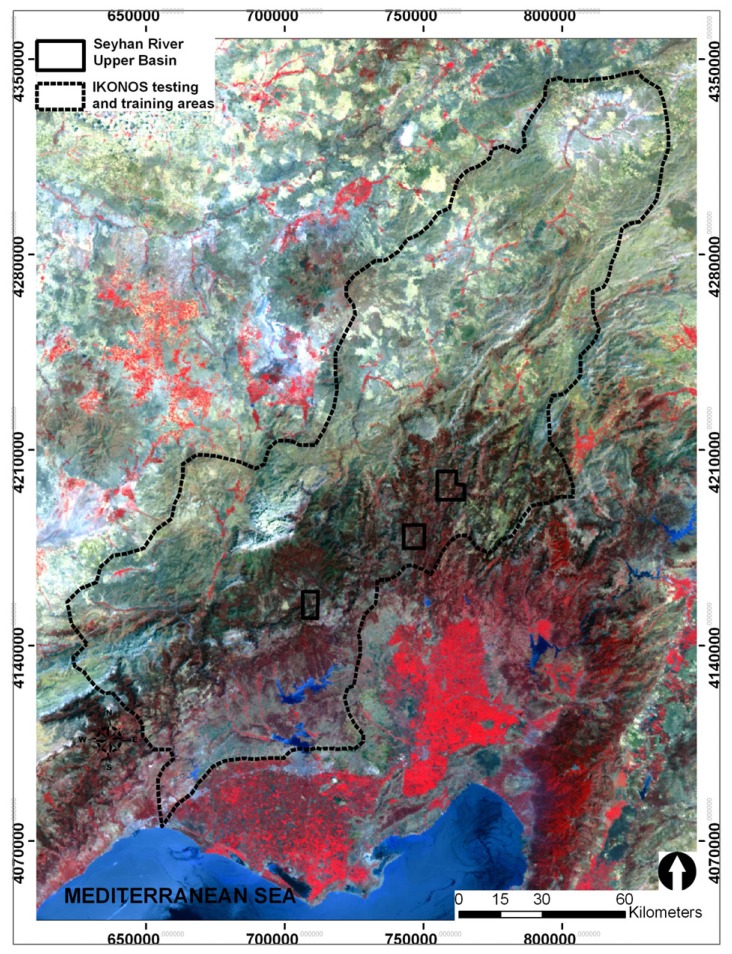
Envisat MERIS dataset used in the study consisted of 47 images of March 2003 to September 2005 (Figure 2). Three sub-scenes of multi-spectral IKONOS imagery representing different types of forest cover acquired in May 2002 were used as training and testing dataset in the estimation of fractional tree cover. In the analysis, forestry and topographic maps and aerial photographs at the scale of 1:25000 were also used.
Figure 2.
Envisat MERIS image of the study area, and IKONOS training and testing areas.
2.3. Climate Data
Climate data included monthly precipitation, air temperature, and solar radiation and were generated based on a 9-year record (1994 to 2003) from 50 climate stations across Seyhan watershed. Spatial interpolation method of co-kriging was implemented with digital elevation model (DEM) as the co-explanatory variable to map the climate variables on a monthly basis. The grid maps had a 300 m spatial resolution, and their prediction accuracy was tested comparing predicted versus observed values (R2).
2.4. Soil Texture
Soil texture data were based on soil texture classification of FAO. The designations “coarse”, “medium”, “fine”, or their combination were based on the relative amounts of clay, silt, and sand present in the top 30 cm of soil for the dominant soil type in a soil unit. The regional soil maps at the 25000 scale was utilized for this study, and seven soil texture classes were assigned on the basis of estimated clay content according to FAO [13].
3. Modeling and Mapping NPP
3.1. Modeling Algorithm
The calculation of NPP is based on APAR (400 to 700 nm) and LUE (ε) thus [14]:
| (1) |
Monthly NPP was estimated in the CASA model as follows:
| (2) |
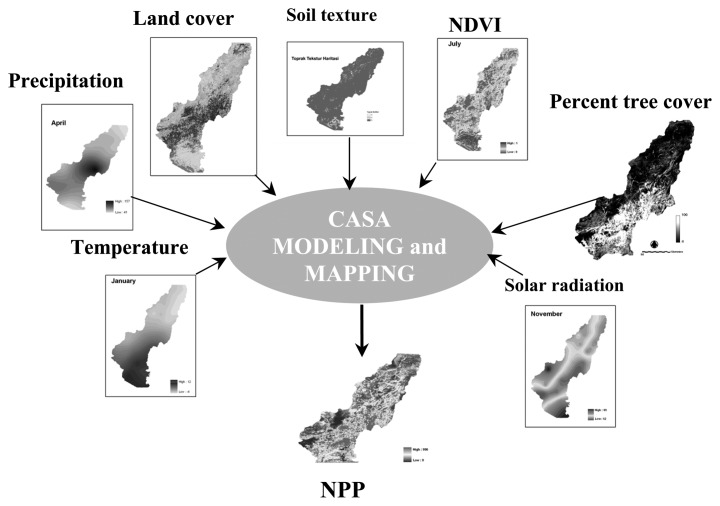
where APAR (in MJ m-2 month-1) is a function of NDVI and incoming PAR; and ε (in g C MJ-1) is a function of maximum achievable LUE adjusted by reduction functions that account for effects of temperature [g(T)] and water [h(W)] stresses [3]. Previous versions of the CASA model [3, 13] used NDVI to estimate the ratio of APAR to PAR (fPAR), while the current model version relies on canopy radiative transfer algorithms designed to generate improved fPAR products as inputs to calculation of carbon assimilation [15].
The above model was implemented to predict NPP as modified by temperature, precipitation, soil texture, solar radiation, fractional tree cover, land cover type, and NDVI (Figure 3).
Figure 3.
A flow diagram of modeling NPP.
3.2. Estimation of Fractional Tree Cover
In the past decades, several efforts to estimate tree canopy cover as a continuous variable have been made by utilizing multiple linear regression (MLR) models [16, 17], linear mixture modeling (LMM) [18], and regression tree (RT) [19-21]. Among these techniques, the regression tree technique as a non-parametric classifier is well suited for mapping percentage tree cover as it requires no prior assumptions about the statistical distribution of training datasets.
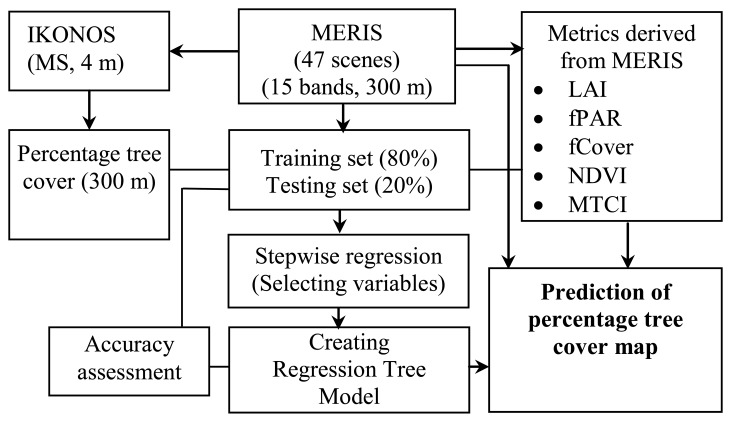
The methodology for this study consisted of five steps: (1) generation of reference percentage tree cover data; (2) derivation of metrics from Envisat MERIS data; (3) selection of explanatory variables; (4) fitting of RT models; and (5) mapping and accuracy assessment (Figure 4). Modeling fractional tree cover relies on the quality of training and testing datasets. Digital multi-spectral IKONOS images with a 4-m spatial resolution were used to derive baseline data of percentage tree cover. Land cover types were classified as and recoded to tree and non-tree pixels at a-4 m spatial resolution. This dataset covered 120 km2. The classification results were then converted to estimate percentage tree cover at the MERIS spatial resolution. The coverage of the IKONOS dataset was equal to 1232 Envisat MERIS pixels.
Figure 4.
Procedure of estimating fractional tree cover using regression tree method.
The following vegetation-related biophysical variables of NDVI, leaf area index (LAI), fPAR, fractional tree cover (fCOVER), and MERIS terrestrial chlorophyll index (MTCI) were derived in addition to the 15 spectral bands of Envisat MERIS data of 390 nm to 1040 nm. LAI, fPAR, and fCOVER were derived using the top of canopy land products (TOA_VEG version 3) algorithm developed by Weiss et al. [22].
This algorithm was implemented using the “Visualisation and Analyzing Tool” of the MERIS/(A)ATSR Toolbox (VISAT) [22]. The index called MTCI developed by Dash and Curran [9] is a ratio of difference in reflectance between bands 10 and 9 to difference in reflectance between bands 9 and 8 of the Envisat MERIS standard band setting.
| (3) |
where R753.75, R708.75, R681.25 are reflectance in the center wavelengths of the Envisat MERIS standard band setting.
Selection of most relevant explanatory variables that accounted for most of variation in percent tree cover was accomplished using the Stepwise Linear Regression (SLR) method from S-PLUS [23]. The SLR method selects the best subset of explanatory variables to be employed in regression tree modeling through a stepwise procedure [24] based on the Cp statistic as follows:
| (4) |
where n is the number of observations (number of training data), p is the number of coefficients (number of predictor variables plus one), sp2 is the mean square error (MSE) of the prediction model, and σ2 is the minimum MSE among the possible models [25]. The Cp statistic provides a convenient criterion for determining whether a model is more accurate by adding or removing the predictor variables as well as for specifying what explanatory variables are significantly related to percentage tree cover.
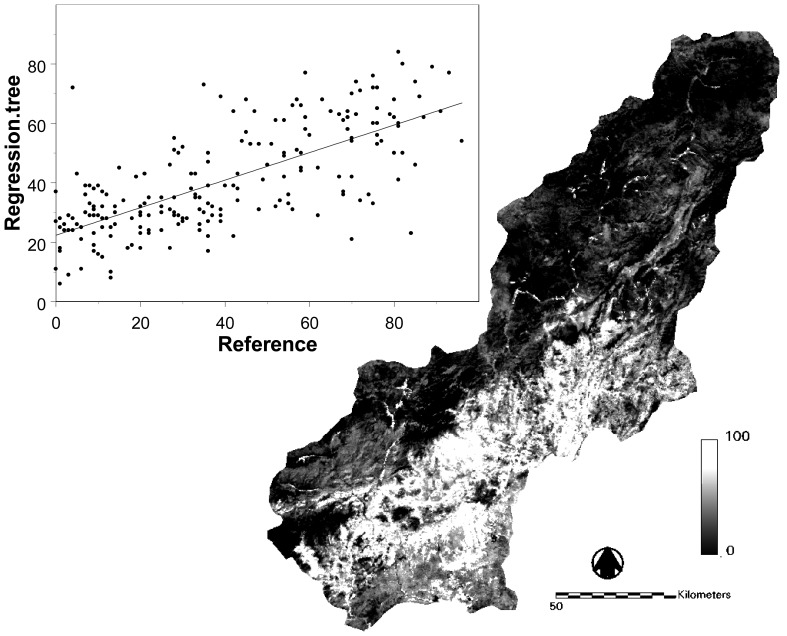
The IKONOS dataset was split into two subsets: training (1023 pixels) and testing (209 pixels). The four models were fitted using the SLR method, and the relationship between tree cover density and Envisat MERIS spectral values were modeled using the RT technique. Accuracy of the final model was determined through validation against the testing data. Model performance was measured based on the coefficient of determination (R2) comparing predicted versus actual tree cover values for the test samples. Final output consisted of spatially interpolated surfaces of fractional tree cover with a 300-m resolution and validation error estimates (Figure 5).
Figure 5.
Predictions of percentage tree cover based on the regression tree (RT) model, and comparison of predicted versus observed tree cover (R2 = 50.4%; n = 209 pixels).
3.3. Mapping Land Cover
The study used a detailed land cover database derived from four data sources: (1) Landsat ETM image dated 17 August 2003; (2) topographic maps; (3) land cover information recorded by the State Hydraulic Works (DSI); and (4) ground-truthing data from field surveys. The Landsat ETM image was geometrically corrected and geocoded to the Universal Transverse Mercator (UTM) coordinate system by using 1:25 000 scale topographic maps.
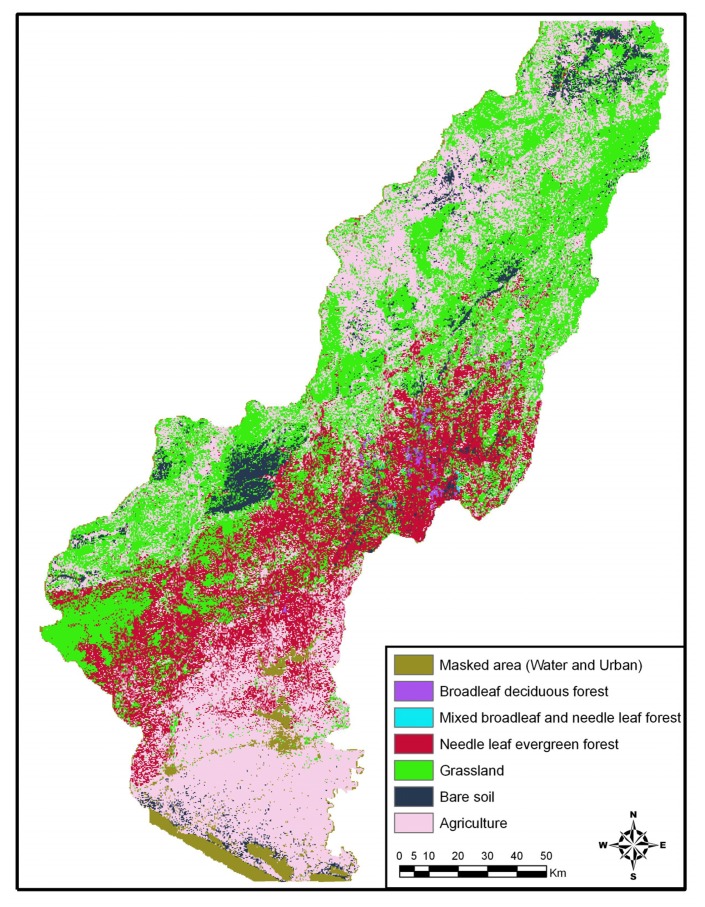
Image classification was carried out using a maximum likelihood algorithm with supervised training (Figure 6). The classifier was provided with spectral reflectance properties of each class in the form of mean reflectance for each spectral waveband and associated covariance matrix. The data were generated from the selection of sample training pixels for each class from the ground data. The output was comprised of 27 land cover classes with a 30-m resolution initially. The land cover classes were amalgamated to 7 classes as defined by the CASA model and then rasterized to a 300-m cell size.
Figure 6.
Land cover map derived from Landsat ETM image.
3.4. NDVI
Monthly NDVI images were derived from 47 Envisat MERIS images recorded for the period of March 2003 to September 2005. Monthly composites were created, and bands 10 and 6 were used to produce monthly NDVI values of 0 to 1 as an input to the CASA model.
4. Results and Discussion
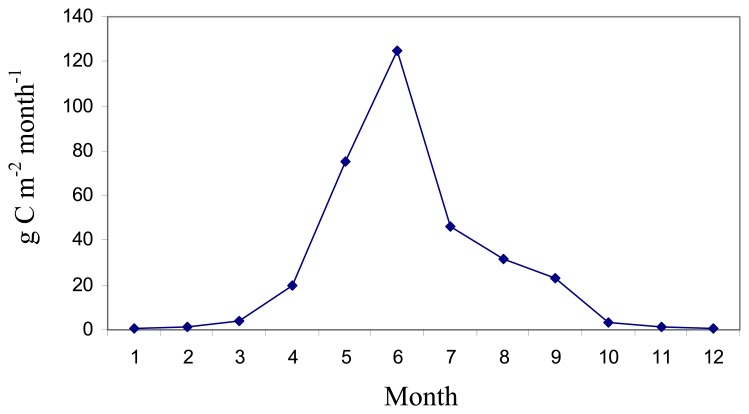
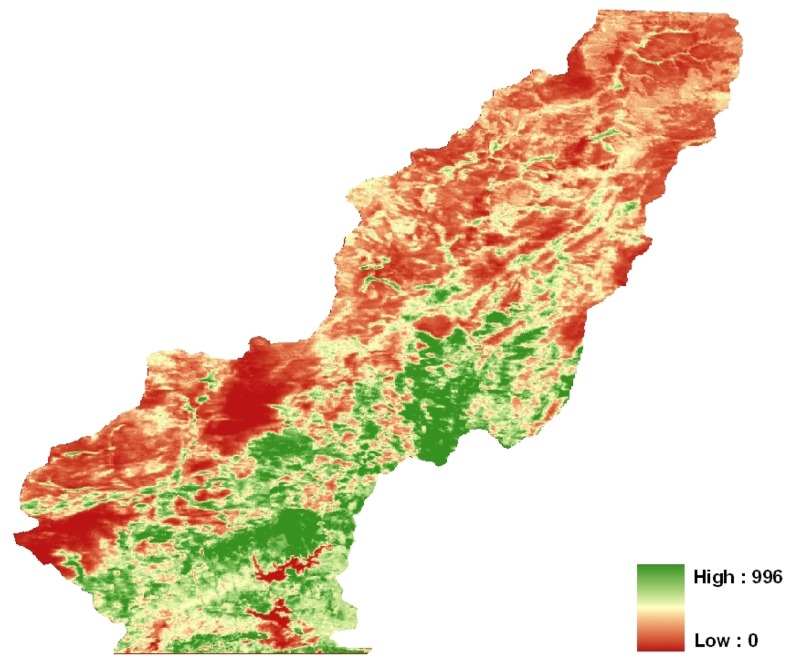
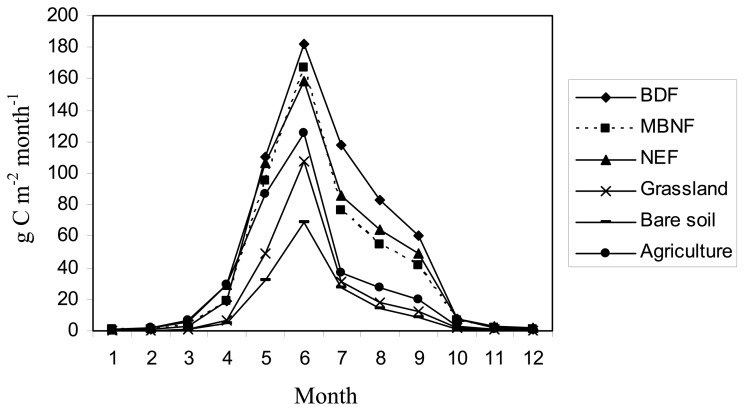
This study showed that Envisat MERIS data successfully captured the heterogeneity of the Mediterranean land covers for the quantification of monthly NPP patterns over a complex terrain. Monthly NPP maps revealed that mean monthly NPP differed significantly from one another and ranged from 0.65 to 125 g C m-2 month-1. Monthly changes in estimated NPP are shown in Figure 7. Both monthly and total NPP were mapped at the 300-m grid size (Figure 8). Mean annual NPP was estimated at ca. 388 g C m-2 yr-1 for the study area (Table 1). Major land cover types of Seyhan watershed and their monthly NPP are shown in Figure 9. Evrendilek et al. [11] estimated above- and below-ground NPP and litterfall of pure stands of Pinus brutia, Pinus nigra, Cedrus libani, Juniperus excelsa, and a mixed stand of Abies cilicica, P. nigra, and C. libani in their field measurements in the upper Seyhan watershed (Katran Çukuru-Aladağ) and reported a mean above-ground NPP of 1148 ± 626 g C m-2 yr-1.
Figure 7.
Monthly NPP results from the CASA algorithm.
Figure 8.
Annual variation in NPP (g C m-2 yr-1) predicted for Seyhan watershed.
Table 1.
Annual net primary productivity (NPP) of major land covers and land uses of Seyhan watershed according to the CASA algorithm.
| Land-Use Land-Cover Classes | Mean NPP (g C m-2yr-1) |
|---|---|
| Broadleaf deciduous forest | 588.6 |
| Mixed broadleaf and needleleaf forest | 468.7 |
| Needleleaf evergreen forest | 512.9 |
| Grassland | 227.7 |
| Bare soil | 158.4 |
| Agriculture | 338.7 |
Figure 9.
Monthly NPP estimates of major land covers and land uses of Seyhan watershed according to the CASA algorithm: BDF: Broadleaf deciduous forest; NEF: Needleleaf evergreen forest; MBNF: Mixed broadleaf and needleleaf forest.
The difference between the mean NPP estimates by this study and Evrendilek et al. [11] can be attributed to the fact that the mean NPP by Evrendilek et al. [11] was derived from relatively less disturbed and productive forest stands of the upper Seyhan watershed. Spatial variation in NPP was driven primarily through variation in APAR and secondarily through variation in ε [26, 27]. However, spatial and seasonal variations and patterns in NPP are largely dependent on interactions among climate (e.g. precipitation, and PAR), biological processes (e.g. succession, species composition, herbivory, and nutrient uptake), and human disturbances (global climate change, pollution of air, water and soil, urban sprawl, clear-cut, over-harvesting, over-grazing, and land use conversions).
The Mediterranean environment has not only a complex terrain but also sparse vegetation cover. Calcareous soil greatly influences reflectance from sparse cover of the Mediterranean forests. High reflectance from the soil causes a significant albedo effect, and hence, overwhelms reflectance from the vegetation component, thus leading to underestimation of NPP. Envisat MERIS images acquired in the driest summer months in the Mediterranean improved discrimination of overall vegetation and land cover types. Hansen et al. [28] stated that dry season imageries enhanced the characterization of some grasslands at their peak NDVI indistinguishable from woodlands. The RT method increased the accuracy of modeling tree cover by assisting in the exploration of the relationships among individual Envisat MERIS wavebands, and biophysical variables of NDVI, LAI, fPAR and MTCI as well as in the calibration of the model along the entire continuum of fractional tree cover.
In relation to the increases in greenhouse gases (GHGs) in the atmosphere and associated global climate change, monitoring of interactive impacts of CO2 fertilization, increased air temperature, and distorted precipitation regime on the structure and function of forest ecosystems by historical satellite time series plays a crucial role in understanding spatio-temporal responses and adaptations, particularly, in more ecologically sensitive regions such as the Mediterranean basin. Regional ecosystem modeling coupled with sensors with a wide field of view and very high revisit frequency may bridge the gap between global and local biogeochemical analyses. Such an approach provides a means of understanding and assessing the regional ecological and economic implications and consequences of global climate change on the productivity of semi-arid ecosystems in the Mediterranean basin.
5. Conclusions
The results of this study revealed that the combination of Envisat MERIS sensor and the CASA algorithm can successfully be used to quantify the monthly dynamics of NPP within the topographically complex terrain of the Mediterranean environment. Envisat MERIS data appeared to be useful in detecting land-use and land-cover mosaics, their NPP dynamics, and thus, C sink patterns by virtue of their spatial and spectral resolutions. The radiometric quality of the sensors is even more crucial in complex terrains with variations in elevation and fractional vegetation cover such as the Mediterranean basin for estimating land cover and NPP mosaics as supported by ground measurements for validation.
Acknowledgments
We gratefully acknowledge the research project grants (KARIYER-TOVAG-104O550 and TOVAG-JPN-04-103O011) from the Scientific and Technological Research Council (TUBITAK) of Turkey and the Scientific Research Project Administration Units of Cukurova University, Abant Izzet Baysal University, and Erciyes University.
References
- 1.Lobell D.B., Hicke J.A., Asner G.P., Field C.B., Tucker C.J., Los S.O. Satellite estimates of productivity and light use efficiency in United States agriculture 1982–1998. Global Change Biology. 2002;8(8):722–735. [Google Scholar]
- 2.Dixon R.K., Brown S., Houghton R.A., Solomon A.M., Trexler M.C., Wisniewski J. Carbon pools and flux of global forest ecosystems. Science. 1994;263(5144):185–190. doi: 10.1126/science.263.5144.185. [DOI] [PubMed] [Google Scholar]
- 3.Potter C.S., Randerson J.T., Field C.B., Matson P.A., Vitousek P.M., Mooney H.A., Klooser S.A. Terrestrial ecosystem production: A process model based on global satellite and surface data. Global Biogeochemical Cycles. 1993;7(4):811–841. [Google Scholar]
- 4.Ruimy A., Dedieu G., Saugier B. Methodology for the estimation of terrestrial net primary production from remotely sensed data. Journal of Geophysical Research. 1994;99(D3):5263–5284. [Google Scholar]
- 5.Prince S.D., Goward S.N. Global primary production: a remote sensing approach. Journal of Biogeography. 1995;22(4-5):815–835. [Google Scholar]
- 6.Malmstrom C.M., Thompson M.V., Juday G.P., Los S.O., Randerson J.T., Fıeld C.B. Interannual variation in global-scale net primary production: testing model estimates. Global Biogeochemical Cycles. 1997;11(3):367–392. [Google Scholar]
- 7.Running S.W., Baldocchi D.D., Turner D.P., Gower S.T., Bakwin P.S., Hibbard K.A. A global terrestrial monitoring network integrating tower fluxes, flask sampling, ecosystem modeling and EOS satellite data. Remote Sensing of Environment. 1999;70(1):108–127. [Google Scholar]
- 8.Verstraete M.M., Pinty B., Curran P.J. MERIS potential for land applications. International Journal of Remote Sensing. 1999;20(9):1747–1756. [Google Scholar]
- 9.Dash J., Curran P.J. The MERIS terrestrial chlorophyll index. International Journal of Remote Sensing. 2004;25(23):5403–5413. [Google Scholar]
- 10.Davis P.H. Flora of Turkey and the East Aegean Islands. Edinburgh University Press; Edinburgh: 1965. [Google Scholar]
- 11.Evrendilek F., Berberoglu S., Taskinsu-Meydan S., Yilmaz E. Quantifying carbon budgets of conifer Mediterranean forest ecosystems, Turkey. Environmental Monitoring and Assessment. 2006;119(1-3):527–543. doi: 10.1007/s10661-005-9041-4. [DOI] [PubMed] [Google Scholar]
- 12.Soil Survey Staff . Keys to soil taxonomy. USDA-NRCS, US Government Printing Office; Washington, D.C.: 1998. [Google Scholar]
- 13.Potter C.S., Davidson E.A., Klooster S.A., Nepstad D.C., De Negreiros G.H., Brooks V. Regional application of an ecosystem production model for studies of biogeochemistry in Brazilian Amazonia. Global Change Biology. 1998;4(3):315–333. [Google Scholar]
- 14.Monteith J.L. Solar radiation and productivity in tropical ecosystems. Journal of Applied Ecology. 1972;9:747–766. [Google Scholar]
- 15.Knyazikhin Y., Martonchik J.V., Myneni R.B., Diner D.J., Running S.W. Synergistic algorithm for estimating vegetation canopy leaf area index and fraction of absorbed photosynthetically active radiation from MODIS and MISR data. Journal of Geophysical Research-Atmospheres. 1998;103(D24):32257–32275. [Google Scholar]
- 16.Zhu Z., Evans D.L. United States forest types and predicted percent forest cover from AVHRR data. Photogrammetric Engineering and Remote Sensing. 1994;60(5):525–531. [Google Scholar]
- 17.Defries R.S., Hansen M.C., Townshend J.R.G. Global continuous fields of vegetation characteristics: a linear mixture model applied to multi-year 8km AVHRR data. International Journal of Remote Sensing. 2000;21(6-7):1389–1414. [Google Scholar]
- 18.Iverson L.R., Cook E.A., Graham R.L. A technique for extrapolating and validating forest cover across large regions: calibrating AVHRR data with TM data. International Journal of Remote Sensing. 1989;10(11):1805–1812. [Google Scholar]
- 19.Hansen M.C., Defries R.S., Townshend J.R.G., Sohlberg R.A. Global land cover classification at 1km spatial resolution using a classification tree approach. International Journal of Remote Sensing. 2000;21(6-7):1331–1364. [Google Scholar]
- 20.Hansen M.C., Defries R.S., Townshend J.R.G., Carroll M., Dimiceli C., Sohlberg R.A. Global percent tree cover at a spatial resolution of 500 metres: First results of the MODIS vegetation continuous fields algorithm. Earth Interactions. 2003;7:1–15. [Google Scholar]
- 21.Hansen M.C., Townshend J.R.G., Defries R.S., Carroll M. Estimation of tree cover using MODIS data at global, continental and regional/local scales. International Journal of Remote Sensing. 2005;26(19):4359–4380. [Google Scholar]
- 22.Baret F., Pavageau K., Weiss M., Moreno J., Berthelot B., Gonzales M.C. Report on the validation of MERIS Top of canopy Land Products. (TOA_VEG) land products. 2006 Contract ESA AO/1-4233/02/I-LG. [Google Scholar]
- 23.Insightful Corp . S-Plus 6.2. Guide to Statistics. Volume 2. Seattle: Washington: 2001. [Google Scholar]
- 24.Helsel D.R., Hirsch R.M. Statistical methods in water resources. Elsevier Science Publishers; Amsterdam: 1992. [Google Scholar]
- 25.Rokhmatuloh R., Al-Bilbisi H., Arihara K., Kobayashi T., Nitto D., Erdene B., Hirabayashi K., Javzandulam T. A., Lee S.A., Migita E., Soliman N., Ouma Y., Aslam M., Tateishi R. The 11th CEReS International Symposium on Remote Sensing. Chiba University; Chiba, Japan: 2005. Application of Regression Tree Method for Estimating Percent Tree Cover of Asia with QuickBird Images as Training Data. [Google Scholar]
- 26.Field C.B., Randerson J.T., Malmstrom C.M. Global net primary production: Combining ecology and remote sensing. Remote Sensing of Environment. 1995;51(1):74–88. [Google Scholar]
- 27.Goetz S.J., Prince D.S., Goward N.S., Thawley M.M., Small J. Satellite remote sensing of primary production: an improved production efficiency modeling approach. Ecological Modelling. 1999;122:239–255. [Google Scholar]
- 28.Hansen M.C., Defries R.S., Townshend J.R.G., Sohlberg R.A., Dimiceli C., Carroll M. Towards an operational MODIS continuous field of percent tree cover algorithm: Examples using AVHRR and MODIS data. Remote Sensing of Environment. 2002;83:303–319. [Google Scholar]
- 29.Wali M.K., Evrendilek F., West T., Watts S., Pant D., Gibbs H., McClead B. Assessing terrestrial ecosystem sustainability: usefulness of regional carbon and nitrogen models. Nature & Resources. 1999;35(4):20–33. [Google Scholar]
- 30.Evrendilek F., Berberoglu S. Quantifying spatial patterns of bioclimatic zones and controls in Turkey. Theoretical and Applied Climatology. 2007 doi: 10.1007/s00704-006-0294-9. [DOI] [Google Scholar]
- 31.Evrendilek F., Wali M.K. Changing global climate: historical carbon and nitrogen budgets and projected responses of Ohio's cropland ecosystems. Ecosystems. 2004;7(4):381–392. [Google Scholar]


