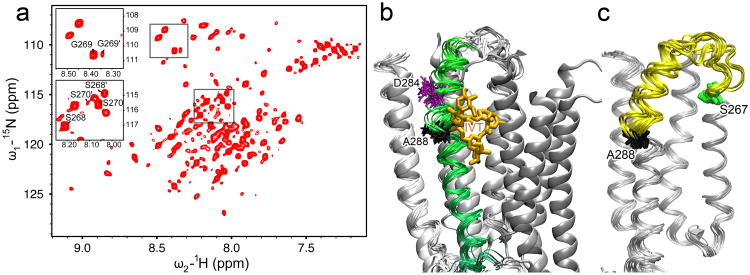
Figure 4. Conformational dynamics around TM2-3 loop.
(a) A representative 1H-15N heteronuclear single quantum correlation spectrum of the hGlyR-α1 TMD in LPPG micelles at 40°C. Several residues at the C-terminus of TM2 show two sets of peaks, as exemplified in the insert for S268(16′), G269(17′), and S270(18′), indicating that two conformations coexist in this region and undergo slow conformational exchange. (b) The 15 lowest target function structures of the hGlyR-α1 TMD (ribbons) are aligned with the crystal structure of GluCl (cartoon, PDB code: 3rhw). TM3 of the hGlyR-α1 TMD is highlighted in green. Ivermectin (orange sticks) observed in GluCl partially overlaps with the kink at A288 (black sticks) in the NMR structures of the hGlyR-α1 TMD. The residue D284 (purple sticks), located 4 residues upstream of A288, may be responsible for the kink (Langelaan et al., 2010). (c) The segment showing high dynamics is highlighted in yellow between S267 (green) and A288 (black) in the bundle of 15 lowest target function NMR structures. See also Figure S6.

